
Sean Pavone / iStock via Getty Images
Gateway Arch - St. Louis - Missouri by Arch_Sam / BY 2.0 (https://creativecommons.org/licenses/by/2.0/)
shalunts / iStock via Getty Images
Sean Pavone / iStock via Getty Images
mobili / Flickr
Sean Pavone / iStock via Getty Images
Sundry Photography / iStock via Getty Images
New Orleans, Louisiana by szeke / BY-SA 2.0 (https://creativecommons.org/licenses/by-sa/2.0/)
f11photo / Shutterstock.com
Joseph Sohm / Shutterstock.com

bluejayphoto / iStock via Getty Images
Sean Pavone / iStock via Getty Images

LeoPatrizi / E+ via Getty Images

Sundry Photography / Shutterstock.com
DutcherAerials / E+ via Getty Images








14 U.S. Neighborhoods Examined in Crime Studies
There's no shortage of lists claiming to name America's most dangerous neighborhoods. The trouble is that a crime rate for a few city blocks isn't always measured the same way as the rate for an entire city. Some neighborhood lists use actual police incidents, while others rely on estimates or predictions. Put them together without explaining the difference, and the results can be misleading.
This 24/7 Tempo slideshow revisits 14 U.S. areas that appeared in earlier crime estimates and studies. Four came from third-party neighborhood profiles, while the other 10 were Census block groups examined in a 2021 Augurisk study reported by Forbes. Augurisk trained its prediction model on incidents from 2014 to 2018 and used older Census estimates for context. Its predicted rates are not verified 2026 crime totals, and the FBI does not produce an official nationwide ranking of individual neighborhoods.
We've added police reporting available in 2026 to show how conditions in the surrounding cities have changed. Those newer statistics describe cities, not necessarily the exact streets in the older studies. And while 2027 is approaching, there isn't a defensible set of 2027 neighborhood forecasts for these 14 locations. Rather than invent one, here's what the original figures actually measured and what the newer numbers can—and can't—tell us.
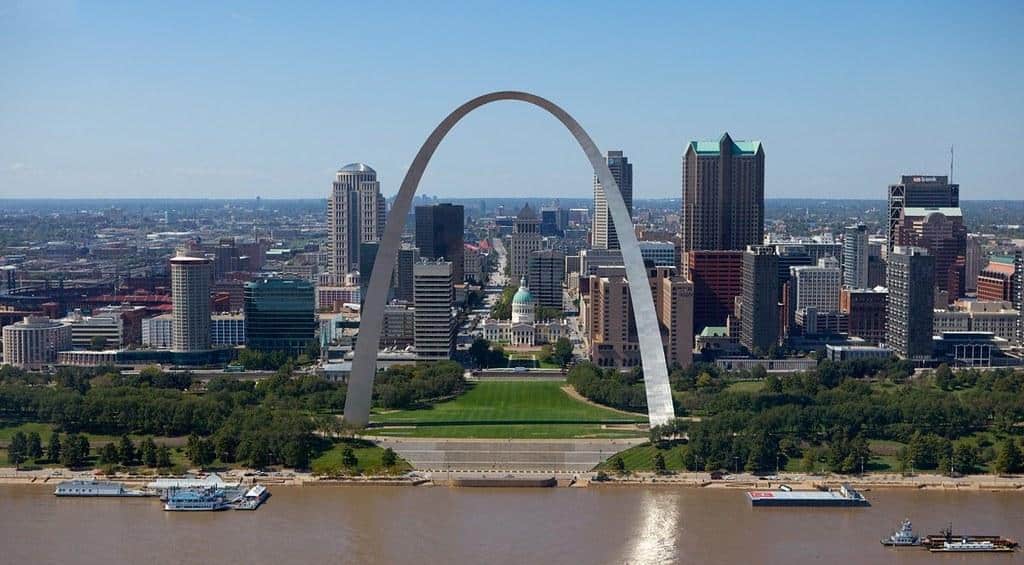
Peabody-Darst-Webbe (St. Louis)
Peabody-Darst-Webbe has appeared in neighborhood crime comparisons, but the numbers need a little explaining. An earlier AreaVibes estimate cited in the original article put overall crime at 10,566 incidents per 100,000 residents, including 3,194 violent offenses. Those figures were modeled, not direct FBI counts for the neighborhood, and should not be presented as its 2026 crime rate. More recent reporting offers a different picture of St. Louis as a whole: police recorded 88 homicides through September 2026, compared with 109 over the same nine months in 2025. That's a citywide change, not a measured drop for Peabody-Darst-Webbe. The neighborhood is also affected by the planned redevelopment of Clinton-Peabody public housing, another reason an older snapshot alone cannot describe the area today.
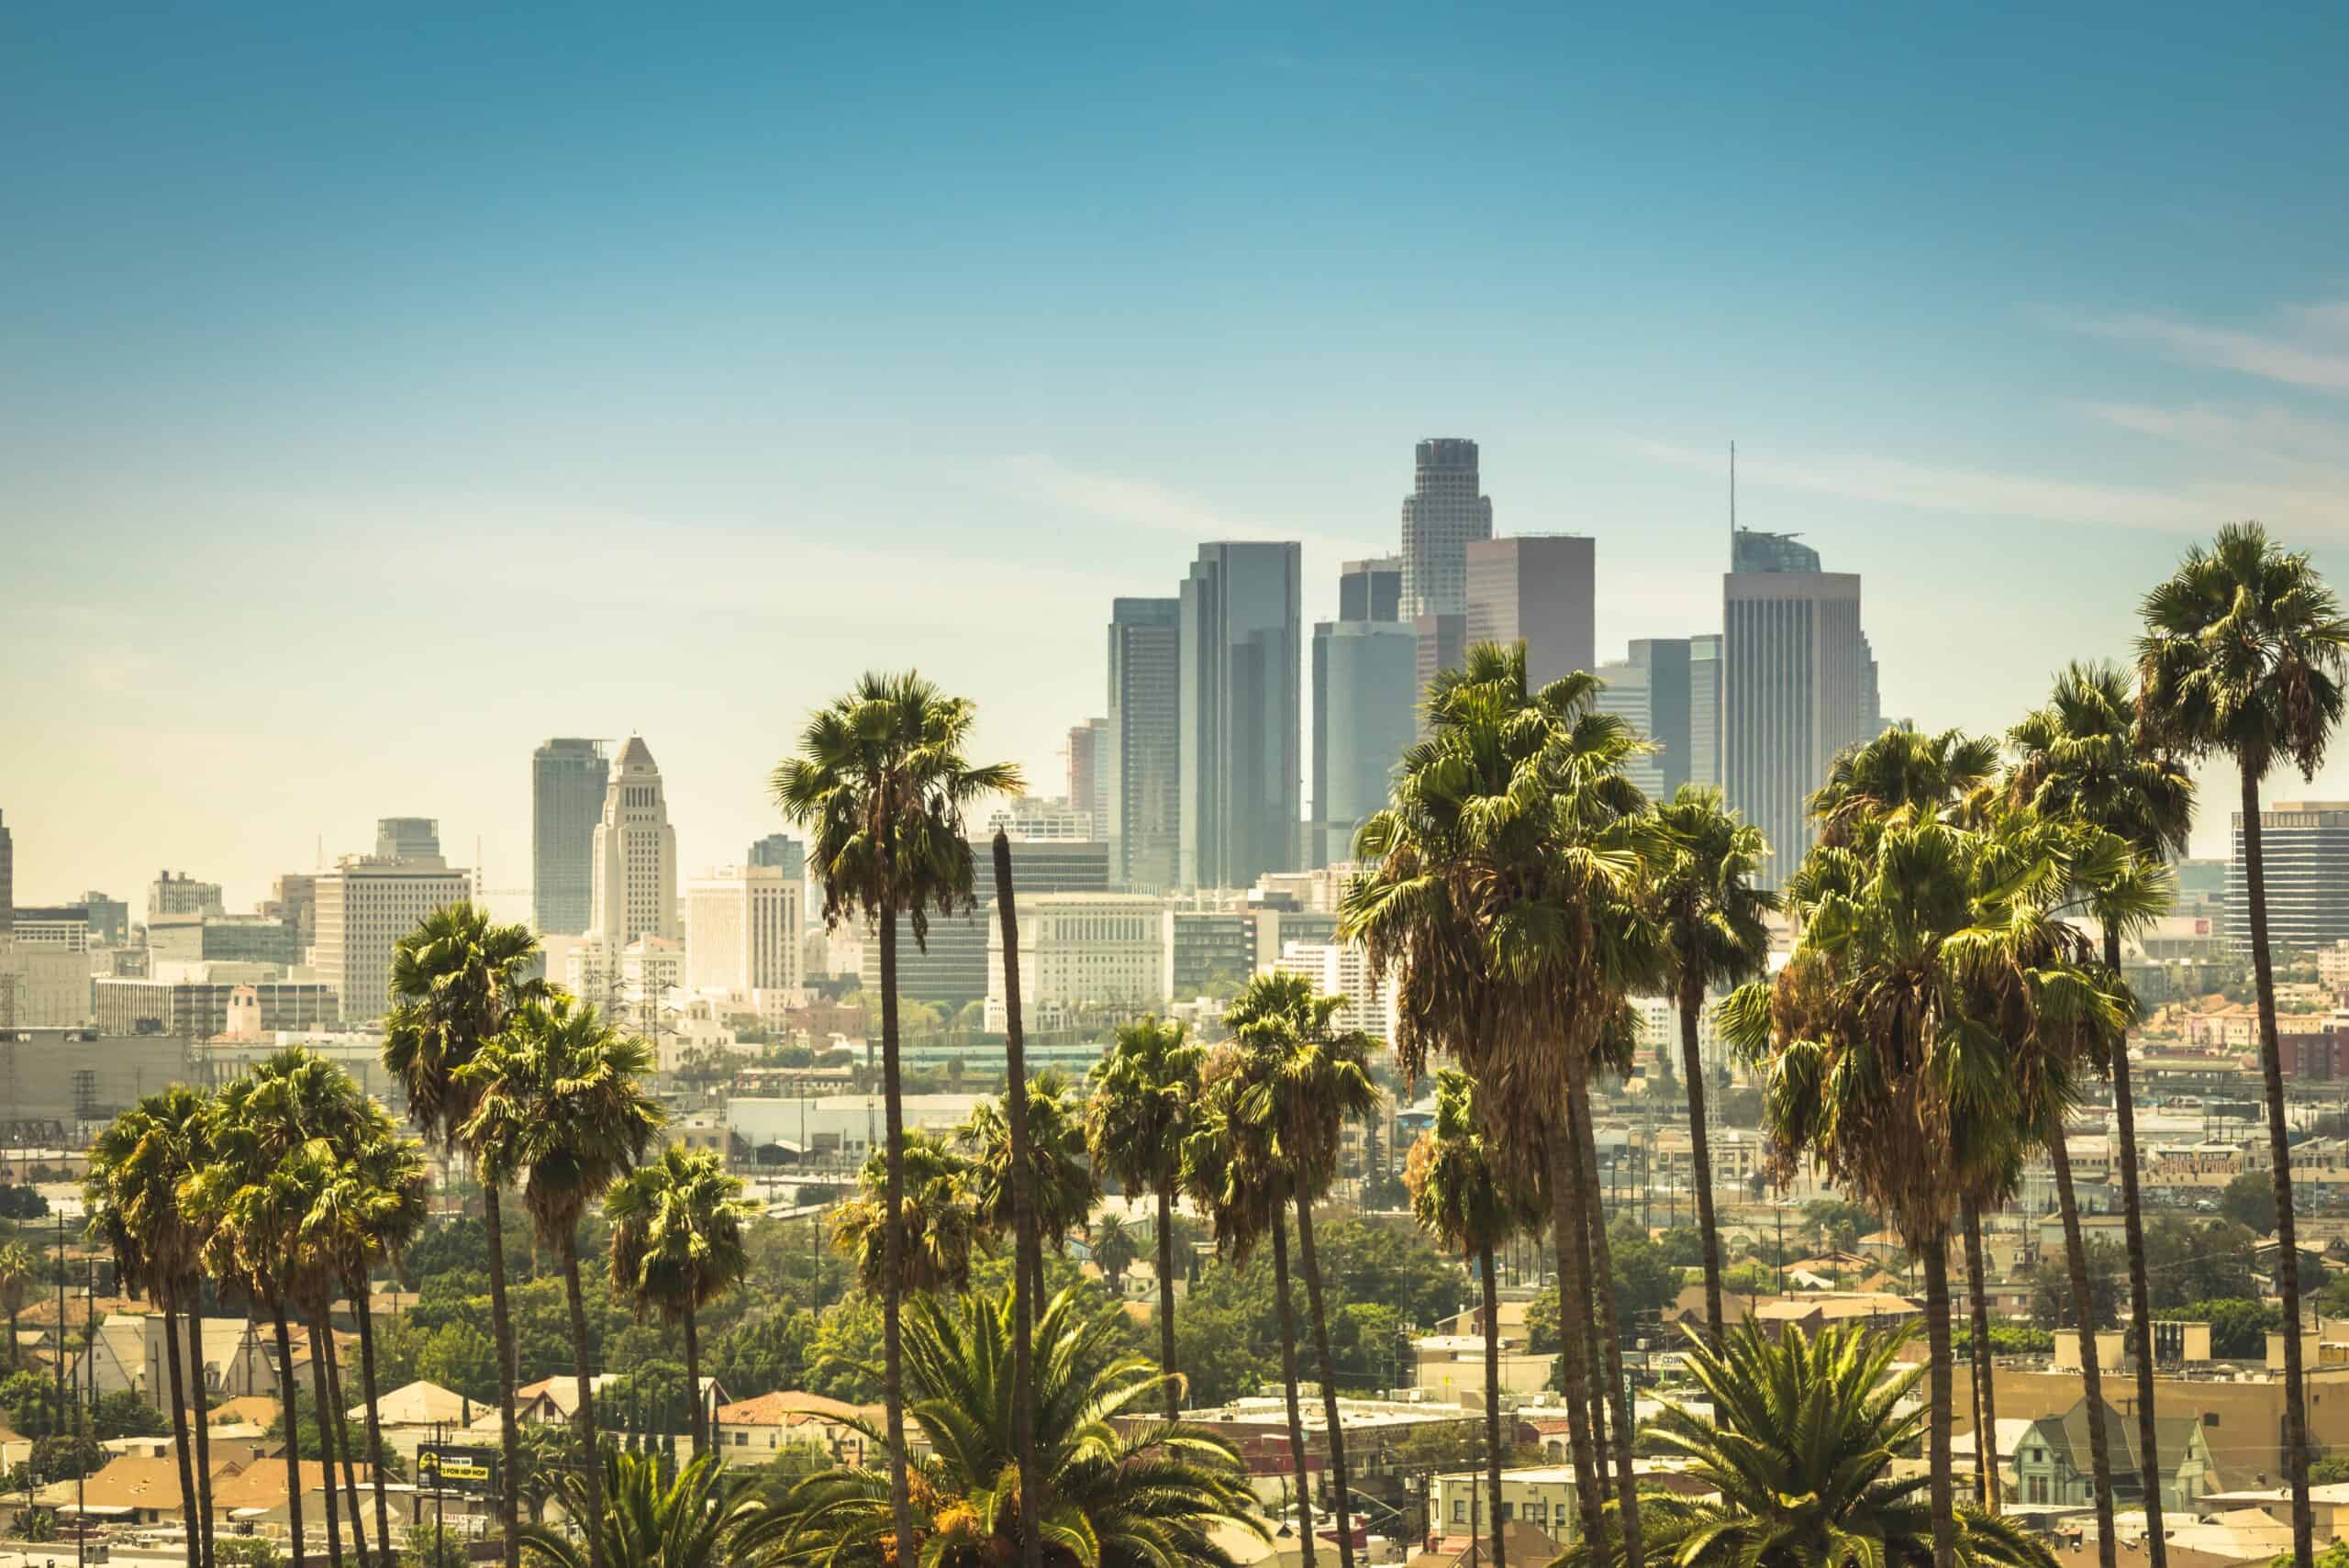
East 5th Street and South San Pedro Street (Los Angeles)
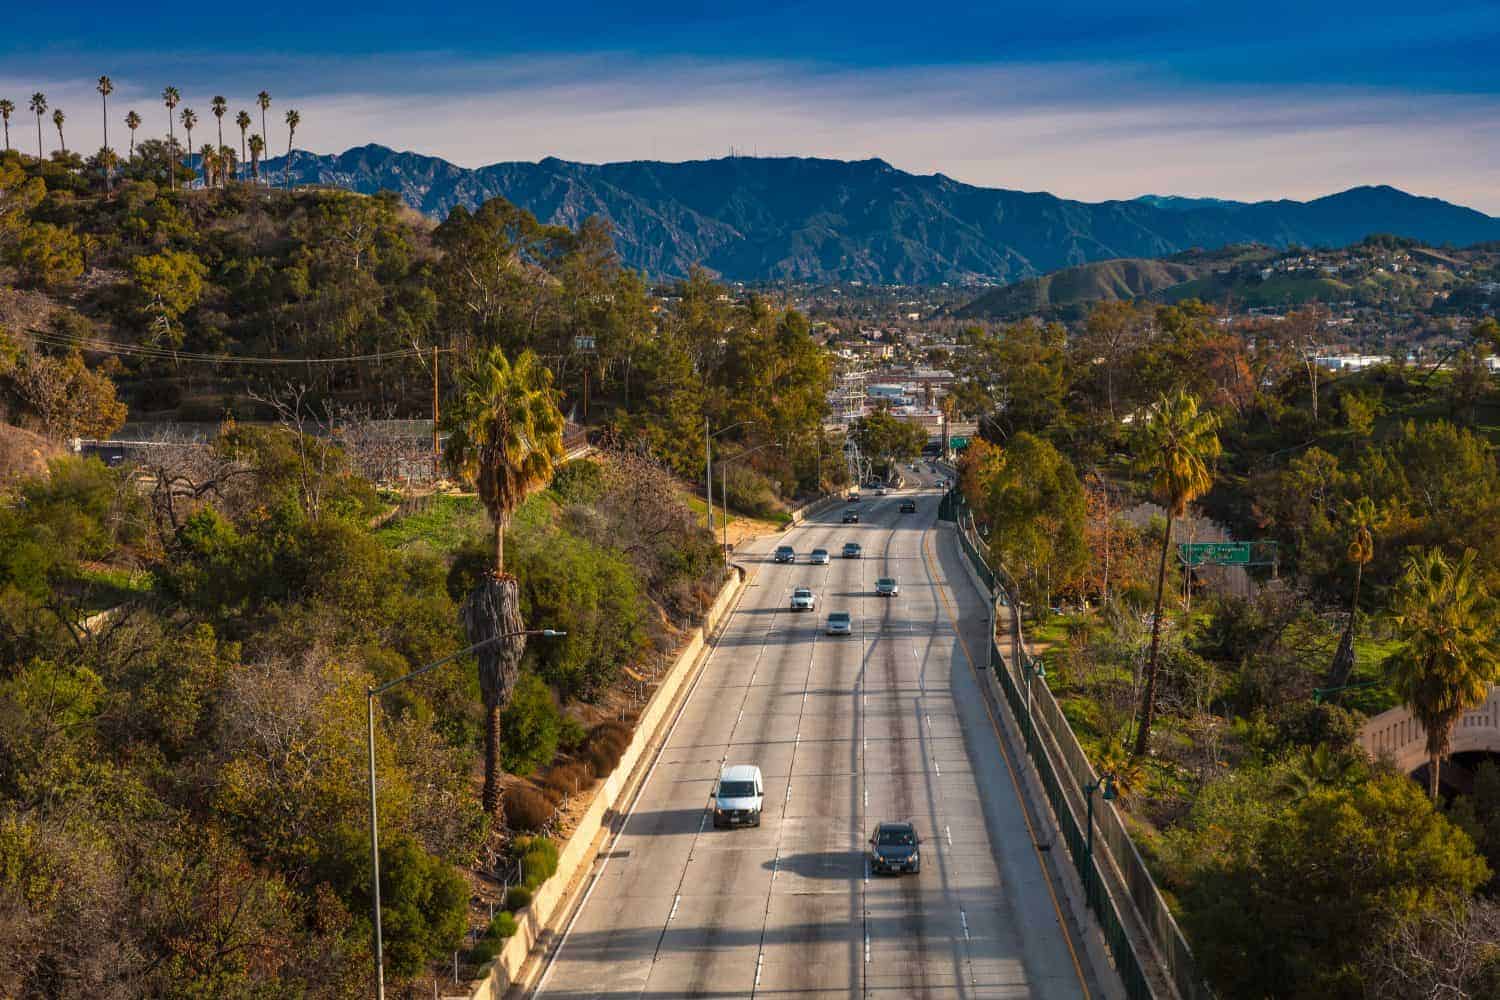
A small area of downtown Los Angeles near East 5th and South San Pedro streets topped a much-discussed 2021 analysis by risk-modeling company Augurisk. The model predicted 239 violent incidents per year and an unusually high rate of 347 per 1,000 residents. Neither number was an observed 2026 police tally. The model also relied on older neighborhood characteristics, making it especially risky to treat the estimate as a current safety assessment. Los Angeles has reported substantial changes since then: a city announcement in October 2026 said citywide homicides were down 47% compared with the same point in 2022. That does not tell us how many crimes occurred on these particular blocks, but it makes one thing clear: the 2021 prediction should not be repackaged as a 2027 forecast.
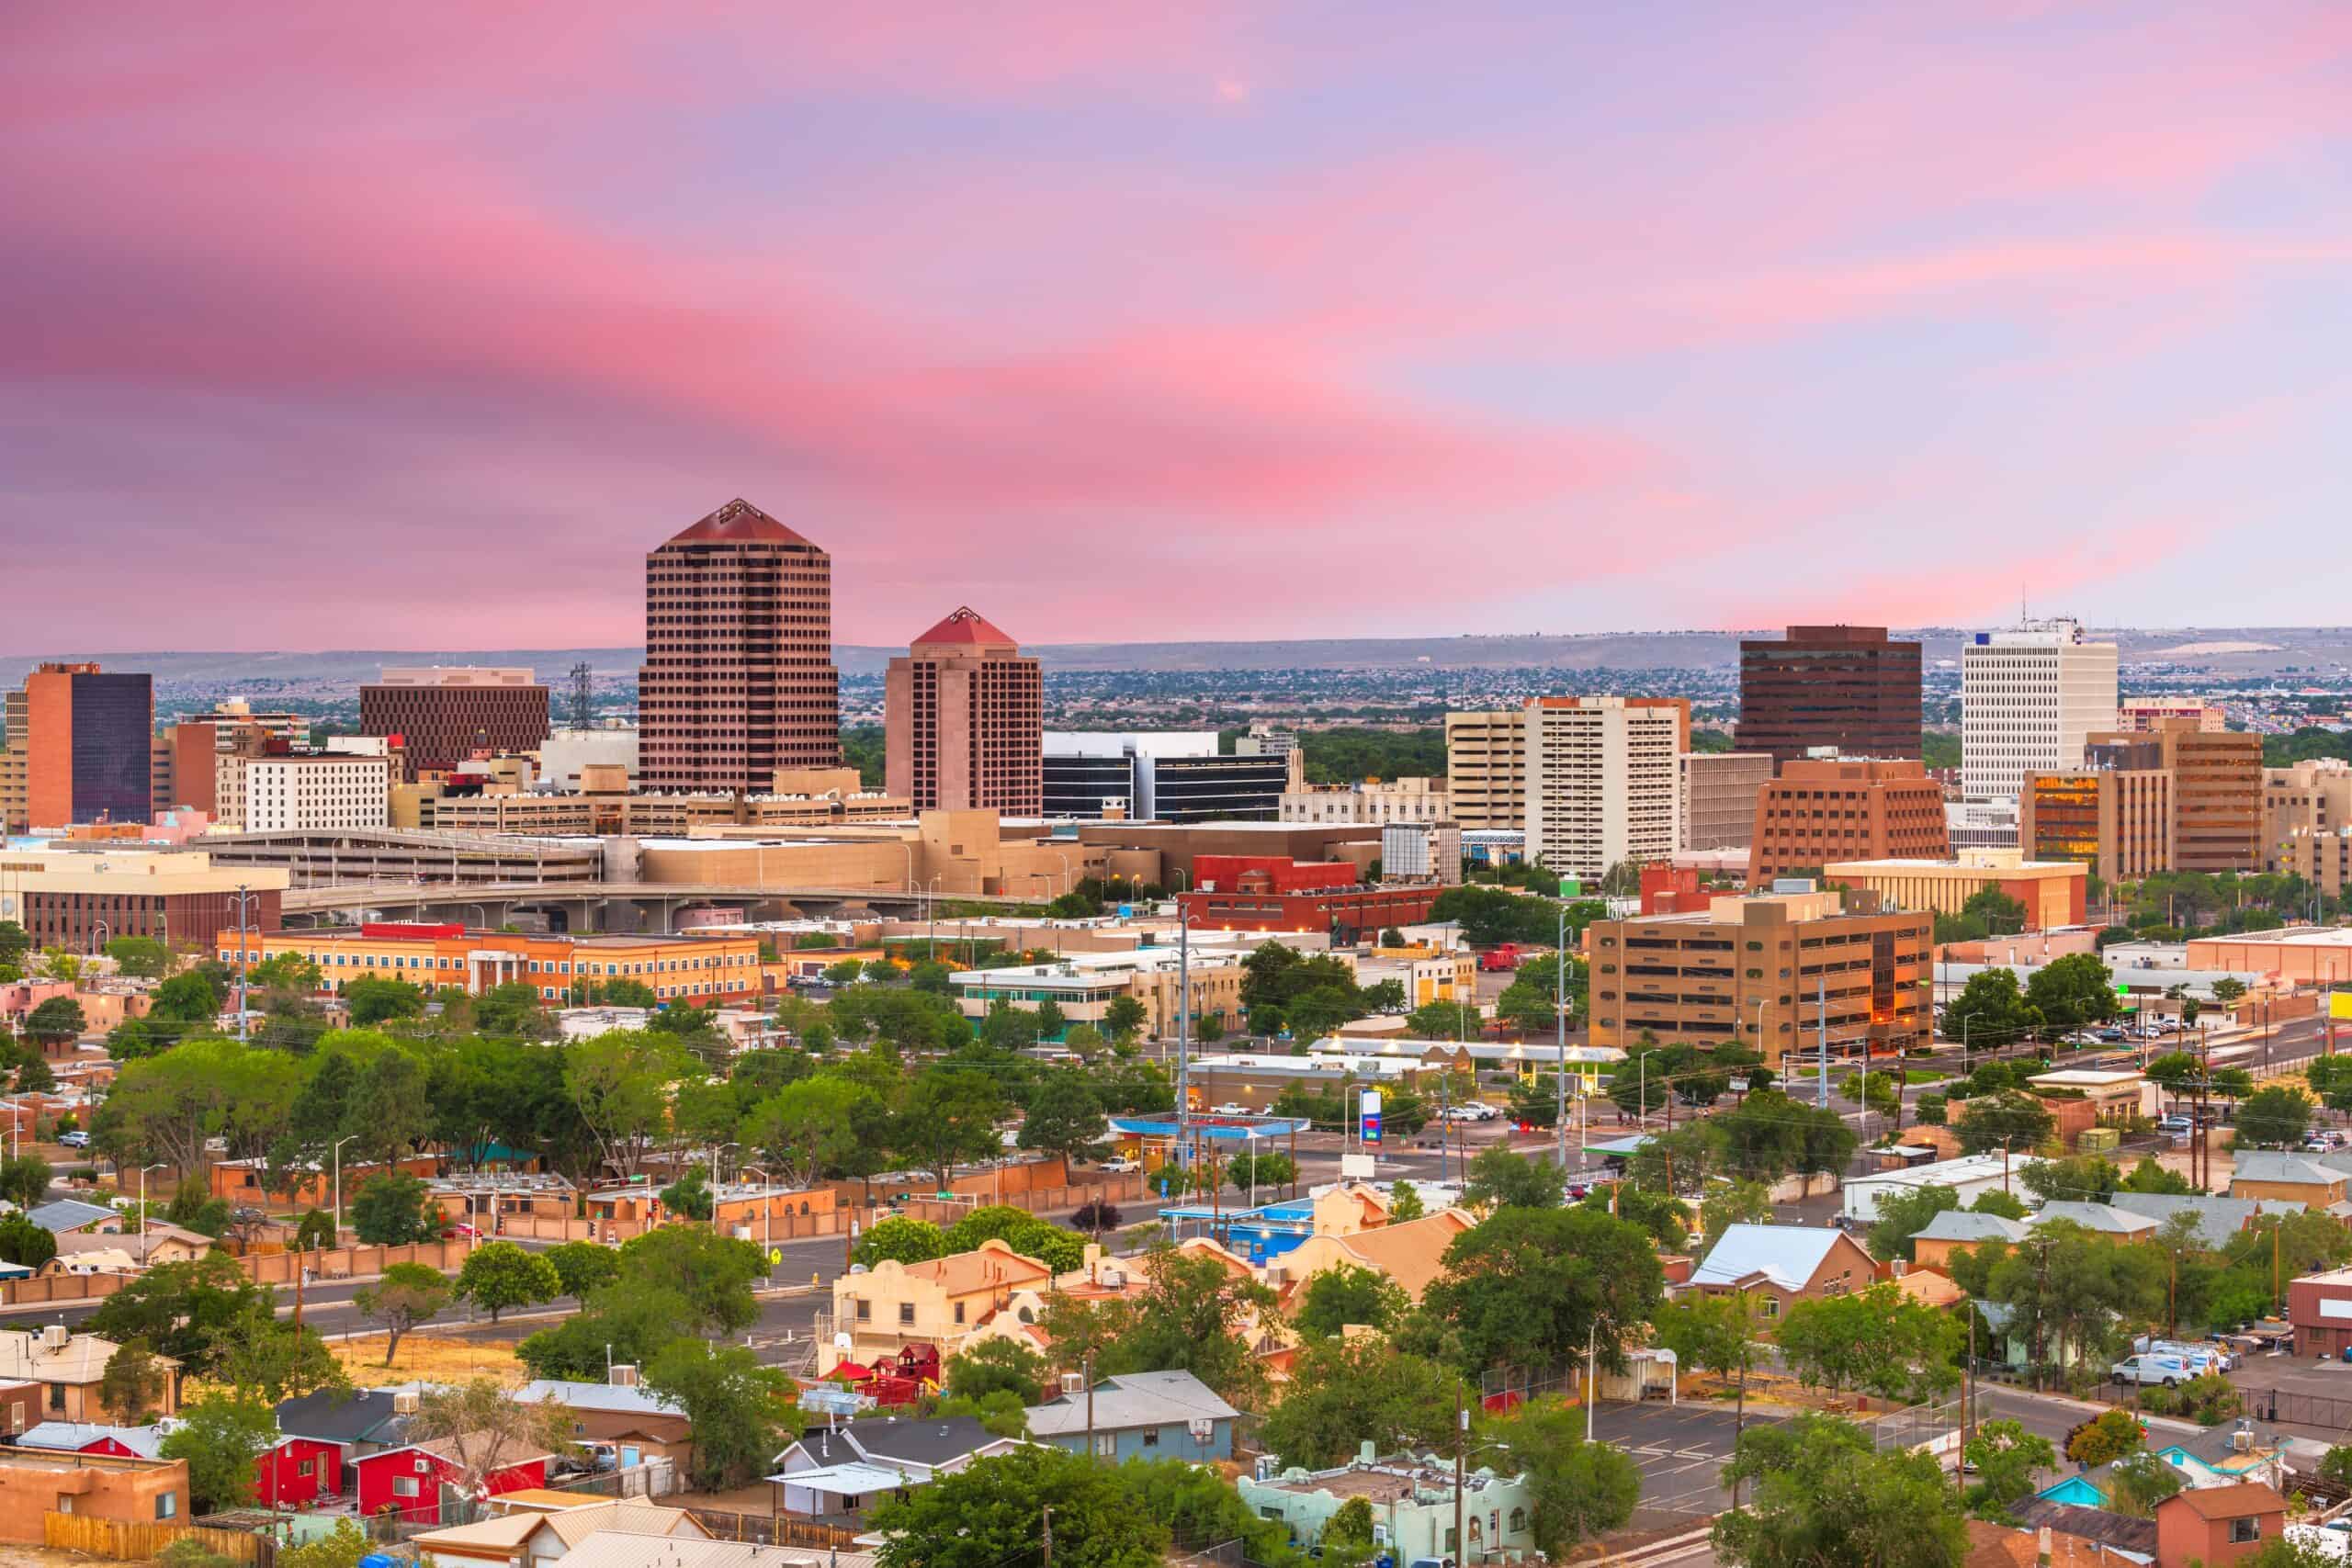
Quigley Park (Albuquerque)
Quigley Park is a residential area in northeast Albuquerque, with a city park at San Pedro Boulevard and Candelaria Road. An earlier AreaVibes model cited in the original story estimated 6,456 total offenses per 100,000 residents, including 1,412 violent crimes. Those were neighborhood estimates, not figures directly reported by the FBI. Albuquerque's own September 2026 police snapshot is more recent but covers the entire city. Through September, the department's selected property offenses were down 26% compared with the same period in 2025. Its selected violent offenses were up 4%, while homicides were down 18%. That's a mixed picture, not a simple declaration that crime is rising or falling everywhere. We could not verify a comparable, official 2026 crime rate specifically for Quigley Park.
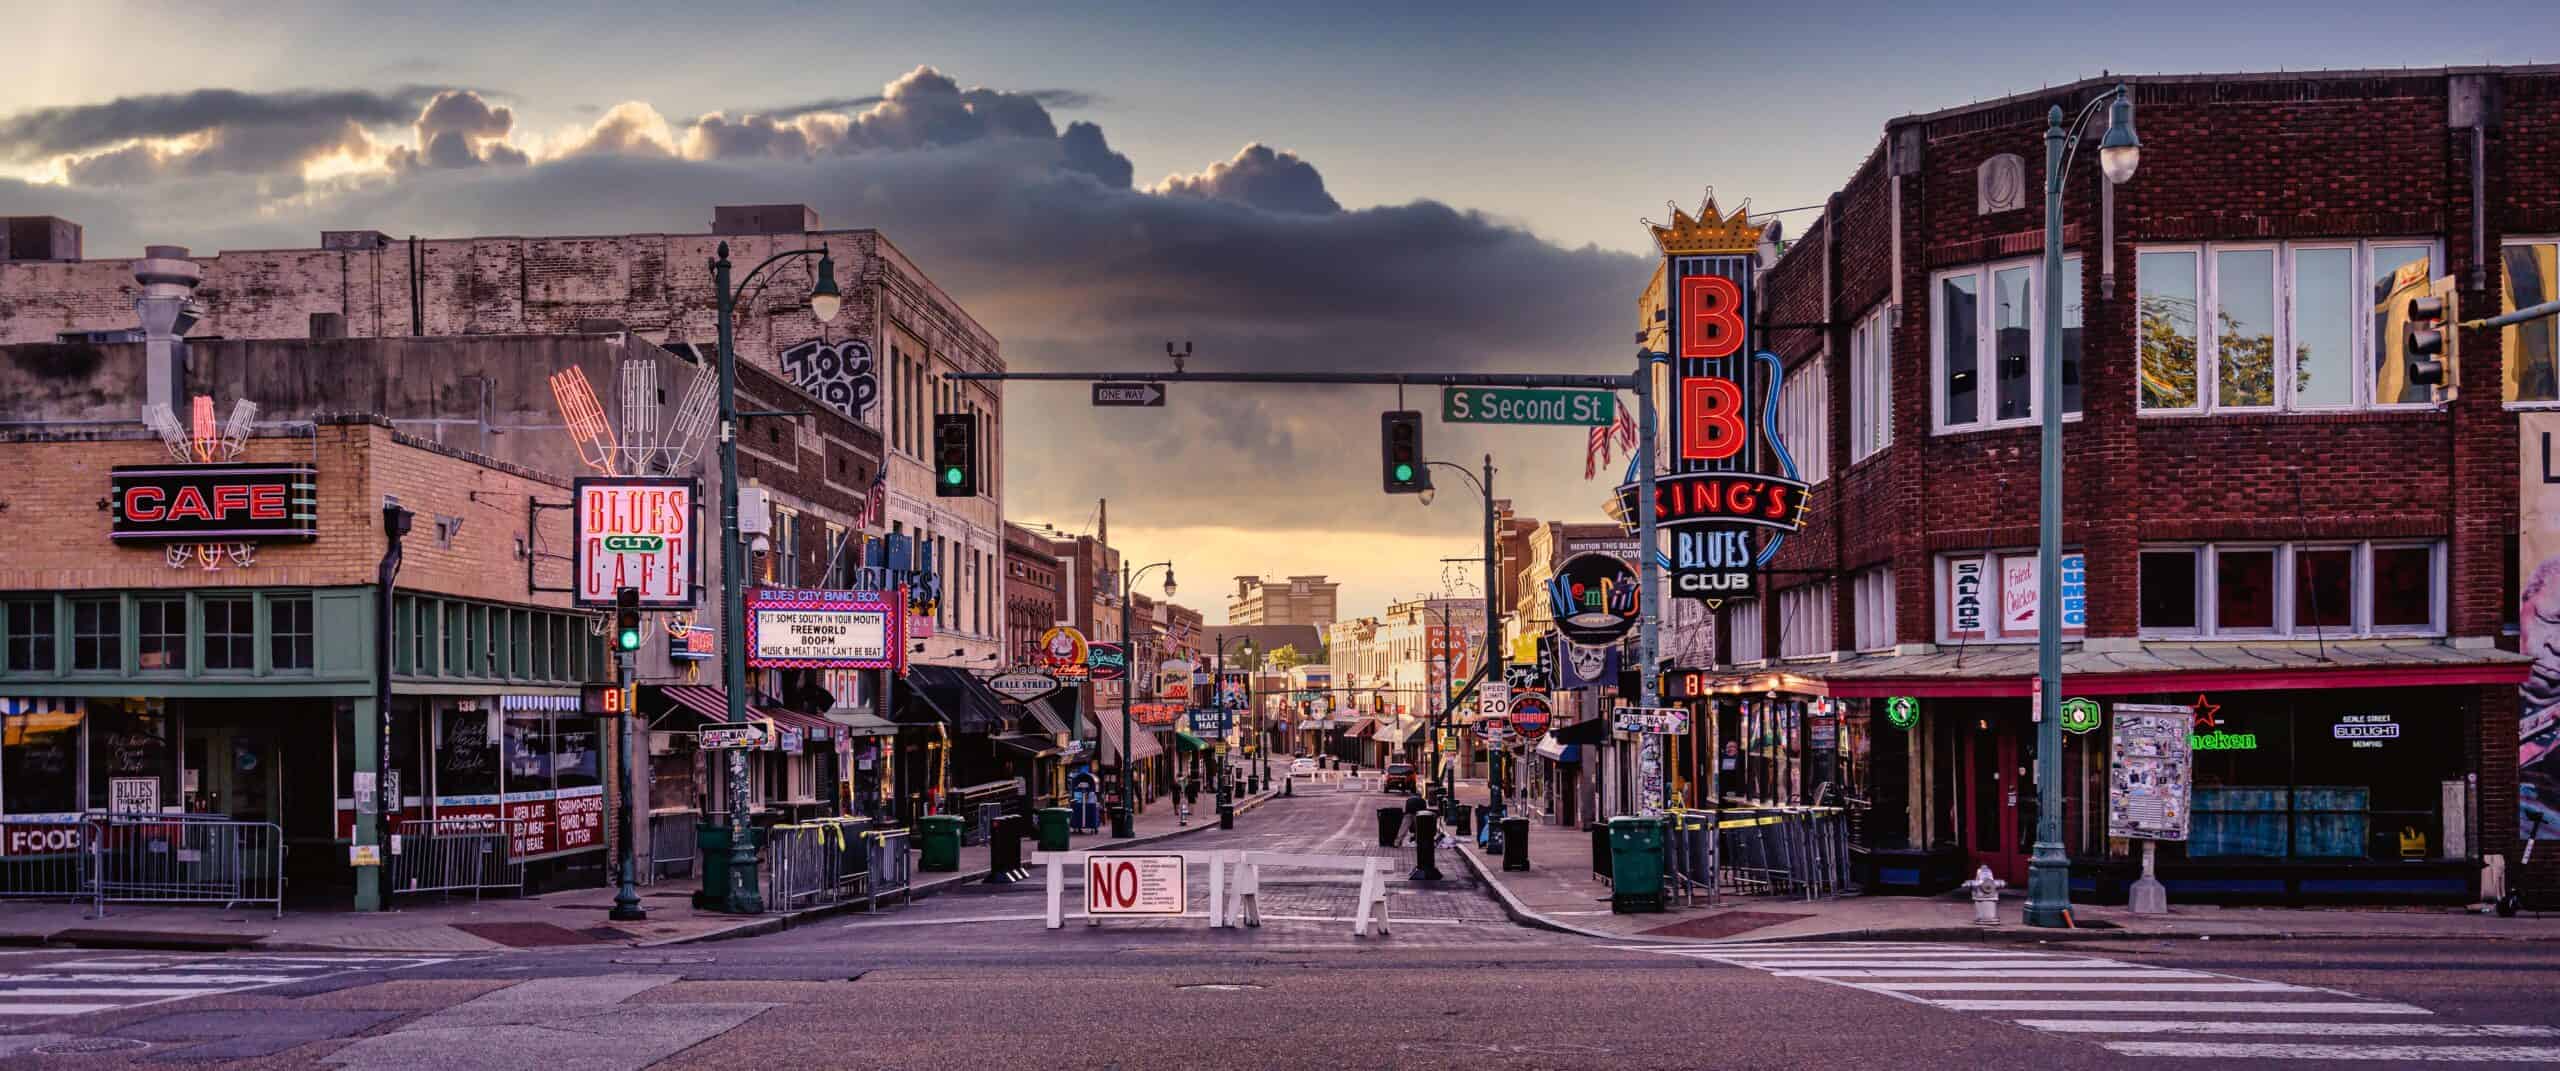
Shelby Forest-Frayser (Memphis)
The Shelby Forest-Frayser area of Memphis was listed in a 2023 HomeSnacks neighborhood profile using an estimated 3,101 offenses, or about 90 per 1,000 residents. The catch is that HomeSnacks worked down from city-level FBI data; it was not counting 3,101 independently verified crimes inside the neighborhood. Memphis has since reported a notable change at the city level. According to a July 2026 report from the Memphis Shelby Crime Commission, the major violent crime rate in Memphis dropped 31.5% during the first half of 2026 compared with the first half of 2025. That is encouraging for the broader city, although it isn't proof of an identical change in Frayser. Readers comparing neighborhoods should use the same reporting period and geographic boundaries, rather than placing an older modeled rate beside a newer citywide total.
Steel Bridge and Pacific Highway Area (Portland)
A section of Portland near the Steel Bridge appeared in Augurisk's 2021 list of high-risk Census block groups. Its model predicted 181 violent crimes annually, or 210 per 1,000 residents. That was a prediction drawn from earlier training data, not a contemporary police count. It also covered a busy mix of roads, bridges and commercial areas, where many people pass through without living there. That's important because dividing incidents by a relatively small resident population can make a rate look extreme. For current context, Portland's September 2026 Ceasefire report counted 33 shooting incidents citywide, 27% fewer than in September 2025. The Portland Police Bureau also publishes neighborhood crime reports, but we did not find a verified 2026 count matching Augurisk's original block-group boundary.
Market Street and Union Square Area (San Francisco)
In 2021, Augurisk highlighted a Census block group spanning parts of Market Street and the Union Square area. The model predicted 227 violent offenses annually, equivalent to 247 per 1,000 residents. That figure is not an FBI neighborhood rate, and the area's substantial shopping, office and visitor traffic complicates any per-resident comparison. San Francisco Police Department reporting now provides a more current citywide backdrop. From January 1 through September 6, 2026, reported violent crime was down 9% and robbery was down 18% compared with the same period in 2025. Those declines are preliminary and do not establish the exact 2026 trend around Market Street or Union Square. The older estimate is useful as historical context, but it cannot tell a visitor what will happen on a particular block.
Pines Village (New Orleans)
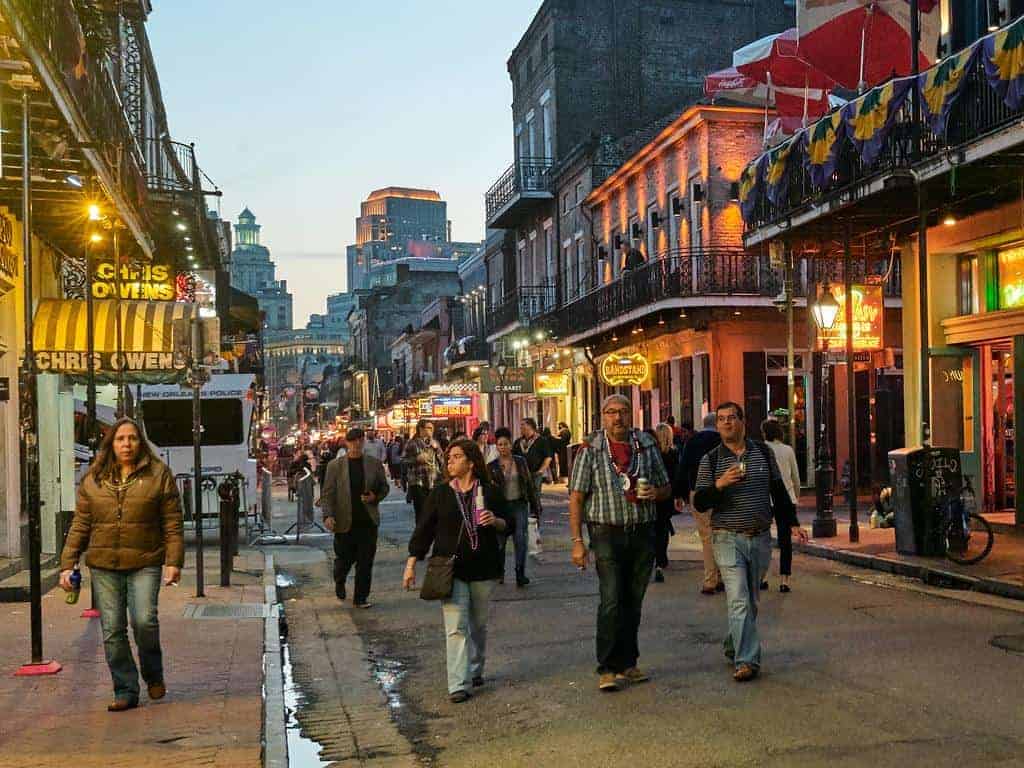
Pines Village, in eastern New Orleans, appeared in a November 2023 HomeSnacks profile that modeled about 390 total crimes, or roughly 102 per 1,000 residents. As with the original Memphis estimate, those were not direct neighborhood incidents reported to the FBI. The New Orleans Police Department's more recent numbers show substantial citywide changes. During the first half of 2026, NOPD counted 247 incidents across the four violent-crime categories it highlighted, down from 816 during the same period of 2022 and 15% below the first half of 2025. That's meaningful new context, but it does not prove Pines Village followed the exact same trajectory. It is better to distinguish a dated neighborhood model from an actual police report than to blend them into a made-up current ranking.
Ann Avenue and Downtown (Kansas City, Kansas)
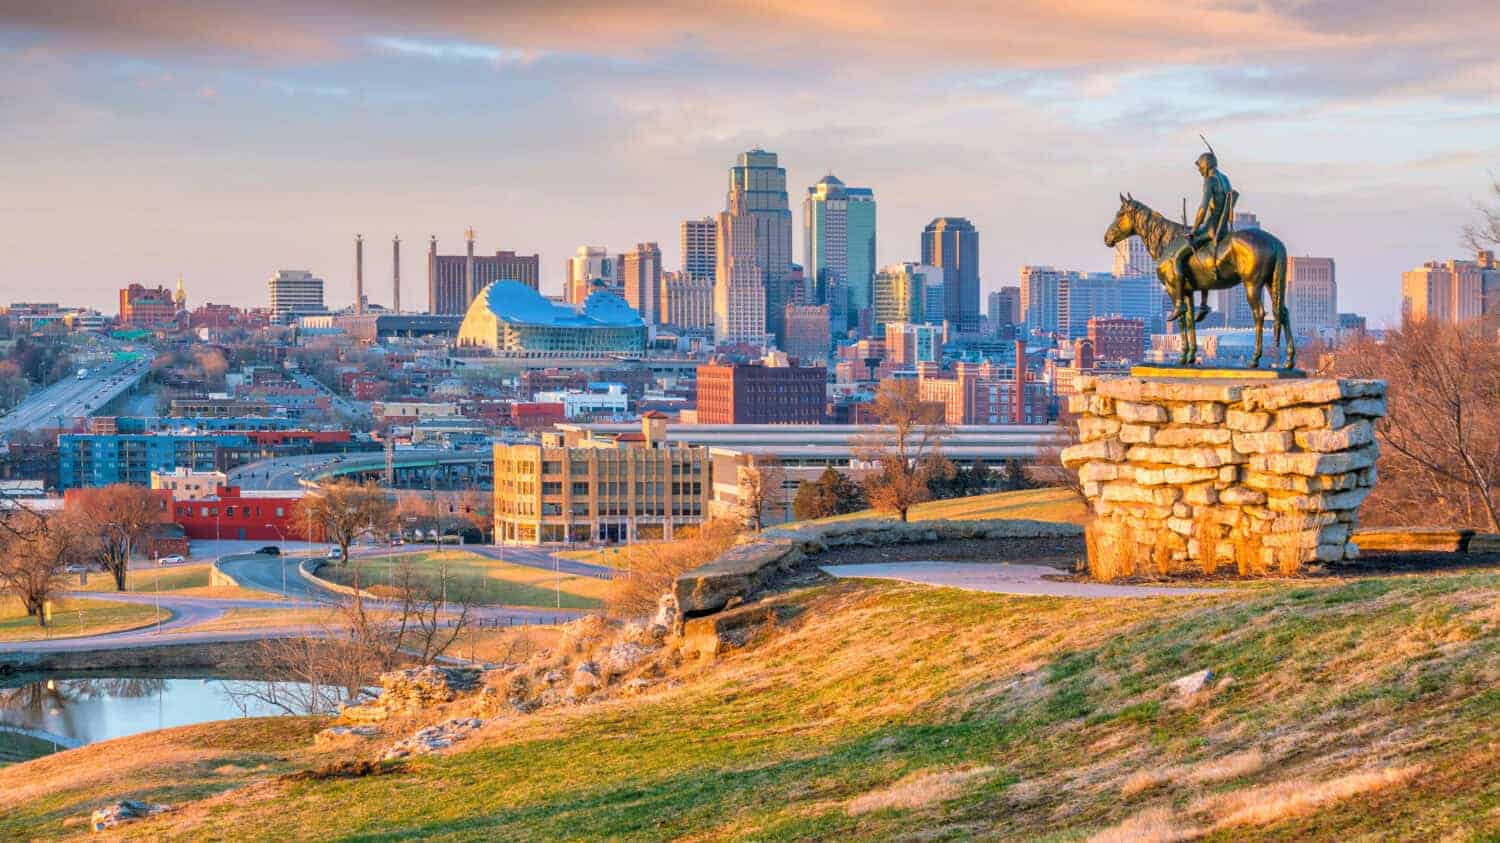
The area around Ann Avenue and downtown Kansas City, Kansas, was one of the Census block groups included in Augurisk's 2021 analysis. The model estimated 187 violent incidents a year and a rate of 204 per 1,000 residents, using older inputs and a small residential population. That should not be read as 204 confirmed crimes against every 1,000 residents in 2026. The Kansas City, Kansas, Police Department now posts regularly updated crime statistics, including reports dated September 2026, but those citywide reports are not a direct replacement for this particular block group. Its boundaries also extend beyond a single intersection. Without a new analysis using the same geography, offense definitions and time period, there is no sound basis for assigning this neighborhood a 2027 rank or predicted crime rate.
7th Street and San Julian Street (Los Angeles)
A downtown Los Angeles block group around 7th and San Julian streets was another entry in Augurisk's 2021 crime model. It projected 407 violent incidents in a year and a per-resident rate of 226 per 1,000. These were predictions, not confirmed offenses from 2026, and they should not be mistaken for the risk that any one person faces while walking through the area. Neighborhood conditions, local activity and reporting patterns can all change over time. The broader city has seen declines: LAPD's 2025 year-end report recorded 19% fewer homicides than 2024, and an October 2026 city update reported an even larger decrease since 2022. Neither statistic measures these exact blocks. For an up-to-date comparison, this neighborhood would need a new local incident analysis rather than a recycled ranking.
Turk Street and Market Street Area (San Francisco)
The downtown San Francisco area around Turk, Taylor, Powell and Market streets appeared in the Augurisk analysis with 242 predicted violent crimes a year and a modeled rate of 203 per 1,000 residents. Those estimates were published in 2021 using older data, so they're not an official 2026 neighborhood crime count. The location matters: busy retail, transit and visitor areas can attract many more people than the Census lists as permanent residents. The police department's preliminary citywide figures show robbery down 18% and total violent crime down 9% from January 1 through September 6, 2026, compared with the same period in 2025. That newer city data is worth including, but it would be misleading to assign those same percentage changes specifically to Turk Street without matching local incident records.
East 8th Street and Cleveland Avenue (Kansas City, Missouri)
Augurisk's 2021 model singled out a block group near East 8th Street and Cleveland Avenue in Kansas City, Missouri. It projected 182 violent incidents per year and a rate of 304 per 1,000 residents. Like the other Augurisk figures, these were predictions based on older information rather than observed crimes in 2026. More recent Kansas City police reporting shows a change across the whole city: at a September 22, 2026, police board meeting, officials said 96 homicides had been recorded that year, compared with 117 by the same point in 2025. Reported robberies stood at 534 versus 718 a year earlier. These numbers aren't specific to the East 8th Street block group. They show why a 2021 model cannot automatically serve as a current neighborhood ranking.
Santa Monica Freeway and Maple Avenue (Los Angeles)
A block group near the Santa Monica Freeway and Maple Avenue ranked second in Augurisk's 2021 study, with 407 predicted violent offenses per year and a rate of 293 per 1,000 residents. It's a striking number, but it comes from a model trained on earlier data, not a count of current crimes. Since that study, Los Angeles has reported important improvements in some categories. An August 2026 city update said reported burglaries were down 27% citywide compared with the preceding year, while an October report said homicides had fallen substantially since 2022. Those findings do not establish the same trend at Maple Avenue, nor do they mean every kind of crime is improving equally. The block group needs fresh local data before anyone can responsibly assign it a new ranking for 2026 or 2027.
Division Street and Townsend Street (San Francisco)
Augurisk modeled a Census block group near Division and Townsend streets at 296 violent offenses a year, with a predicted rate of 298 per 1,000 residents. Although that prediction featured in a 2021 national list, the figure was not drawn from a 2026 police tally. The area sits near major roads and a mix of commercial activity, so its residential population is an imperfect denominator for the number of people coming through. In a newer citywide comparison, San Francisco police recorded 2,073 burglaries between January 1 and September 6, 2026, versus 2,682 over the same period in 2025, a decline of about 23%. Those are preliminary totals for San Francisco as a whole. They do not prove the specific block group saw a matching drop, and there is no verified neighborhood-level 2027 forecast.
7th Street and Alameda Street (Los Angeles)
This block group near 7th and Alameda streets had the largest predicted number of violent offenses among the 10 areas highlighted by Augurisk in 2021: 456 a year, with a modeled rate of 291 per 1,000 residents. The ranking used a predictive algorithm, not a ledger of police-reported incidents from that year, and certainly not a 2026 or 2027 count. Downtown Los Angeles has changed since the model's underlying data was collected. The city reported in October 2026 that homicides across Los Angeles were down 47% compared with the same point in 2022, and LAPD reported a 19% decline from 2024 to 2025. The old estimate should be presented for what it is: a snapshot of what one model once flagged, not proof that this is one of America's most dangerous neighborhoods today.