Gorodenkoff / Shutterstock.com

travelview / Shutterstock.com

Jonathan Ross / iStock via Getty Images

f11photo / iStock via Getty Images

pedro layant / BY-SA 2.0
f11photo / iStock via Getty Images
LoweStock / iStock via Getty Images
4kclips / Shutterstock.com

SolomonCrowe / iStock via Getty Images
SeanPavonePhoto / iStock via Getty Images

milehightraveler / iStock via Getty Images

f11photo / iStock via Getty Images

alyssaBLACK. / BY-SA 2.0

Silvio Ligutti/Shutterstock.com
BruceBlock / iStock via Getty Images
DenisTangneyJr / iStock via Getty Images






A Look at Police Response Times in 15 Major U.S. Cities
When someone calls 911, the clock matters. But police response time is not one national statistic. One city may start the clock when a call is answered, another when it enters a dispatch queue, and another when an officer is assigned. Cities also use different names and rules for their call-priority levels.
Crime is not moving in one direction, either. The Council on Criminal Justice's midyear 2026 analysis of 36 cities found that nine of 13 tracked offenses were lower than during the first half of 2025, including an 18% decline in homicide. That sample is not a national crime count, but it is a useful reminder that broad claims about crime rising everywhere do not match the latest city data.
This slideshow uses the latest clearly documented public figures available as of November 2026 from city dashboards, police reports, budgets, and oversight records. It is a city-by-city snapshot, not a ranking: the figures are not perfectly comparable, and emergency calls are usually handled much faster than routine calls. Where a city reports how quickly 911 is answered rather than how quickly an officer arrives, that distinction is made clear.
Dallas, Texas
Dallas shows how much call priority can change the wait. In a February 2026 city report, year-to-date average response time was 8.55 minutes for Priority 1 calls but 67.83 minutes for Priority 2 calls. The averages for Priority 3 and Priority 4 calls were both close to or above two hours.
Austin, Texas
Austin measures the median time from call initiation to an officer's arrival for emergency and urgent violent-crime incidents. Its performance dashboard lists a fiscal 2025 result of 7 minutes, 3 seconds. During fiscal 2026, the quarterly figure improved from 7:29 in the first quarter to 6:36 in the third, beating the city's 7:12 target.
New Orleans, Louisiana
New Orleans' 2024 data also shows why one citywide average can hide meaningful differences. An NOPD annual report put the weighted median for Code 2 emergency calls at 10 minutes in neighborhoods where more than 60% of residents are Black and 9 minutes in neighborhoods where fewer than 40% are Black. For Code 1 non-emergency calls, the medians were 40 and 22 minutes, respectively.
New York City, New York
New York publishes unusually detailed end-to-end figures, including the time spent answering, processing, dispatching, and traveling to a call. In fiscal 2025, the Mayor's Management Report listed an average of 9 minutes, 10 seconds for critical crimes in progress, 13 minutes for serious crimes in progress, and 28 minutes, 28 seconds for non-critical crimes in progress. The city also maintains a weekly response-time dashboard.
Nashville, Tennessee
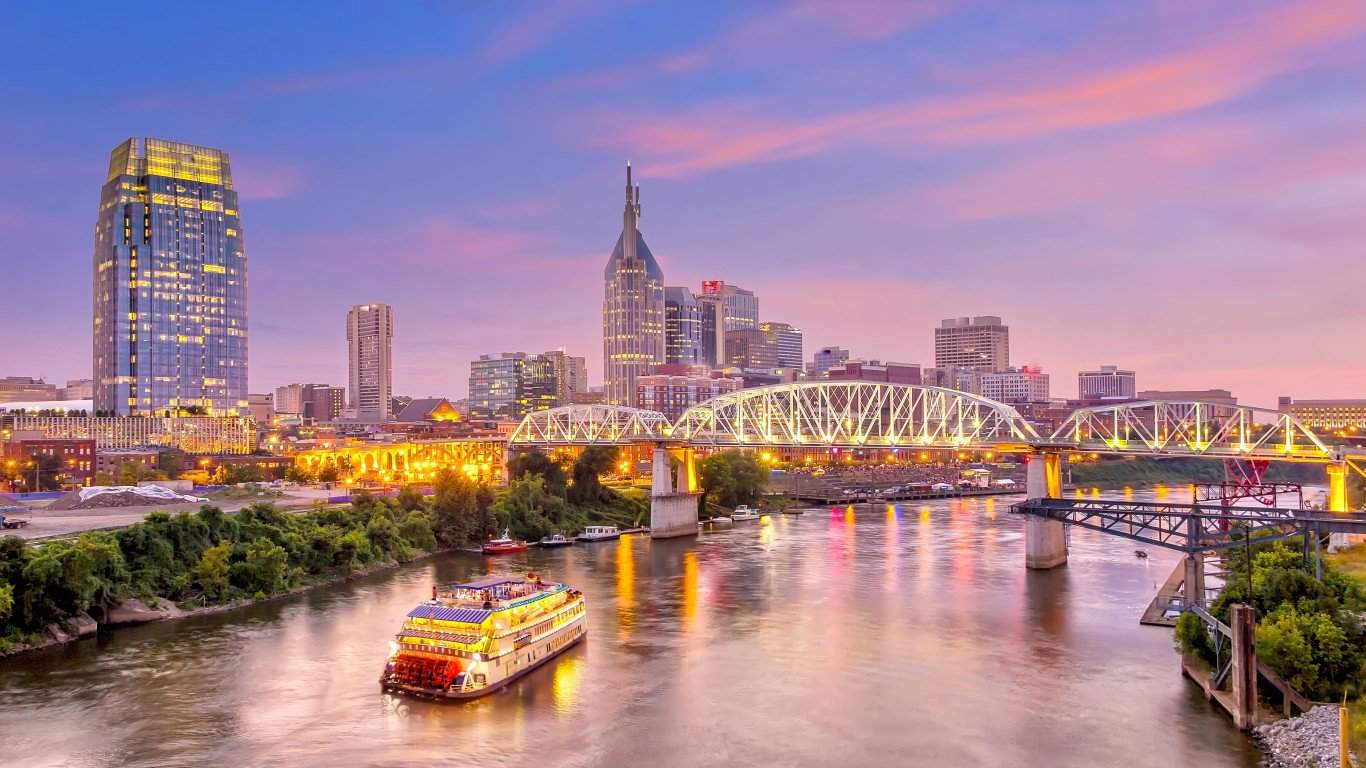
Nashville classifies Code 3 calls as emergencies requiring lights and sirens. A 2026 benchmarking report put MNPD's 2024 average for its highest-priority calls at 12.8 minutes. Nashville now maintains a Code 3 performance dashboard for current monitoring.
Seattle, Washington
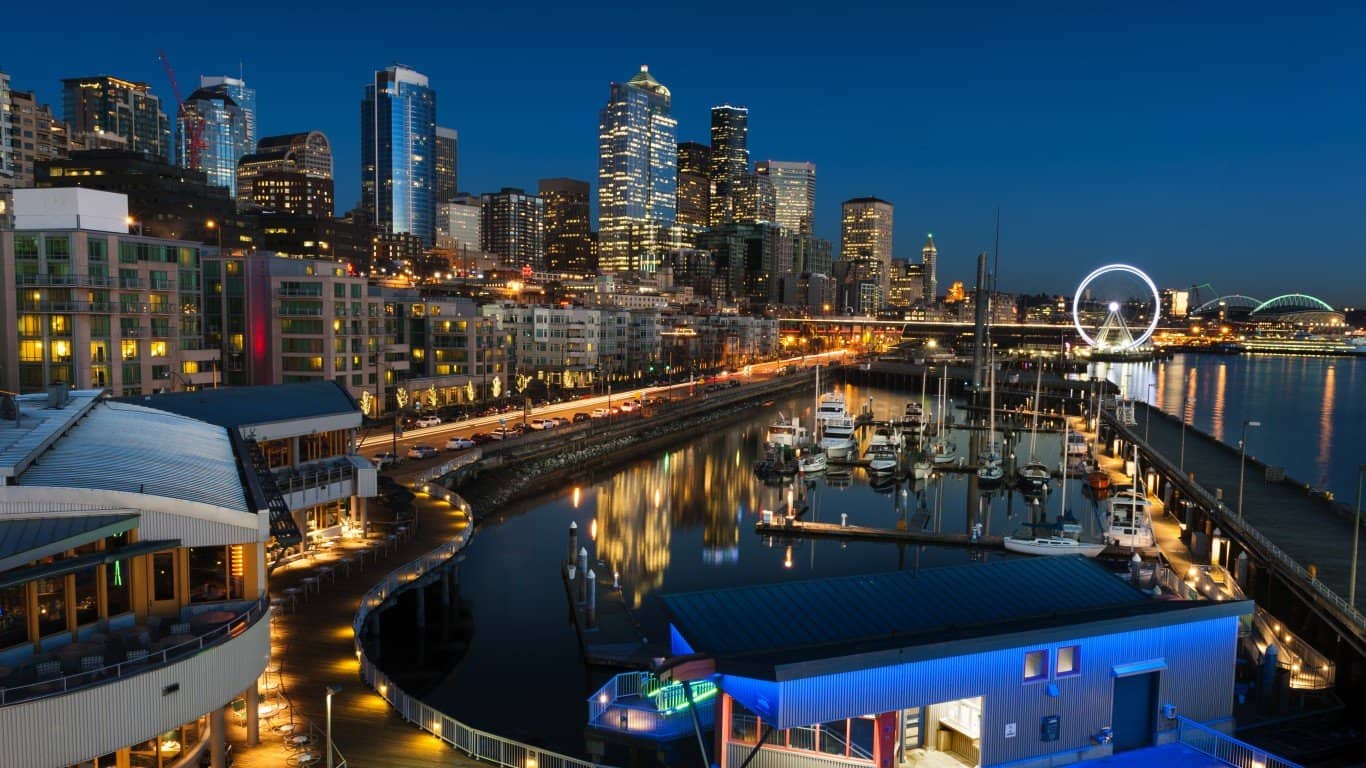
Seattle reported improvement at the start of 2025, although the department said it was still struggling to meet its goals. In the first quarter of 2025, half of Priority 1 calls received a response within seven minutes, up from 44% in the first quarter of 2024. Average and median times improved across all three priority groups, but lower-priority calls could still wait substantially longer.
Los Angeles, California
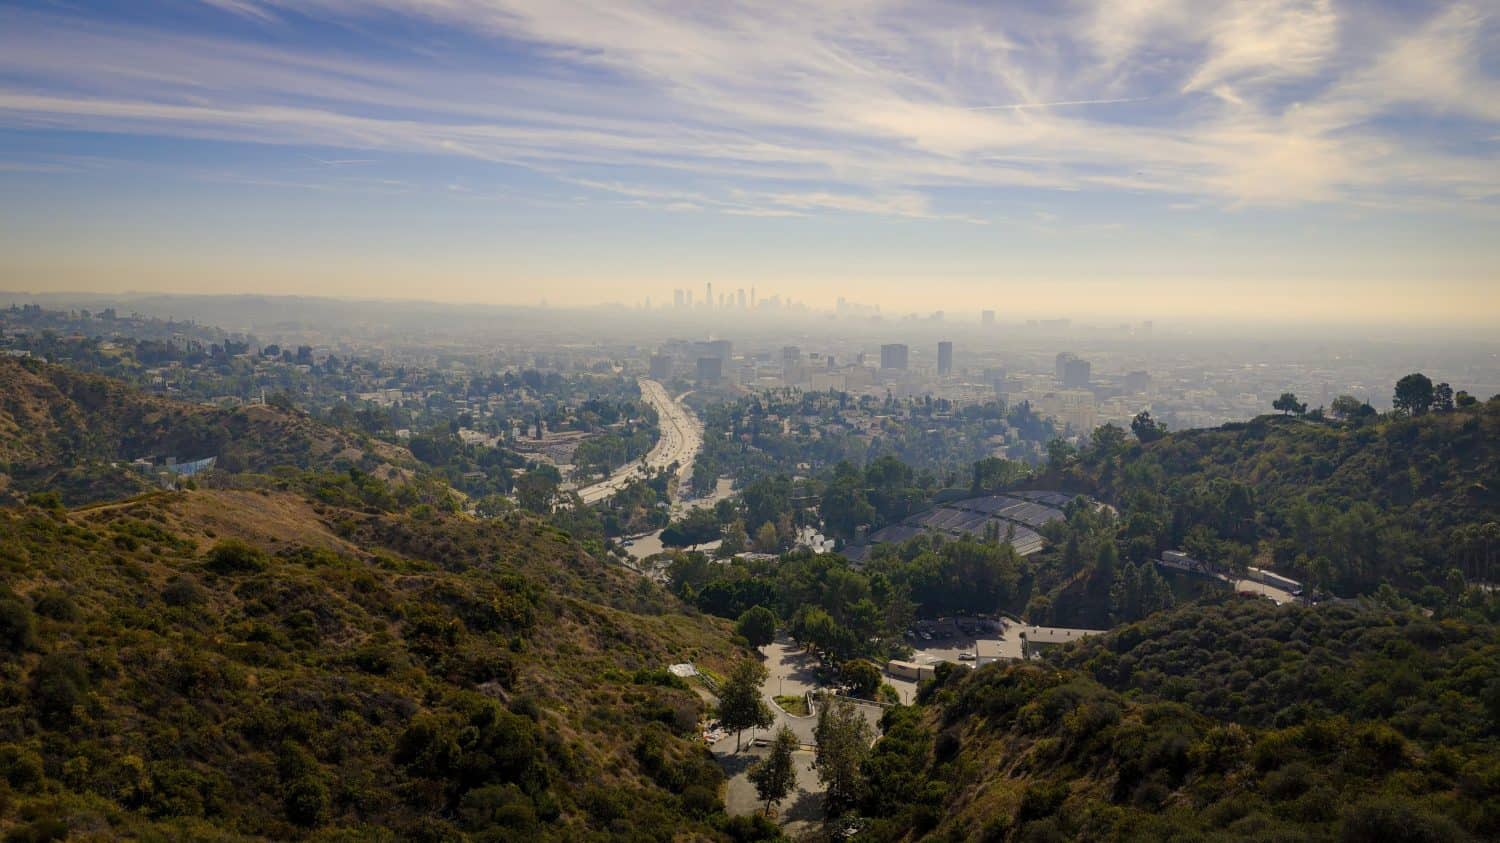
Los Angeles' current patrol plan keeps a goal of responding to emergency calls within seven minutes, according to an LAPD report. The phone can add another delay before an officer is dispatched: a 2025 City Council motion said 57.43% of emergency 911 calls in 2024 were answered within 15 seconds, while non-emergency calls took an average of 3 minutes, 40 seconds to be answered. Those are call-answer figures, not officer-arrival times.
Detroit, Michigan
At a January 2026 police commission meeting, Detroit's police chief said the previous week's average for Priority 1 calls was 10 minutes, 36 seconds, measured from the citizen's 911 call to the officer's arrival. He also cautioned that the figure varies from day to day.
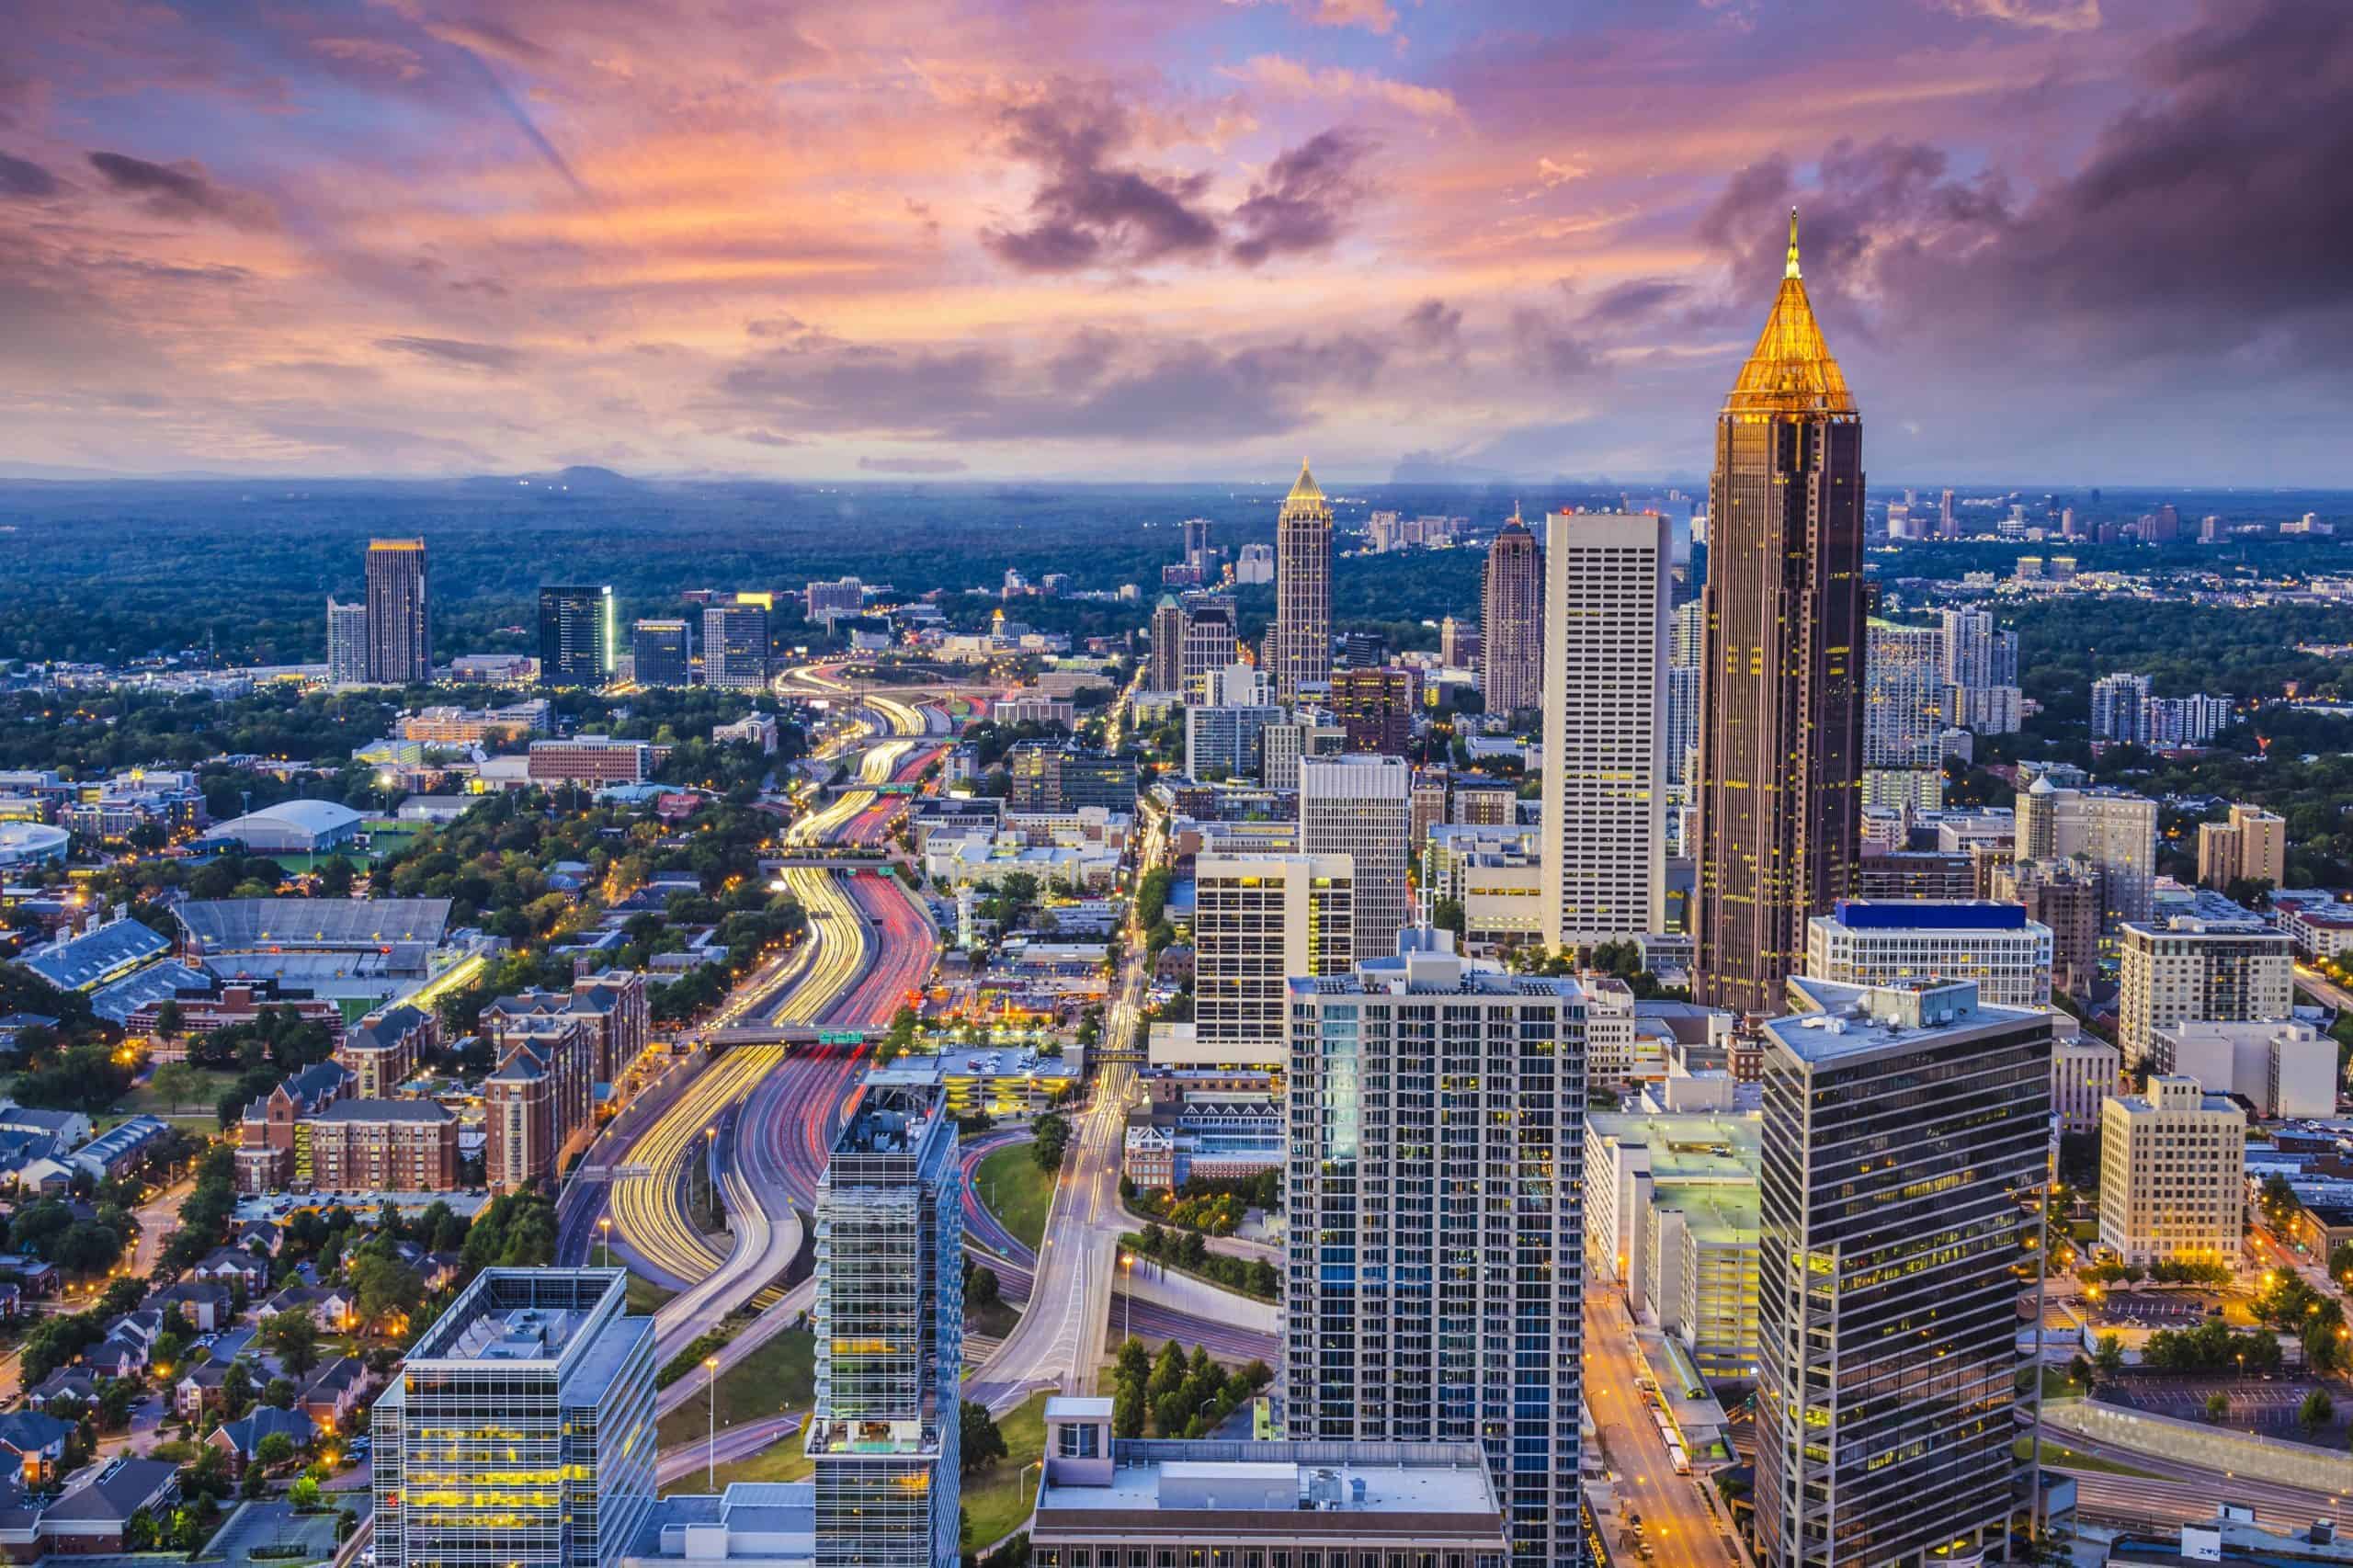
Atlanta, Georgia
Atlanta has made clear progress in answering 911 calls, but that is not the same as getting an officer to the scene. The city's proposed fiscal 2027 budget says the average 911 answer time fell from 29.88 seconds in 2022 to 9.47 seconds year to date in 2025. Because the public figure measures call pickup rather than officer arrival, it should not be presented as a police response time.
Denver, Colorado
Denver's newer figures show modest improvement, but the waits remain substantial. As of Aug. 31, 2025, emergency calls in priorities 0 through 2 averaged 15 minutes, 21 seconds, which was 25 seconds faster than a year earlier. Non-emergency calls in priorities 3 through 6 averaged 32 minutes, 37 seconds, an improvement of 1 minute, 27 seconds, according to the city's 2026 budget-hearing responses.
Las Vegas, Nevada
Las Vegas has improved its average emergency response. The Las Vegas Metropolitan Police Department's 2024 annual report listed an average of 7.7 minutes for emergency calls, down from 7.9 minutes in 2023. That officer-response figure is separate from 911 hold time; call-answer speed and officer-arrival speed are not interchangeable.
Miami, Florida
During fiscal 2024-25, the Miami Police Department reduced its response time for emergency calls from 4 minutes, 16 seconds to 4 minutes, according to the city's fiscal 2026 proposed budget. This figure applies to the City of Miami, not the much larger Miami-Dade County.
Houston, Texas
Houston's most urgent calls are handled quickly, but the numbers climb sharply as priority drops. Through November 2025, the Houston Police Department reported average response times of 6 minutes for Priority 1 calls and 11.4 minutes for Priority 2 calls. The averages were 65 minutes for Priority 3, 81.8 minutes for Priority 4, and 93 minutes for Priority 5. Every category improved from 2024.
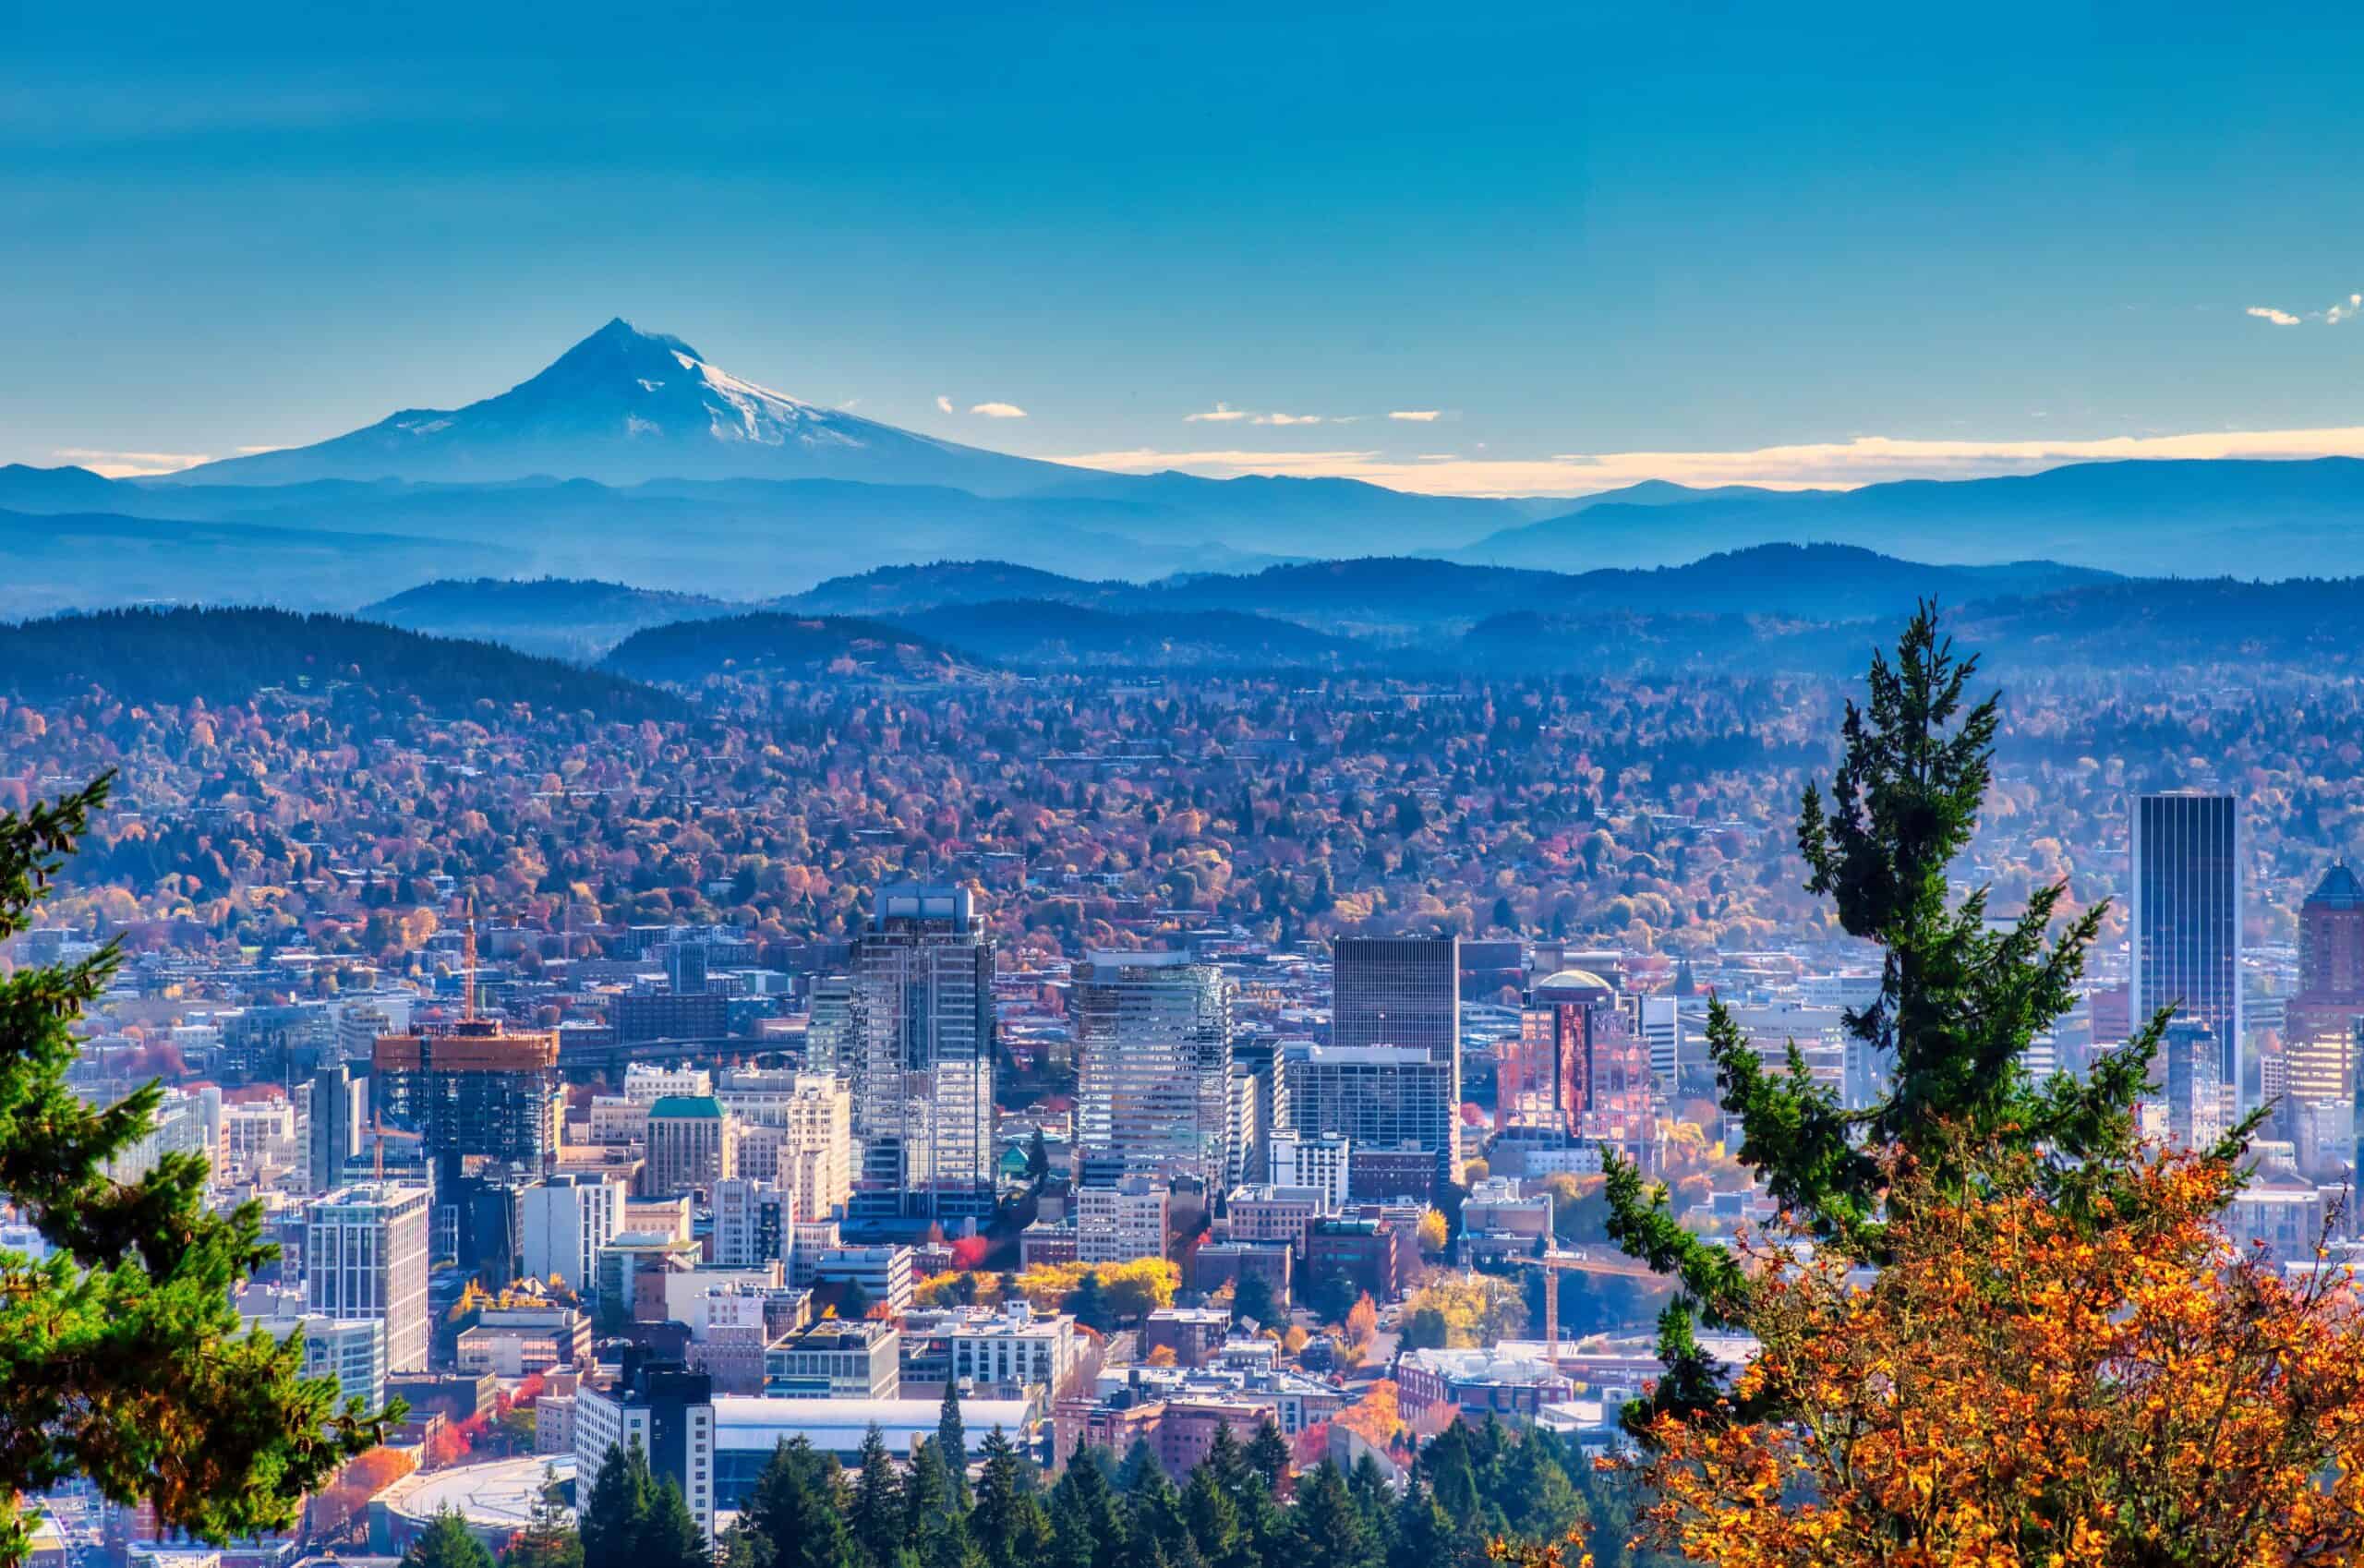
Portland, Oregon
Portland still reports some of the longest waits in this slideshow, especially outside the highest-priority category. Its 2025 annual report listed an average total response time of 19.5 minutes for high-priority calls, 46.7 minutes for medium-priority calls, and 94.7 minutes for low-priority calls. Portland starts that clock when a call is placed in the police dispatch queue, not when the caller first dials 911.
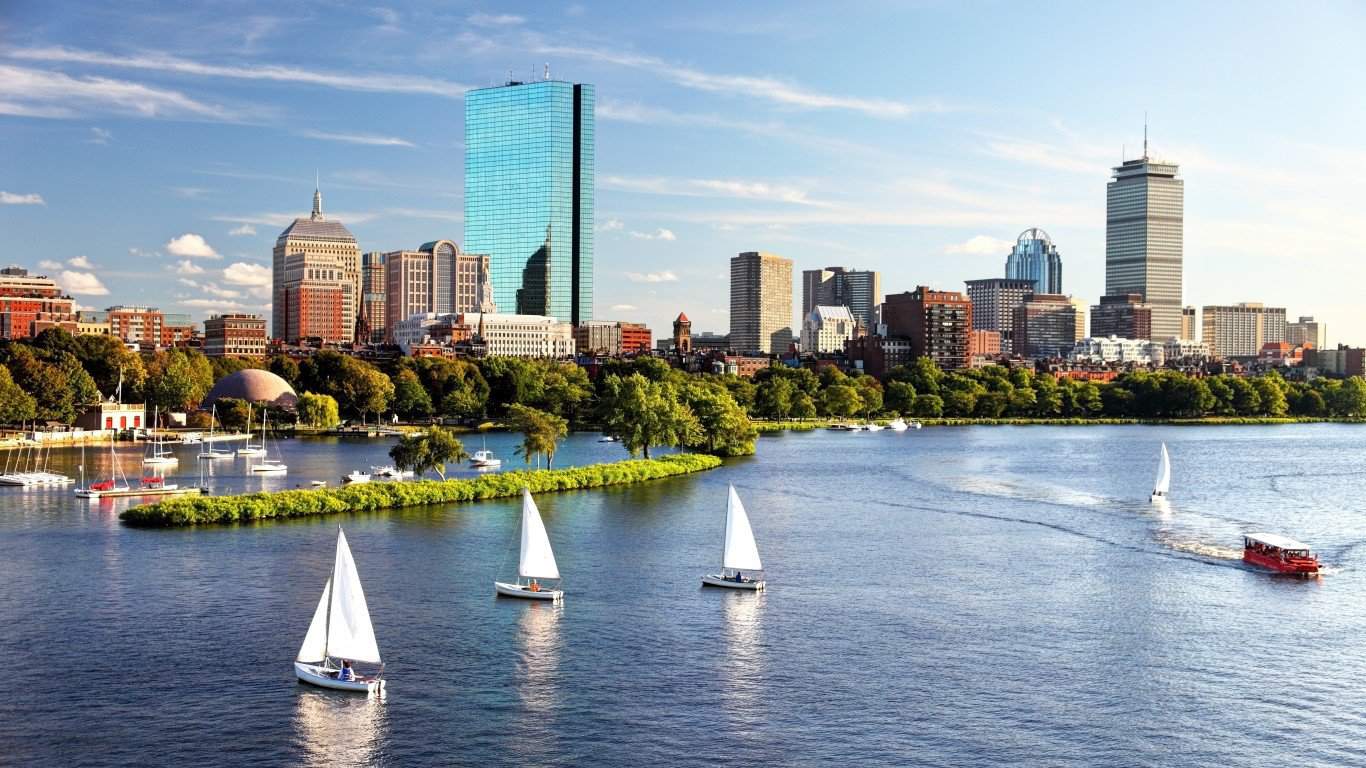
Boston, Massachusetts
Boston's public budget reporting is less current than the figures available for most cities here. The city's fiscal 2024 budget projected a median receipt-to-arrival time of 8 minutes for Priority 1 police calls and set the same 8-minute target. Because newer city budget materials do not publish a directly comparable result, that should be treated as the latest clearly documented public benchmark, not a live average.