MattGush / iStock via Getty Images
mobili / Flickr
New Orleans, Louisiana by szeke / BY-SA 2.0 (https://creativecommons.org/licenses/by-sa/2.0/)
Gateway Arch - St. Louis - Missouri by Arch_Sam / BY 2.0 (https://creativecommons.org/licenses/by/2.0/)
Sean Pavone / iStock via Getty Images
f11photo / Shutterstock.com

Sean Pavone / iStock via Getty Images

bluejayphoto / iStock via Getty Images
Sundry Photography / iStock via Getty Images
Joseph Sohm / Shutterstock.com

Sean Pavone / iStock via Getty Images

Sundry Photography / Shutterstock.com
DutcherAerials / E+ via Getty Images

LeoPatrizi / E+ via Getty Images

shalunts / iStock via Getty Images









14 U.S. Neighborhoods Facing the Highest Crime-Risk Estimates
Crime can vary dramatically from one part of a city to another, but there is no official FBI ranking of America’s “most dangerous neighborhoods.” The FBI’s Uniform Crime Reporting program publishes data reported by participating law-enforcement agencies, while neighborhood-level figures are often built from local incident data or third-party estimates and models.
That distinction is important here. The first four entries use third-party neighborhood estimates derived from citywide FBI data. The remaining 10 are Census block groups from a 2021 Augurisk analysis published by Forbes. Augurisk said its model was trained on crime data from 11 U.S. cities between 2014 and 2018 and used 188 predictors to estimate violent crime counts and rates. Its demographic context came from the 2014-2018 American Community Survey.
Because the sources, years, and methods differ, these areas should not be read as a single current federal ranking. The numbers are better viewed as indicators of places that stood out for elevated crime estimates or predicted risk in the source data. Rates can also look unusually high in small residential block groups that attract large numbers of workers, shoppers, tourists, or other visitors.
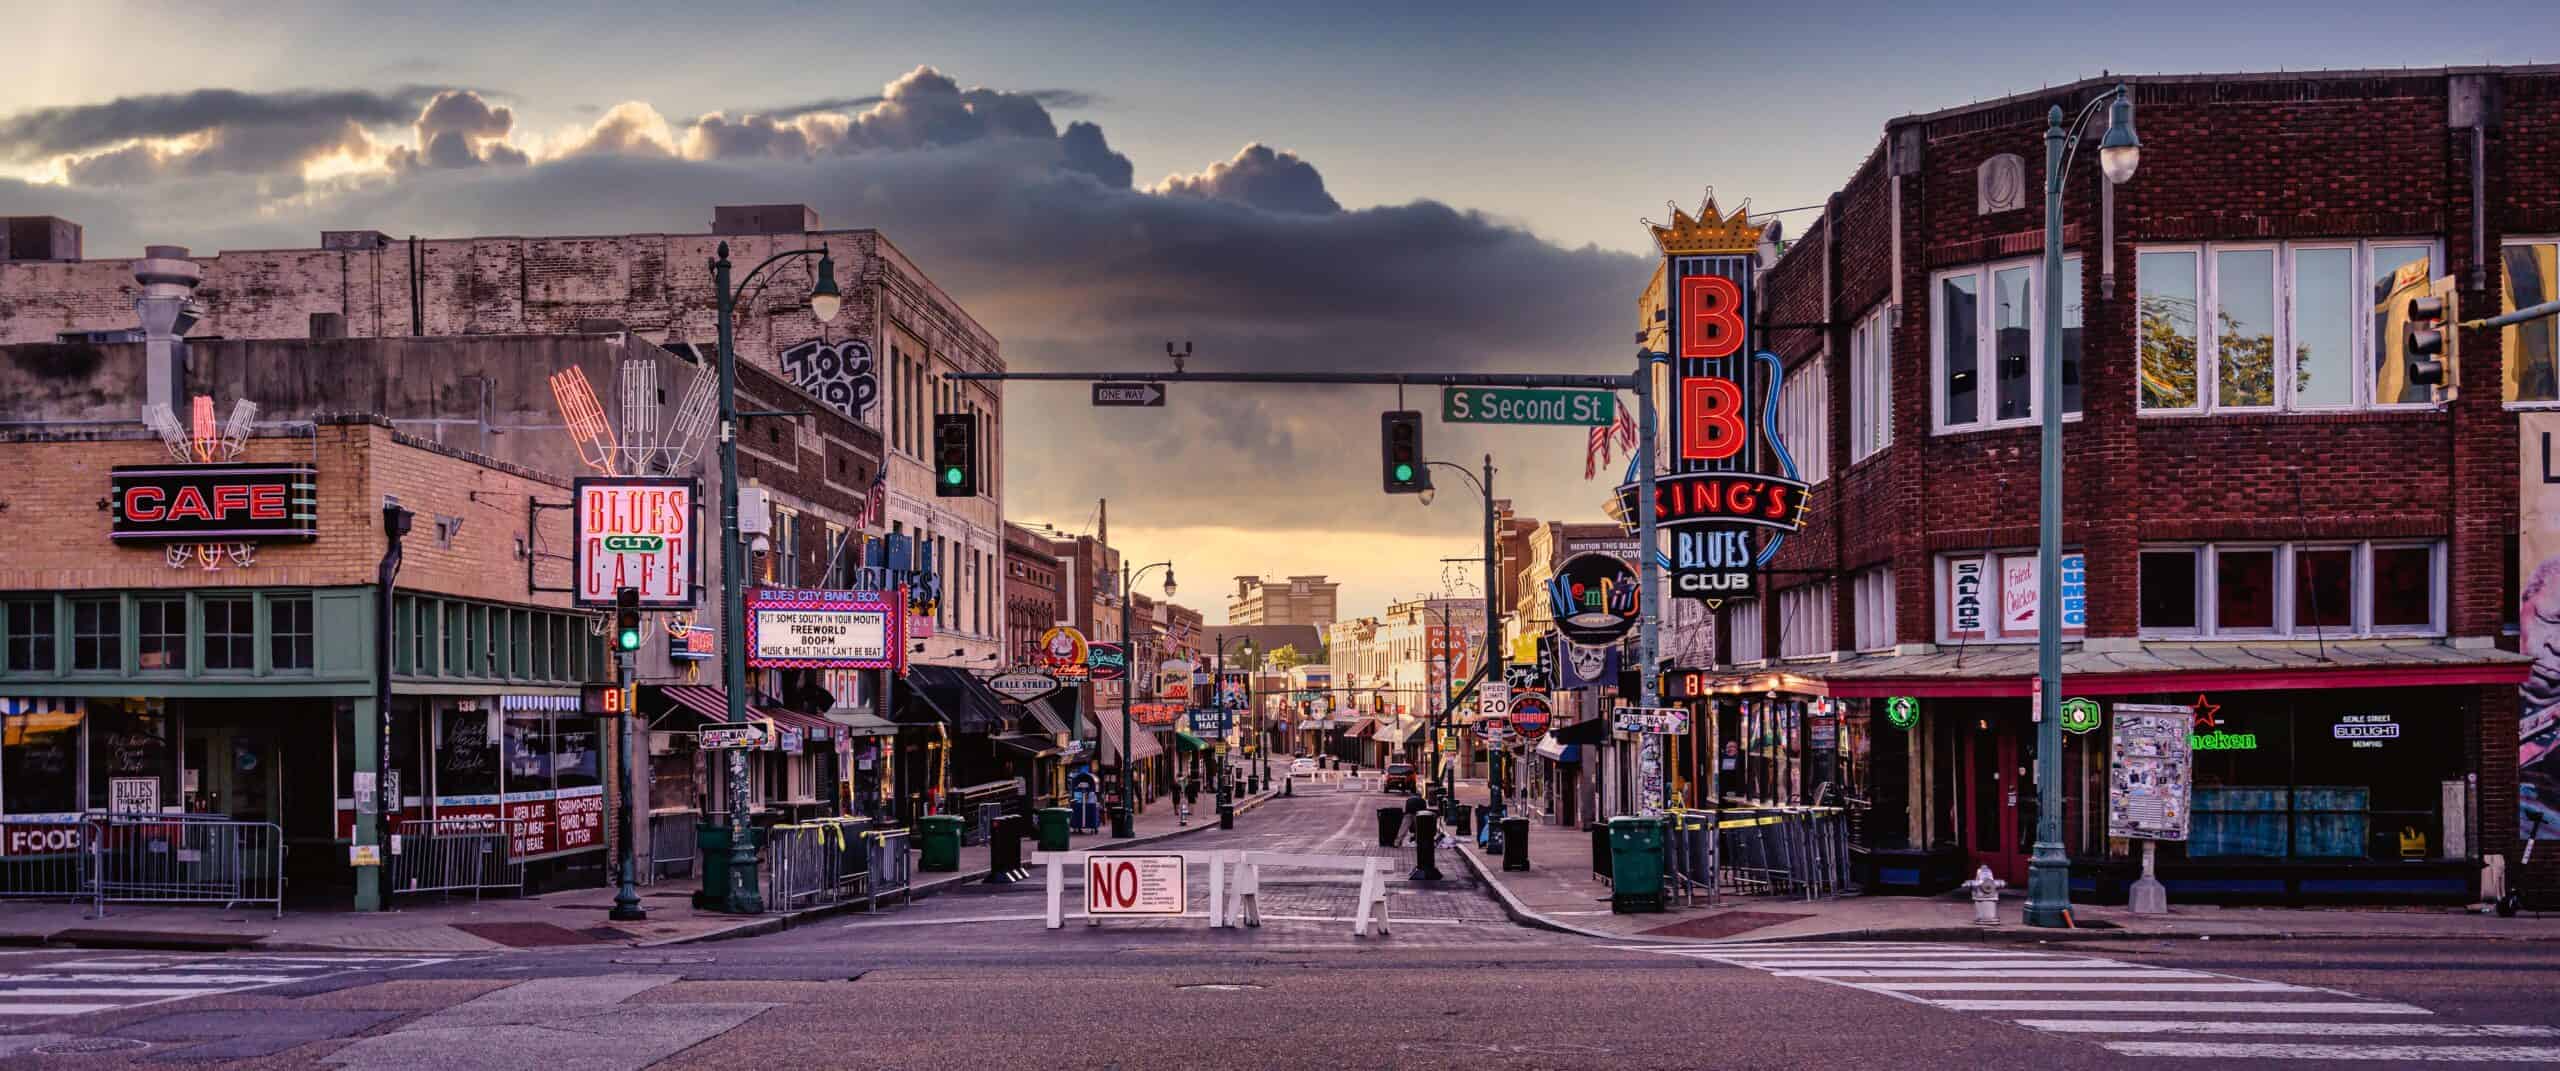
Shelby Forest-Frayser (Memphis)
A 2023 HomeSnacks neighborhood model estimated 3,101 total crimes in Shelby Forest-Frayser, equal to about 90.3 per 1,000 residents. It estimated 2,066 property crimes and 1,035 violent crimes. The important limitation is that these are not FBI-reported neighborhood counts. The source says it used Memphis-level FBI data and estimated rates down to Shelby Forest-Frayser. The same profile placed the neighborhood’s population at 34,345 at the time.
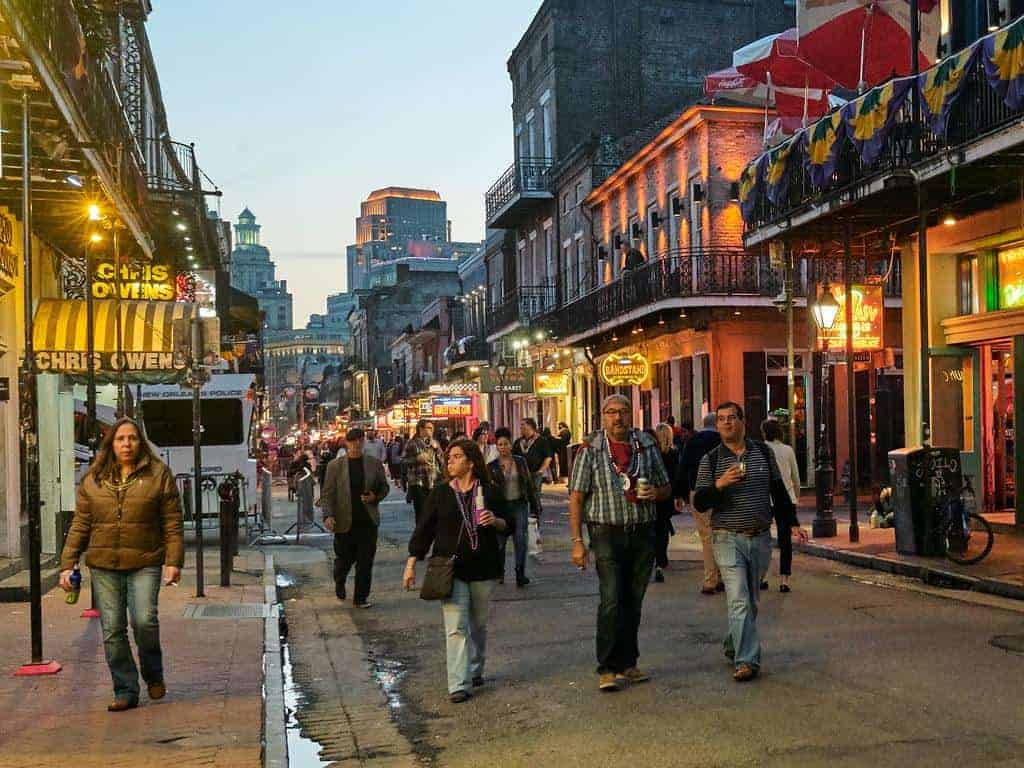
Pines Village (New Orleans)
A HomeSnacks model estimated 390 total crimes in the reporting period used for its November 2023 Pines Village profile, or about 101.6 per 1,000 residents. Of those modeled incidents, 294 were property crimes and 96 were violent crimes. The profile listed 3,835 residents, but the crime figures are estimates derived from New Orleans-level FBI data rather than direct FBI neighborhood reporting, so they should not be treated as an official count for Pines Village.
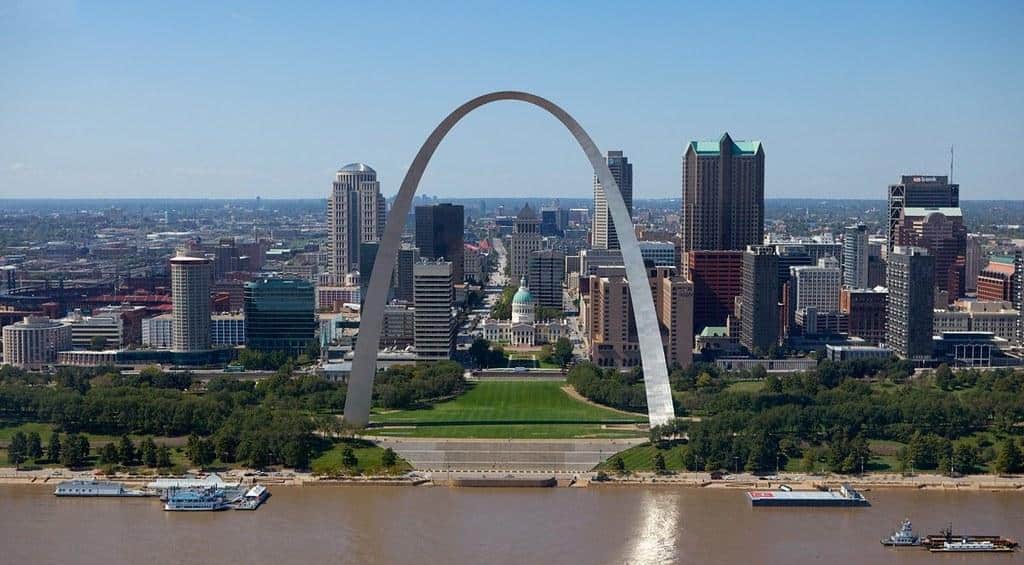
Peabody-Darst-Webbe (St. Louis)
AreaVibes currently estimates 10,566 total crimes per 100,000 residents in Peabody-Darst-Webbe, or about 105.7 per 1,000. It estimates property crime at 7,372 per 100,000 and violent crime at 3,194. AreaVibes explicitly notes that the FBI does not publish a Peabody-Darst-Webbe neighborhood crime rate, so these figures are modeled estimates based partly on St. Louis data rather than direct neighborhood UCR counts. The neighborhood is also in the middle of a major housing redevelopment. Clinton-Peabody, built in 1942 and described by the St. Louis Housing Authority as the oldest public housing development in its portfolio, began Phase One demolition in 2025 and broke ground on new construction in July 2026. Phase One calls for 89 new units, while the broader plan is expected to create about 350 mixed-income apartments and affordable for-sale homes. A City of St. Louis environmental notice estimated the overall development cost at approximately $127 million.
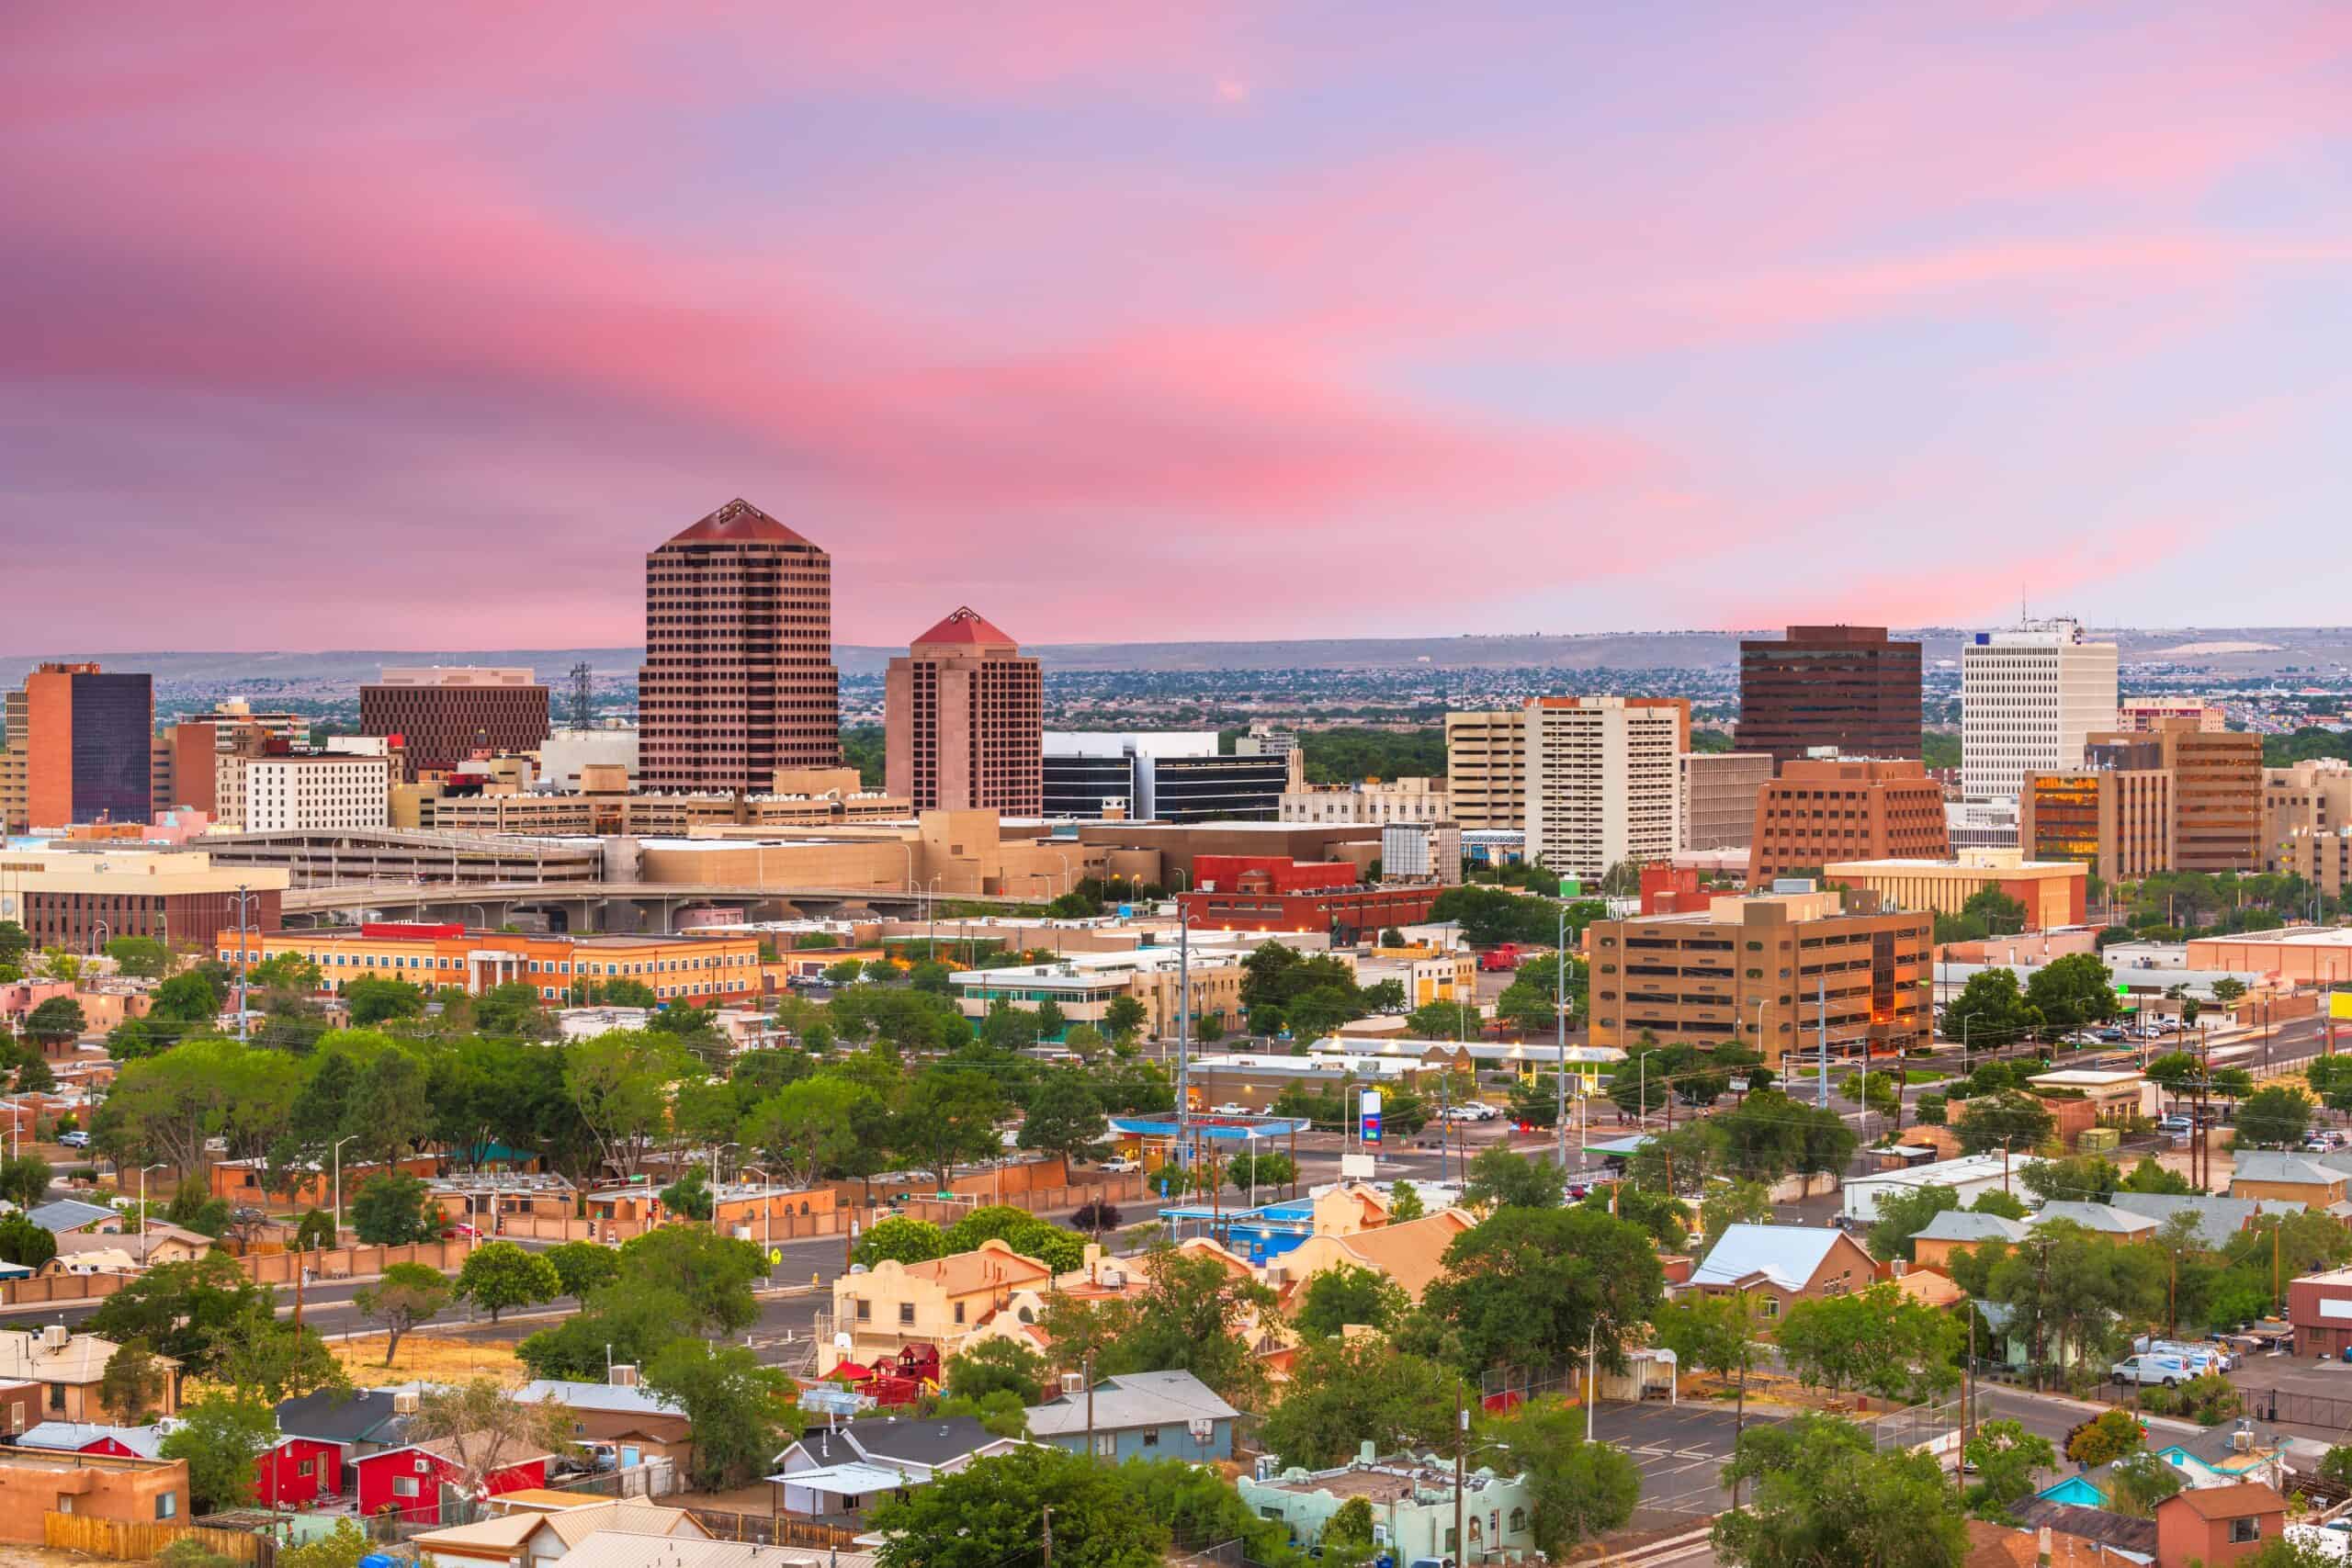
Quigley Park (Albuquerque)
AreaVibes’ Quigley Park data estimates 6,456 total crimes per 100,000 residents, or about 64.6 per 1,000. It estimates 5,044 property crimes and 1,412 violent crimes per 100,000. As with the other neighborhood estimates, AreaVibes says the FBI does not publish a Quigley Park neighborhood rate. The City of Albuquerque lists Quigley Park itself at 2801 San Pedro NE and Candelaria.
Ann Avenue and North 3rd Street Area (Kansas City, Kansas)
In Augurisk’s 2021 analysis, this Kansas City, Kansas block group ranked 10th among the 10 areas it highlighted. The model predicted 187 violent crimes per year and a violent crime rate of 204 per 1,000 residents. The accompanying 2014-2018 American Community Survey context showed a median household income of $11,000, with 48% of households reporting less than $10,000. About 66% of residents were out of the labor force, which is different from saying 66% were unemployed. Median age was 50.9 for men and 49.5 for women.
Steel Bridge and Pacific Highway Area (Portland)
Augurisk’s model placed this Portland block group ninth, with 181 predicted violent crimes per year and a predicted violent crime rate of 210 per 1,000 residents. In the 2014-2018 ACS data used for context, 28% of households reported incomes below $10,000, while 65% of residents had moved within the previous four years. Its unemployment rate was higher than that of 96% of U.S. block groups. Augurisk cautioned that per-resident crime rates can become distorted in busy areas with relatively few permanent residents.
Turk Street and Market Street Area (San Francisco)
Augurisk ranked this San Francisco block group eighth in its 2021 analysis, predicting 242 violent crimes per year and a violent crime rate of 203 per 1,000 residents. The 2014-2018 ACS figures used in the analysis showed a median household income of $20,583. About 60% of residents age 16 and older were out of the labor force, 66% of the surveyed population was male, and the median age was 55.1 years.
Market Street and 1st Street Area (San Francisco)
This block group includes San Francisco’s Union Square, according to the Augurisk analysis. The model predicted 227 violent crimes per year and a rate of 247 per 1,000 residents. The 2014-2018 ACS data used for context put the median household income at $66,667. Augurisk also said the area was among the 10 U.S. block groups with the most property crimes predicted by its model. Because Union Square is a major shopping and visitor district, a per-resident rate deserves extra caution when judging the risk faced by any individual person there.
7th Street and San Julian Street Area (Los Angeles)
The Augurisk model predicted 407 violent crimes per year in this downtown Los Angeles block group, equal to 226 per 1,000 residents. Its 2014-2018 ACS context showed a median household income of $10,397 and a population that was 86% male. About 68% of residents were out of the labor force, while the median age was 56.4 years. The source also placed the area’s unemployment rate among the highest 8% of U.S. block groups.
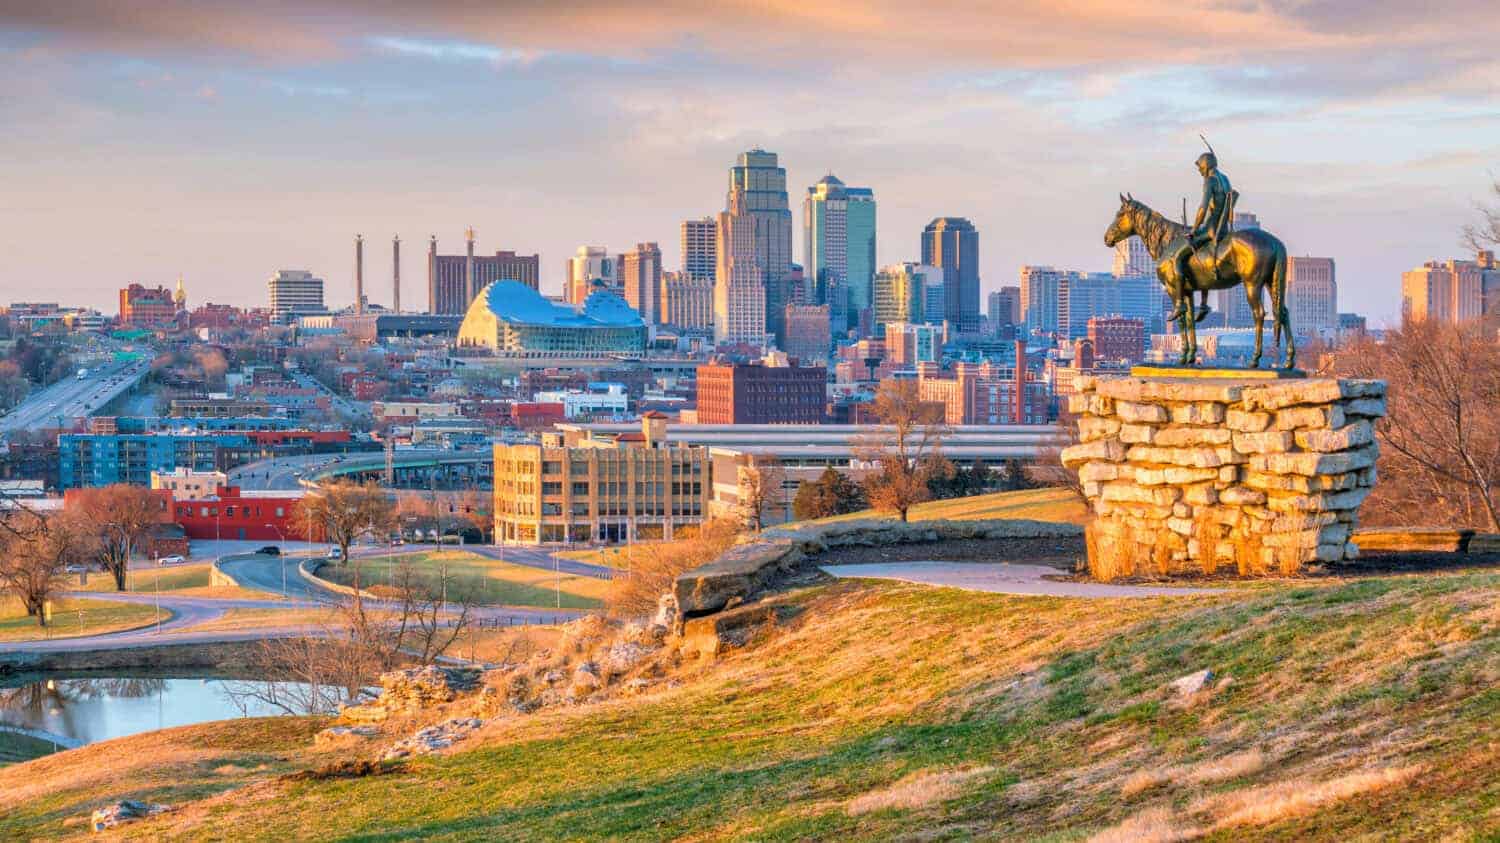
East 8th Street and Cleveland Avenue Area (Kansas City, Missouri)
Augurisk predicted 182 violent crimes per year in this Kansas City, Missouri block group, with a rate of 304 per 1,000 residents. In the 2014-2018 ACS data used for context, 31% of households reported less than $10,000 in annual income and median household income was $20,391. About 56% of residents were out of the labor force.
Division Street and Townsend Street Area (San Francisco)
This San Francisco block group, which is crossed by Interstate 80, ranked fourth in Augurisk’s analysis. The model predicted 296 violent crimes per year and a rate of 298 per 1,000 residents. The 2014-2018 ACS figures used by the analysis showed a median household income of $158,958 and a population that was 61% male. Augurisk also pointed to lower-income neighboring block groups and a high predicted property crime rate as part of the area’s broader risk profile.
7th Street and Alameda Street Area (Los Angeles)
Augurisk predicted 456 violent crimes per year in this Los Angeles block group, the largest predicted count among the 10 areas in its analysis, with a rate of 291 per 1,000 residents. In the 2014-2018 ACS data used for context, 60% of households reported less than $10,000 in annual income and median household income was $7,188. Augurisk said that placed the block group among the 65 lowest-income block groups in the country. Residents were 69% male, with median ages of 53.2 for men and 52.9 for women.
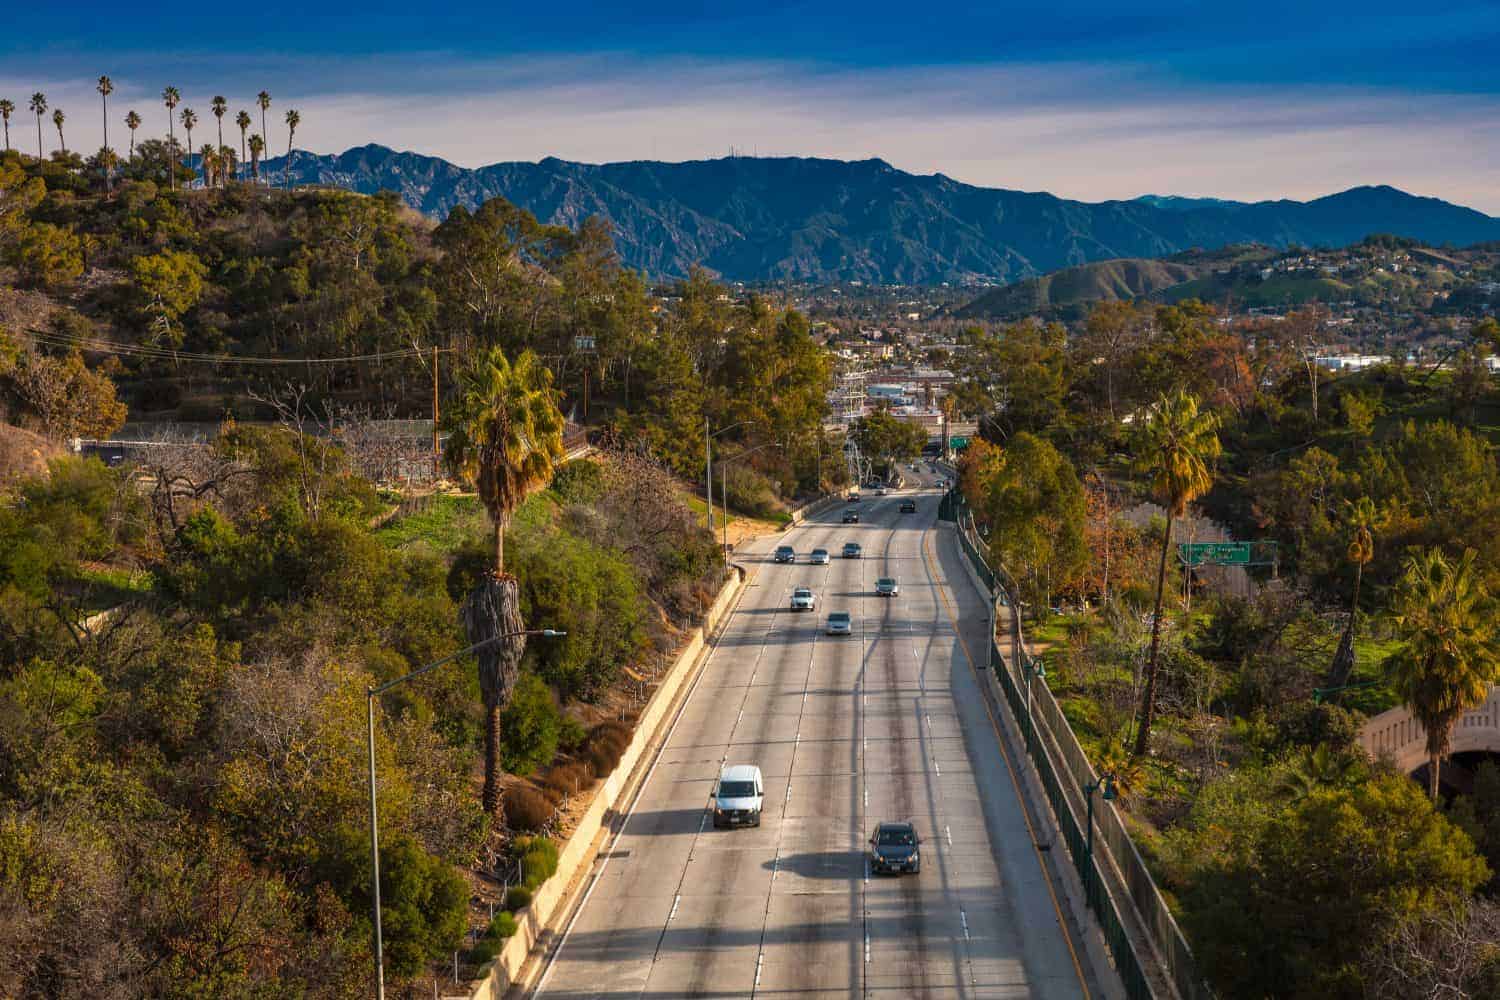
Santa Monica Freeway and Maple Avenue Area (Los Angeles)
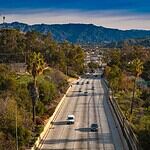
This block group near the Santa Monica Freeway ranked second in Augurisk’s 2021 analysis, with 407 predicted violent crimes per year and a rate of 293 per 1,000 residents. The 2014-2018 ACS data used for context showed that 64% of residents were male. Median age was 30.6 for men and 32.5 for women, and the area’s unemployment rate was higher than that of 87% of U.S. block groups.
East 5th Street and South San Pedro Street Area (Los Angeles)
Augurisk ranked this downtown Los Angeles block group first in its 2021 analysis, predicting 239 violent crimes per year and a violent crime rate of 347 per 1,000 residents. That was a ranking produced by Augurisk’s model, not an FBI designation. In the 2014-2018 ACS data used for context, 55% of households reported less than $10,000 in annual income and median household income was about $9,175. The population was 83% male, and about 80% of residents age 16 and older were out of the labor force.