
John Moore / Getty Images
Lightspring / Shutterstock.com

Public Domain / Wikimedia Commons

Photo by Drew Angerer / Getty Images

Tom Pennington / Getty Images
Pool / Getty Images News via Getty Images

Chip Somodevilla / Getty Images

Library of Congress

Marion Doss / BY-SA 2.0

Gage Skidmore / BY-SA 2.0

MPI / Archive Photos via Getty Images

pingnews.com / PDM 1.0
History In An Hour / BY 2.0

Rawpixel.com / Shutterstock.com












How Fast the National Debt Grew Under 10 U.S. Presidents
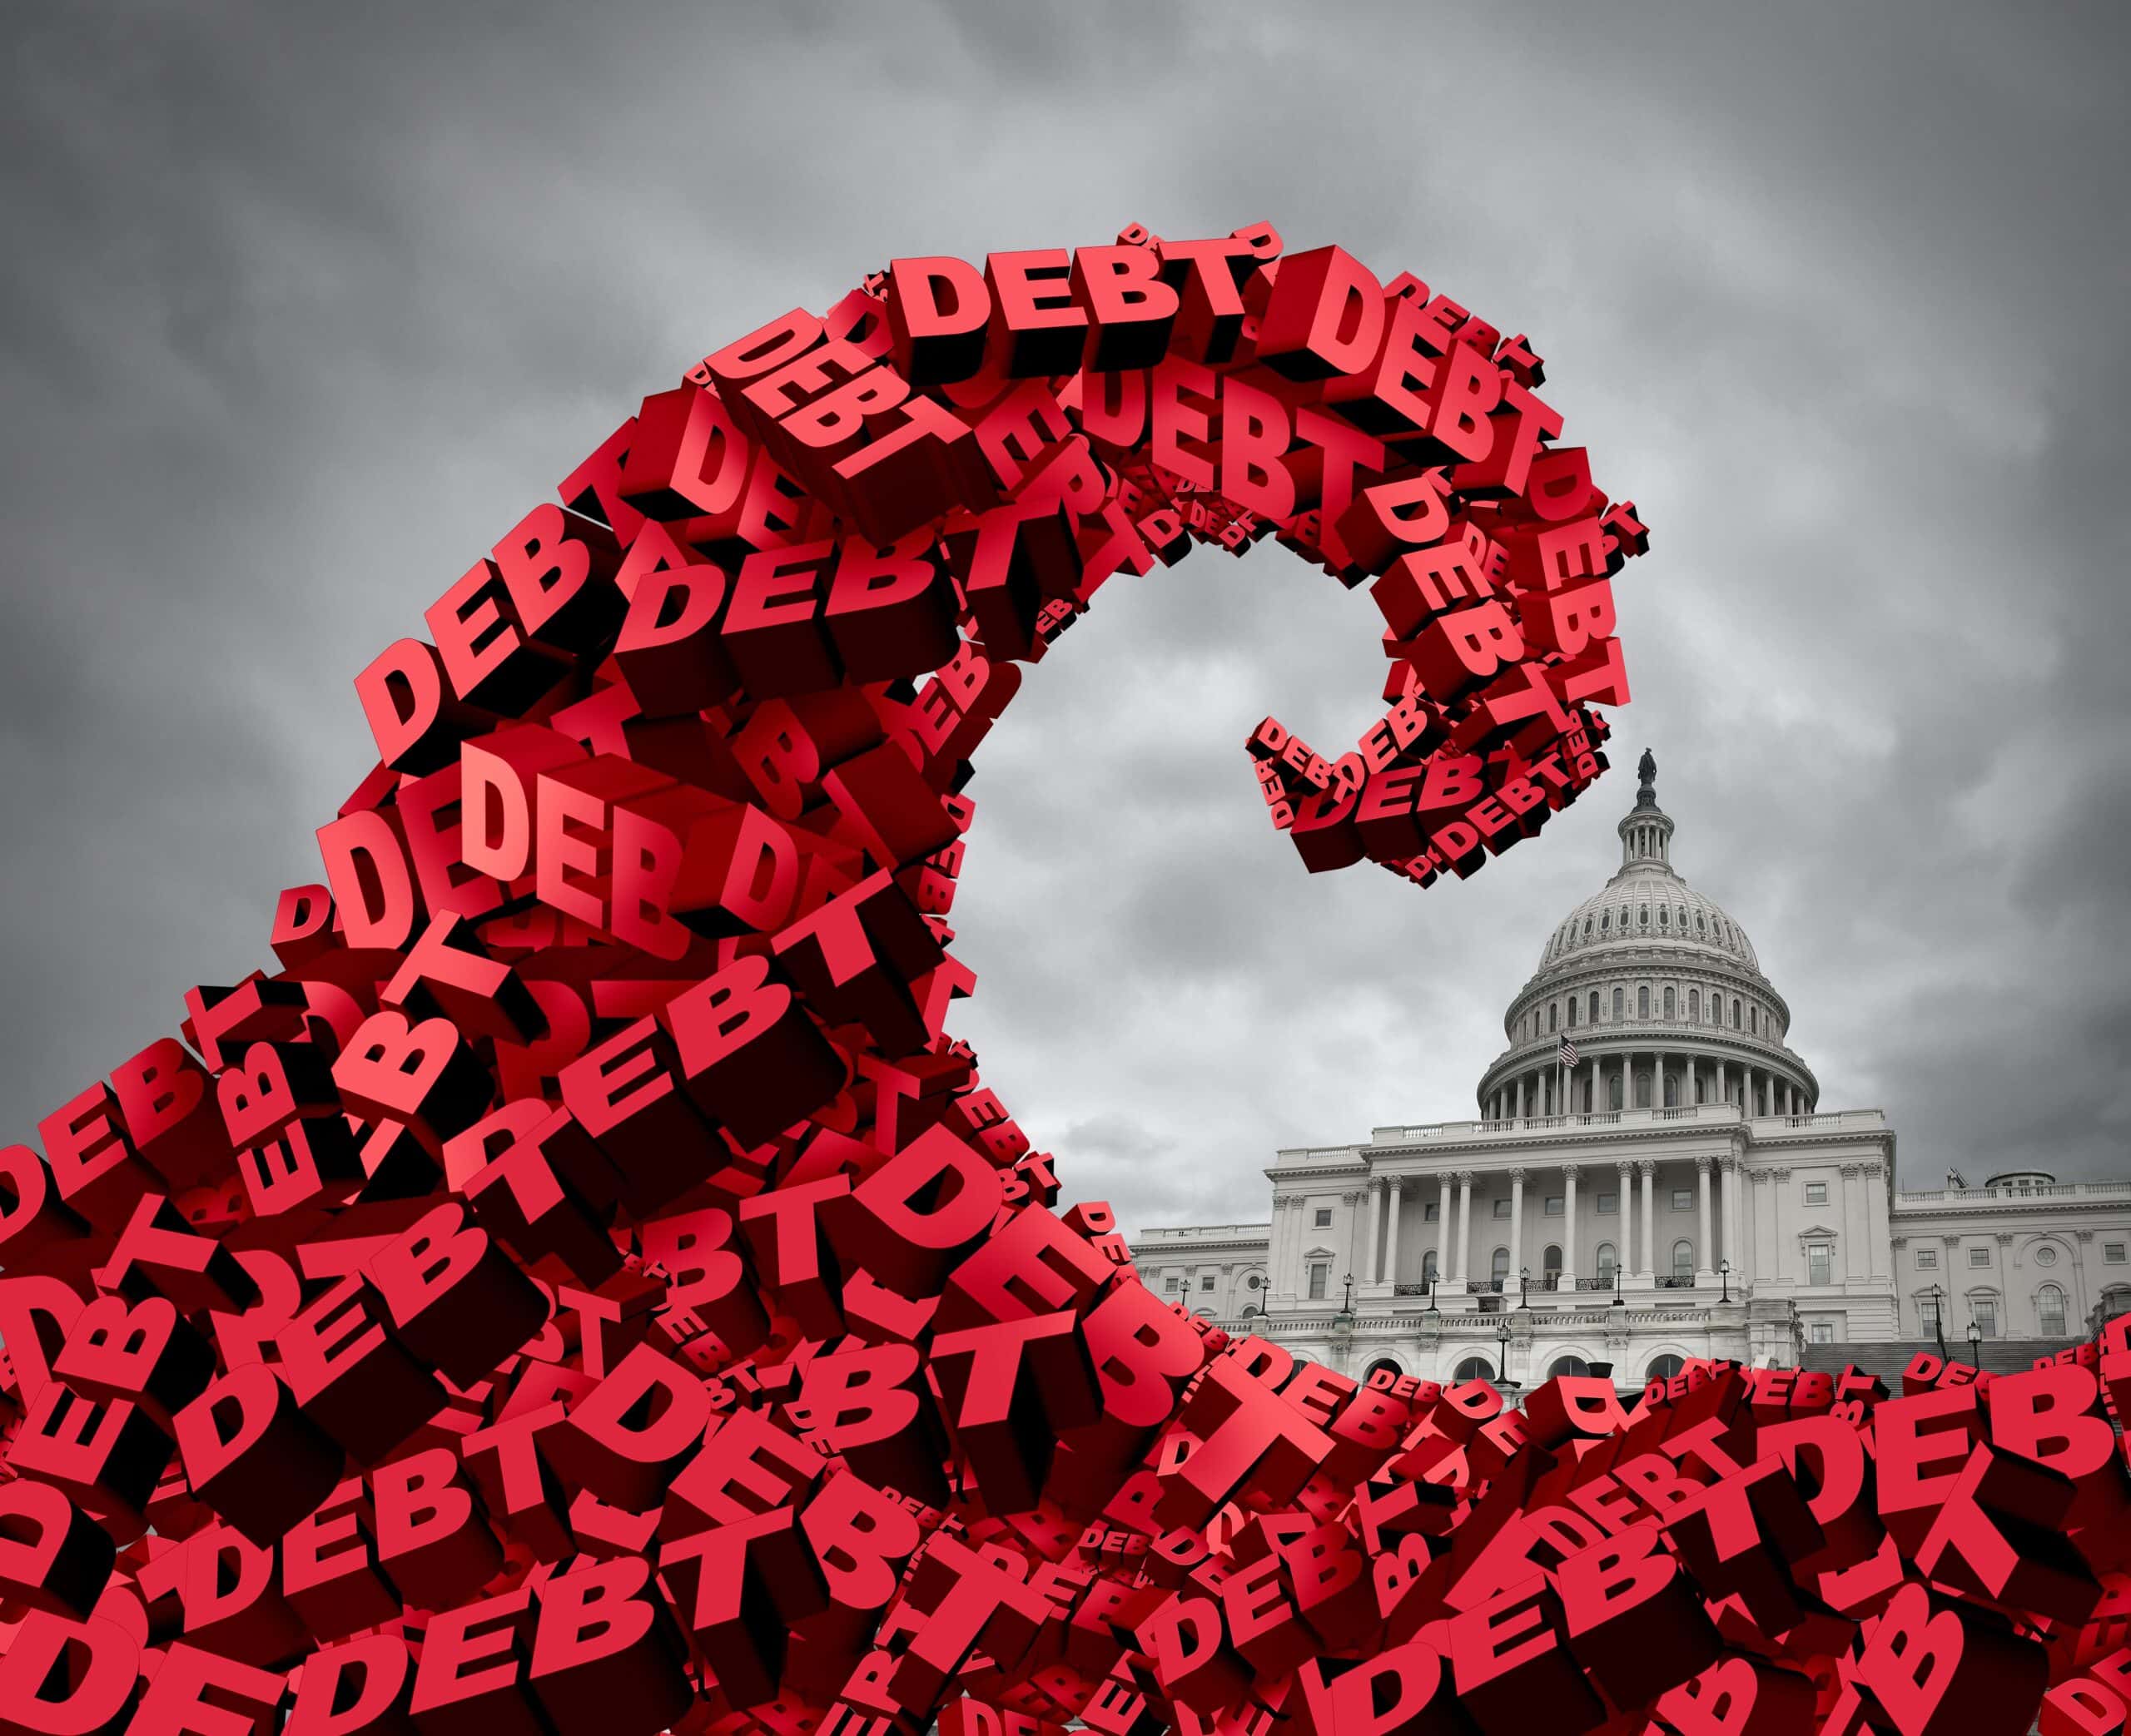
The national debt has become so large that even a trillion dollars can start to sound strangely abstract. One way to put those numbers back into perspective is to look at how quickly the debt changed during different presidential terms.
The differences are enormous. During some recent presidencies, total federal debt increased by well over $1 trillion per year on average. Go back a few decades and the annual increase was measured in tens or hundreds of billions. That does not automatically tell us which president handled the budget better. Inflation, the size of the economy, recessions, wars, emergencies, tax laws, spending passed by Congress, and decisions inherited from earlier administrations all matter. But the numbers do show just how dramatically the scale of federal borrowing has changed.
Before Comparing Presidents, Here Is What This Number Means
The numbers in this slideshow use Total Public Debt Outstanding, the Treasury's broad measure of gross federal debt. It includes money owed to investors, banks, the Federal Reserve, foreign governments, and other holders outside the federal government, along with debt held inside the government by trust funds and other federal accounts.
These are nominal dollars, meaning they are not adjusted for inflation. Recent presidents are therefore working with a much larger economy, federal budget, and existing debt load than presidents from 40 or 50 years ago. The annual figure is simply the increase in gross debt across a term divided by the approximate number of years served. It describes what happened during a presidency, not how much debt one president personally created.
Trump's Second Term: About $2.30 Trillion a Year So Far
Total public debt stood at roughly $36.22 trillion on Jan. 21, 2025, the first business-day Treasury reading after Donald Trump's second inauguration. By Sept. 24, 2026, it had reached about $40.07 trillion. That is an increase of approximately $3.85 trillion in roughly 20 months, which works out to an annualized pace of about $2.30 trillion.
The words "so far" matter here. Trump's second term does not end until January 2029, so this is not a final four-year average. Federal debt can move quickly as spending, tax receipts, interest costs, Treasury operations, legislation, and the economy change. What we can say is that the debt crossed $40 trillion for the first time in August 2026 and remained just above that level in late September.
Biden's Four Years Averaged About $2.12 Trillion Annually
Total public debt was about $27.75 trillion when Joe Biden took office in January 2021. The closest Treasury reading after his term ended was roughly $36.22 trillion on Jan. 21, 2025. The difference is about $8.47 trillion, averaging roughly $2.12 trillion for each of his four years in office.
Biden entered office while the federal government was still spending heavily in response to COVID-19 and its economic fallout. The most intense period of pandemic relief eventually ended, but large annual deficits continued. Interest costs also became more expensive as rates rose. As with every administration here, some of what happened reflected new legislation, while plenty of other spending was already built into federal law.
Trump's First Term Averaged About $1.95 Trillion a Year
When Trump began his first term in January 2017, total public debt stood at about $19.95 trillion. Four years later, it was roughly $27.75 trillion. That increase of around $7.80 trillion comes to approximately $1.95 trillion per year.
The average disguises just how unusual the final year became. The COVID-19 pandemic hit in 2020, bringing a sharp recession and several enormous relief packages passed with bipartisan support in Congress. Federal borrowing surged as Washington sent payments to households, supported businesses, expanded unemployment benefits, and responded to the public-health emergency. That makes the first Trump term a good example of why the number alone never tells the entire story.
Obama's Eight Years Averaged About $1.17 Trillion a Year
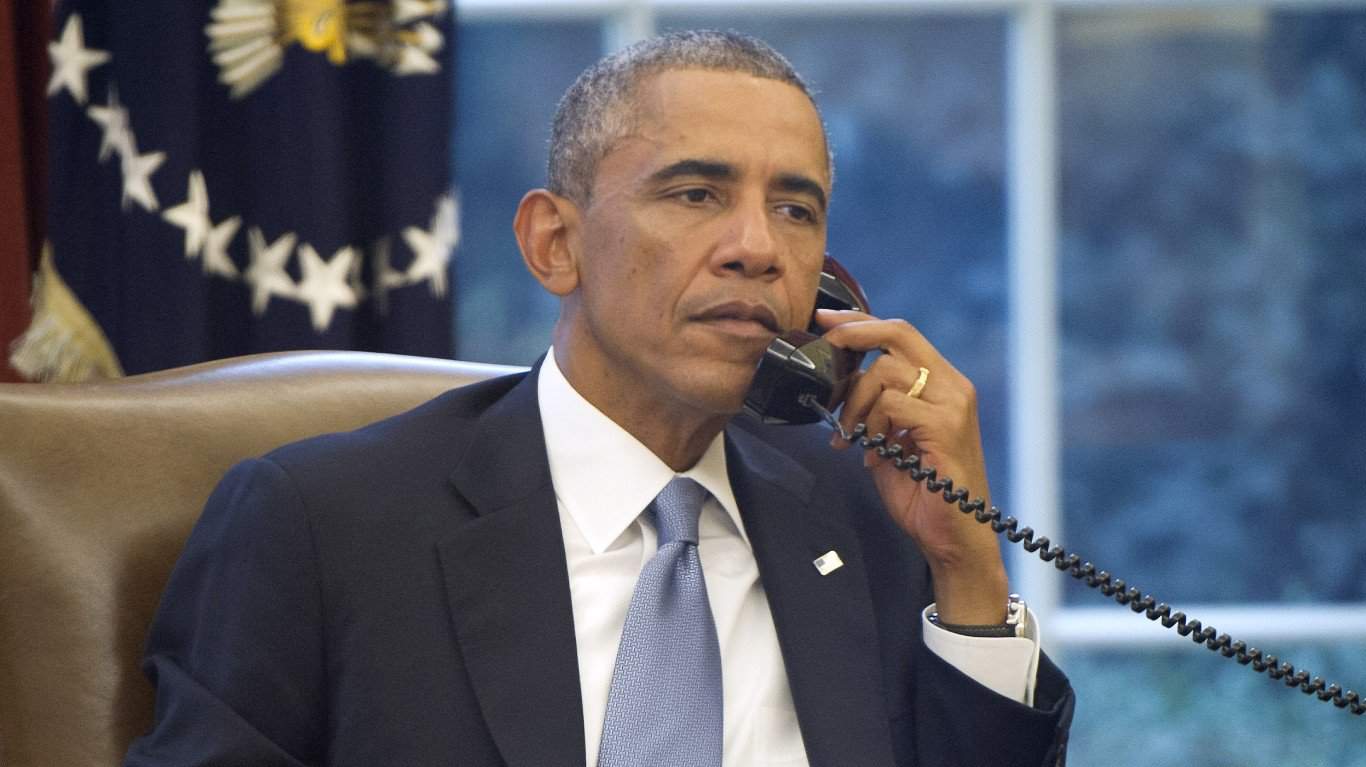
Barack Obama took office in January 2009 with total public debt at approximately $10.63 trillion. By the time he left office eight years later, it was about $19.95 trillion. The increase came to roughly $9.32 trillion, or approximately $1.17 trillion per year.
Obama walked into office during the financial crisis and Great Recession, when tax revenue had fallen and emergency federal spending was already climbing. Annual deficits later came down substantially from those crisis-era levels before beginning to increase again. Even so, the raw increase in gross debt across Obama's eight years was larger in nominal dollars than during any earlier eight-year presidency.
George W. Bush: Roughly $612 Billion a Year
Total public debt was about $5.73 trillion near the beginning of George W. Bush's presidency in 2001. When he left office in January 2009, it was approximately $10.63 trillion. That is an increase of roughly $4.90 trillion, averaging about $612 billion per year.
A lot happened inside those eight years. The United States fought wars in Afghanistan and Iraq, federal tax laws changed, new spending programs were created, and the country ended the period in the middle of the 2008 financial crisis. Because Bush left office while that crisis was still unfolding, its fiscal effects are split between the end of his presidency and the beginning of Obama's.
George H.W. Bush: Roughly $367 Billion a Year
Total public debt was about $2.70 trillion near the beginning of George H.W. Bush's presidency in January 1989. By the time Bill Clinton took office four years later, it was roughly $4.17 trillion.
That is an increase of about $1.47 trillion, or approximately $367 billion per year. His term included a recession as well as the major 1990 budget agreement. The important thing to remember is that this is simply the change between two federal debt snapshots. It does not attempt to trace every dollar back to one president, one Congress, or one piece of legislation.
Reagan: Roughly $220 Billion a Year
Total public debt was approximately $934 billion near the beginning of Ronald Reagan's presidency in January 1981. Eight years later, it had climbed to about $2.70 trillion, an increase of roughly $1.76 trillion.
That comes to about $220 billion per year in the dollars of the time. Compared with today's trillion-dollar annual increases, that can look almost modest. It was not. Gross federal debt nearly tripled during the eight-year span. The gap between that percentage change and the relatively small-looking dollar figure is exactly why comparing presidents across different eras can get tricky.
Clinton: Roughly $195 Billion a Year
Total public debt was about $4.17 trillion near the beginning of Bill Clinton's presidency in January 1993. By Jan. 19, 2001, it was roughly $5.73 trillion. The nominal increase was approximately $1.56 trillion across eight years, or around $195 billion per year.
The Clinton years also show why "the debt" and "the deficit" should not be used as though they are the same thing. The federal government recorded budget surpluses during several years late in Clinton's presidency, and debt held by the public declined for a time. Gross federal debt could still rise because it also includes money the Treasury owes to federal trust funds and other government accounts.
Ford: Roughly $71 Billion a Year
The Congressional Research Service puts total public debt at about $475.3 billion in July 1974, shortly before Gerald Ford became president. By January 1977, shortly after Jimmy Carter took office, it had risen to about $653.9 billion.
That is an increase of roughly $178.6 billion during Ford's approximately two and a half years in office, averaging about $71 billion per year. For presidents from this era, the comparison relies on nearby month-end Treasury readings rather than the precise daily figures available today, so the numbers are best read as close estimates rather than measurements down to the dollar.
Carter: Roughly $70 Billion a Year
Total public debt was about $653.9 billion at the January 1977 month-end reading used by CRS. By January 1981, it had reached approximately $934.1 billion. That is an increase of roughly $280.2 billion during Jimmy Carter's four years in office.
The average comes to about $70 billion per year, almost identical to Ford's pace in nominal dollars. Inflation was also extremely high during much of the late 1970s, which makes a straight dollar-for-dollar comparison with a president serving decades later especially misleading. Seventy billion dollars simply meant something very different in 1979 than it does today.
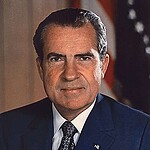
Nixon: Roughly $21 Billion a Year
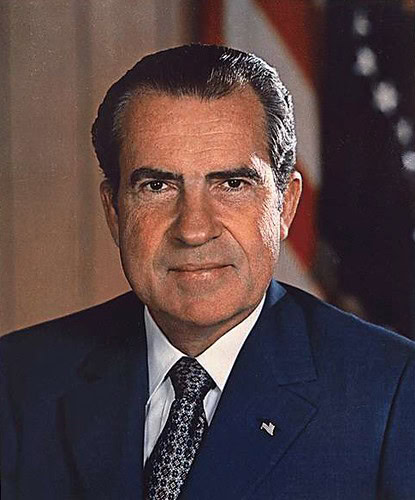
CRS puts total public debt at about $359.4 billion in January 1969 and roughly $475.3 billion in July 1974, shortly before Richard Nixon resigned. That is an increase of approximately $115.9 billion.
Across roughly five and a half years, the increase averages about $21 billion annually. Put that beside today's annual changes and it almost disappears, but that comparison is deceptive. The economy, federal budget, price level, and starting debt were all dramatically smaller in the early 1970s. Raw dollars are useful, but the farther apart the eras get, the less they tell you by themselves.
FDR Shows Why Raw Dollar Comparisons Need Context
Franklin D. Roosevelt is the clearest example of why nominal dollars can distort comparisons across generations. Federal debt at the end of fiscal 1933 was about $22.5 billion. By the end of fiscal 1945, after the Great Depression and most of World War II, it had reached approximately $258.7 billion.
That is an increase of about $236 billion, or less than $20 billion per year across the 12-year span. On a modern chart, that barely registers. Yet the debt grew to more than 11 times its 1933 level. The lesson is not that one measurement is useless. It is that no single measurement tells the whole story. Nominal dollars, inflation-adjusted dollars, debt as a share of GDP, debt held by the public, and annual budget deficits can each make the same period look very different.