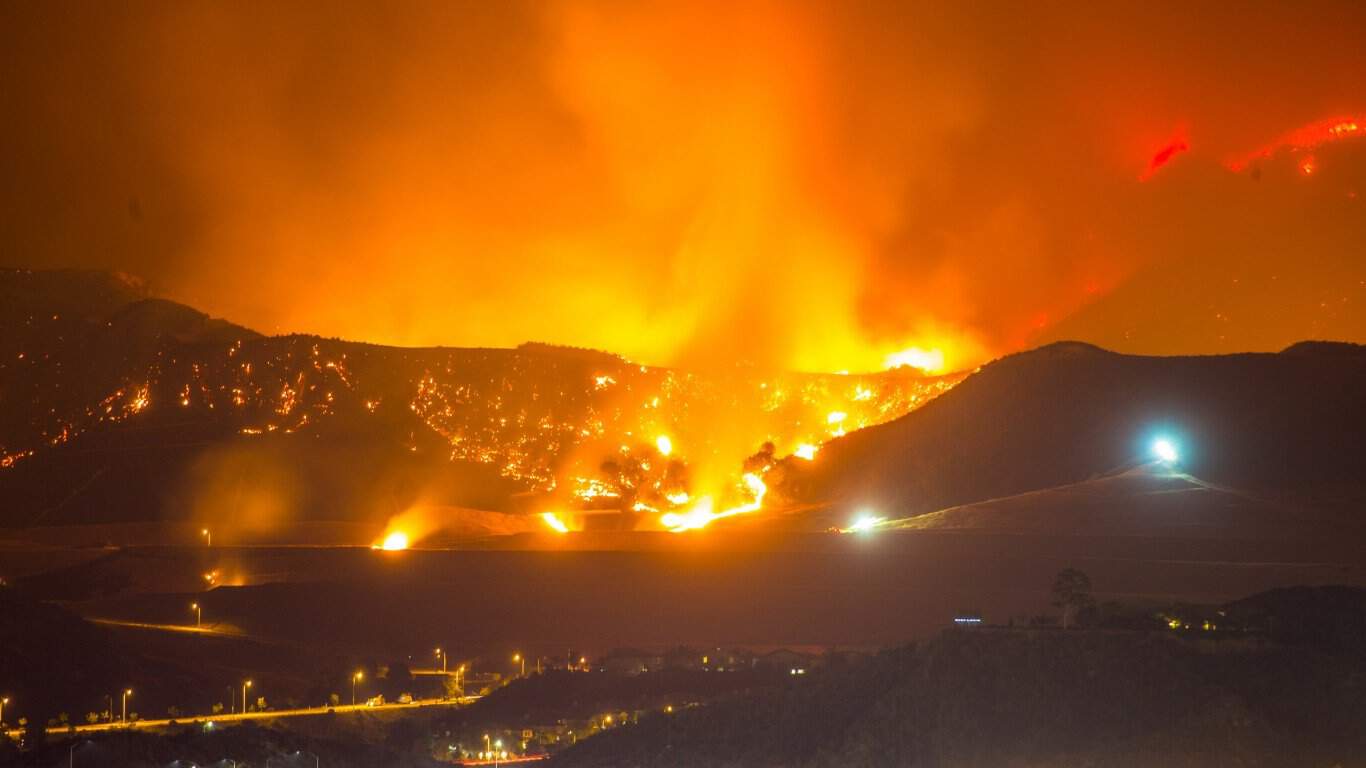
FrozenShutter / E+ via Getty Images

felixmizioznikov / iStock via Getty Images
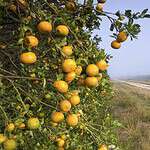
Jesse Kunerth / Shutterstock.com

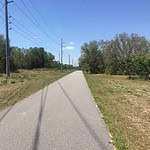
Michael Warren / iStock via Getty Images

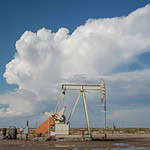
Rex_Wholster / iStock via Getty Images
colin_kai / Shutterstock.com

emholk / iStock via Getty Images

Robert Young / iStock via Getty Images
Larry Fleury / iStock via Getty Images
John Coletti / The Image Bank via Getty Images

Wirestock / iStock via Getty Images
MattGush / iStock via Getty Images
Donna Brooks / iStock via Getty Images

BOB WESTON / iStock via Getty Images

SevenMaps / Shutterstock.com

Public Domain / Wikimedia Commons

Bill_Dally / iStock via Getty Images

sanfel / iStock via Getty Images

sanfel / iStock via Getty Images

knowlesgallery / iStock via Getty Images

Cavan Images / iStock via Getty Images
magaro / iStock via Getty Images

Jupiterimages / PHOTOS.com>> via Getty Images

Erik Pronske Photography / Moment via Getty Images

Speedway1 / iStock via Getty Images

Althom / iStock Editorial via Getty Images

Jacob Boomsma / iStock via Getty Images

Jeremy Christensen / iStock via Getty Images
Donald Sykes / 500px / 500px via Getty Images
Solidago / Getty Images

aileen kang / 500px / 500px via Getty Images

Steve Proehl / The Image Bank via Getty Images
Rex_Wholster / iStock via Getty Images
SevenMaps / Shutterstock.com

Natalia Leen / iStock via Getty Images

Tamah Donaldson / iStock via Getty Images

DenisTangneyJr / iStock via Getty Images

csfotoimages / iStock Editorial via Getty Images

Timothy S. Allen / iStock via Getty Images

Getty Images / Getty Images News via Getty Images

Simply Beautiful Photos / iStock via Getty Images

Gregory Clifford / iStock via Getty Images

Ljexter / Shutterstock.com

HadelProductions / iStock via Getty Images

SevenMaps / Shutterstock.com

Jason Finn / iStock via Getty Images

ZargonDesign / E+ via Getty Images

Staplegunther / Public Domain

Aaron Echols / iStock via Getty Images

Raymond Shobe / Wikimedia Commons

BZK Photos / Shutterstock.com