
mitra kountik / Shutterstock.com
why 137 / BY 2.0
kevin dooley / BY 2.0

mtcurado / Getty Images

Dennis Wegewijs / iStock via Getty Images

nala_rinaldo / RooM via Getty Images

Akut Wibowo / Shutterstock.com
dblight / E+ via Getty Images

ashkapoorphotography / Shutterstock.com

ABCDstock / Shutterstock.com
derejeb / iStock via Getty Images

HomoCosmicos / iStock via Getty Images

VDCM image / E+ via Getty Images

Humam Altaie / Shutterstock.com
mitra kountik / Shutterstock.com

Kwame Kwegyir-Addo / iStock via Getty Images
Marco Di Lauro / Getty Images)

Framalicious/Shutterstock

Umar Kashif Thanvi / iStock via Getty Images

Adam Yee / Shutterstock.com
Kadagan / Shutterstock.com

zakir1346 / Shutterstock.com



19 Cities Where the Air Is Still Alarmingly Polluted
Air pollution is easy to ignore because most of the time you can't see exactly what you're breathing. The health effects are very real, though. The World Health Organization links air pollution to respiratory disease, heart disease, stroke, lung cancer, and other serious health problems, with children, older adults, pregnant people, and people with chronic disease among those at greater risk.
Air quality also changes fast. A city can have a rough annual pollution record and still get perfectly decent days, while a normally cleaner city can have a terrible afternoon because of smoke, dust, weather, or local emissions. That matters for travelers: the useful question isn't just which cities struggle with pollution over the long run, but what the air looks like while you're actually there.
For this update, 24/7 Tempo reviewed IQAir's 2025 annual PM2.5 data and health guidance from the World Health Organization and AirNow. Rather than treating one hourly snapshot as a permanent world ranking, the city sections below use the latest full-year PM2.5 averages available from IQAir and compare them with the WHO annual guideline of 5 micrograms per cubic meter.
Air Pollutants: What Are They?
Particulate matter is usually discussed as PM2.5 and PM10, names that refer to the size of the particles. PM2.5 particles are 2.5 micrometers across or smaller, while PM10 includes particles up to 10 micrometers. Sources include transportation, industry, power generation, construction, biomass burning, agriculture, and natural sources such as dust. Because PM2.5 is small enough to penetrate deep into the lungs, long-term exposure is associated with cardiovascular and respiratory disease and lung cancer.
Ozone and nitrogen dioxide matter too. Ground-level ozone is not emitted directly; it forms in the atmosphere from other pollutants and can irritate and inflame the airways, worsen asthma, and reduce lung function. Nitrogen dioxide is also linked to respiratory effects. WHO's 2021 guidelines recommend annual averages of no more than 5 µg/m³ for PM2.5, 15 µg/m³ for PM10, and 10 µg/m³ for nitrogen dioxide, while ozone uses shorter and seasonal averaging periods rather than a simple annual limit.
How to Read AQI and Annual PM2.5
The U.S. Air Quality Index, or AQI, is a daily health index, so it should not be confused with a city's annual PM2.5 average. On the U.S. scale, 0 to 50 is "good," 51 to 100 is "moderate," 101 to 150 is "unhealthy for sensitive groups," and 151 to 200 is "unhealthy." Live readings can move quickly, which is why checking the current AQI before a long day outside is more useful than relying on a city's reputation alone. The list below is not a live ranking; it shows how these cities compared on IQAir's 2025 annual PM2.5 data.
Kinshasa, Democratic Republic of the Congo
Kinshasa remained one of the more polluted cities in IQAir's 2025 dataset. Its annual average PM2.5 concentration was 50.2 µg/m³, down from 58.2 µg/m³ in 2024. That's still about 10 times the WHO annual PM2.5 guideline of 5 µg/m³, so the improvement did not suddenly turn Kinshasa into a clean-air destination.
An annual average does not tell you what the air will be doing on a particular morning. For anyone traveling in Kinshasa, especially children, older adults, and people with heart or lung disease, the smart move is to check the day's AQI before planning strenuous outdoor activity. AirNow advises sensitive groups to reduce prolonged or heavy exertion once AQI reaches the "unhealthy for sensitive groups" range and to avoid strenuous outdoor activity when it reaches "unhealthy."
Kampala, Uganda
Kampala's 2025 annual PM2.5 average was 44.2 µg/m³, according to IQAir, up from 41.0 µg/m³ in 2024. That works out to nearly nine times the WHO annual guideline. In other words, the city's long-term particulate pollution remains a real health concern even though the air on any individual day may be better or worse than that annual number suggests.
Travelers should use the current AQI as the day-to-day guide. When particle pollution is elevated, cutting back on long or strenuous outdoor activity lowers exposure, and people with asthma, COPD, heart disease, or other conditions that make them more vulnerable should be particularly cautious. If the reading is moderate, most people can generally continue normal activities, while unusually sensitive people may still notice symptoms.
Jakarta, Indonesia
Jakarta's air improved in IQAir's annual data, but it still has a long way to go. The city's average PM2.5 concentration fell from 41.7 µg/m³ in 2024 to 34.1 µg/m³ in 2025. Even after that drop, the 2025 average was almost seven times the WHO annual guideline.
That full-year average is better for judging chronic exposure than a single day's AQI, but it won't tell you whether a particular afternoon is good for a long walk. Jakarta's live conditions can change with weather and emissions, so travelers should check the current reading and scale back prolonged outdoor exertion when AQI moves into unhealthy ranges.
Batam, Indonesia
Batam's 2025 annual PM2.5 average was 22.6 µg/m³, according to IQAir, slightly better than 23.1 µg/m³ in 2024. That is about 4.5 times the WHO annual guideline. It also shows why this list should not be read as a strict ranking of the world's most polluted cities: Batam's long-term average is elevated, but many cities in IQAir's global dataset recorded substantially higher annual concentrations.
For a traveler, today's reading still matters more than last year's average when deciding whether to spend hours outside. IQAir's Batam page relies on a satellite-derived model for current conditions, so readings should be treated as estimates rather than a substitute for a dense local monitoring network. Sensitive travelers should take extra care when the AQI climbs.
Dubai, United Arab Emirates
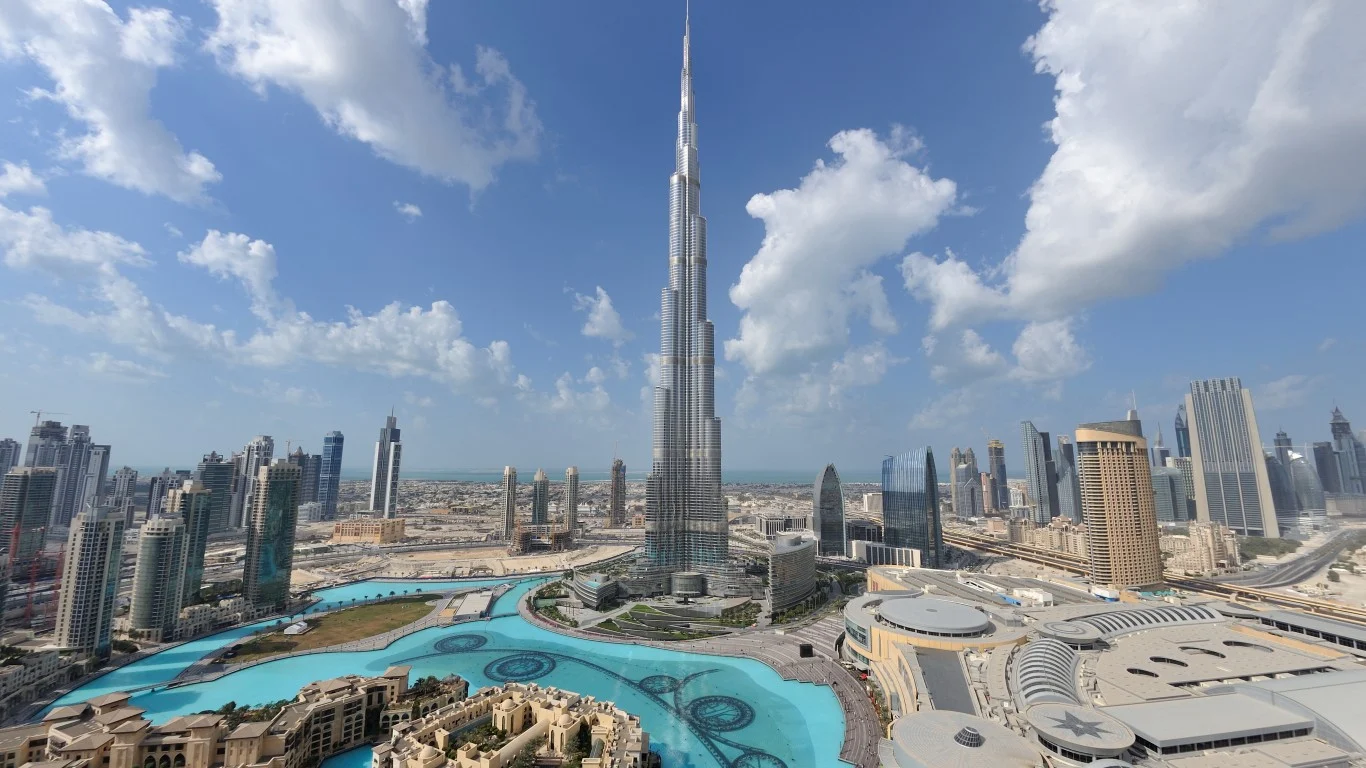
Dubai recorded an annual average PM2.5 concentration of 35.8 µg/m³ in 2025, up from 33.4 µg/m³ in 2024, according to IQAir. That's a little more than seven times the WHO annual guideline. The number is a yearly average, so it folds together cleaner days and much dirtier ones rather than describing what visitors will breathe every hour of a trip.
Before outdoor sightseeing or exercise, check the live AQI instead of assuming conditions from the annual figure. On days when the AQI is in the "unhealthy" range, AirNow recommends that everyone cut back or reschedule prolonged or heavy exertion, while sensitive groups should avoid strenuous outdoor activity.
Delhi, India
Delhi remains in a different league from most cities on this list. IQAir reported an annual average PM2.5 concentration of 99.6 µg/m³ in 2025, down from 108.3 µg/m³ in 2024 but still almost 20 times the WHO annual guideline. That is an extremely high level of long-term fine-particle pollution.
Daily conditions can still swing considerably, so visitors should check the current AQI and not assume every hour looks like the annual average. When readings are high, reducing time spent in strenuous outdoor activity can meaningfully reduce exposure. People with heart or lung disease, children, and older adults should be especially careful during unhealthy pollution episodes.
Beijing, China
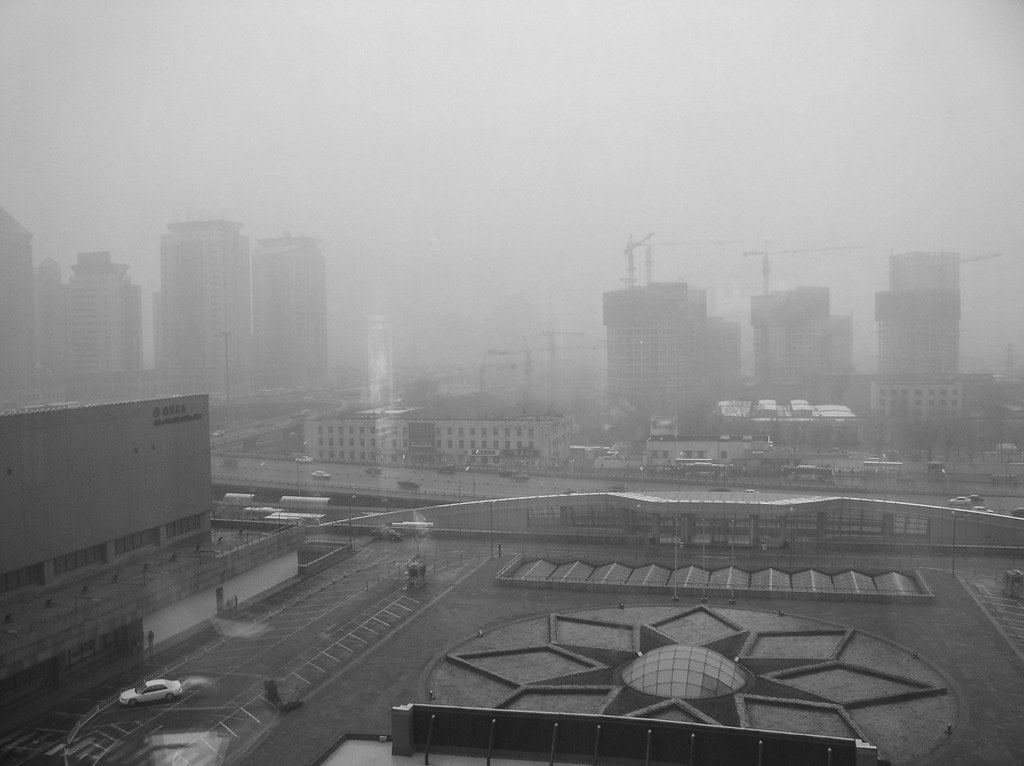
Beijing's long-term PM2.5 levels have improved substantially compared with where they were several years ago, but they remain above the WHO guideline. IQAir put the city's 2025 annual average at 26.8 µg/m³, down from 30.9 µg/m³ in 2024 and less than half its 2017 average of 58.8 µg/m³.
At 26.8 µg/m³, Beijing's 2025 average was still more than five times the WHO annual guideline. For travelers, that is a reason to watch the current AQI rather than a reason to cancel outdoor plans automatically. A clear day and a polluted day can feel like two different cities, and the live reading is what should drive activity choices.
Addis Ababa, Ethiopia
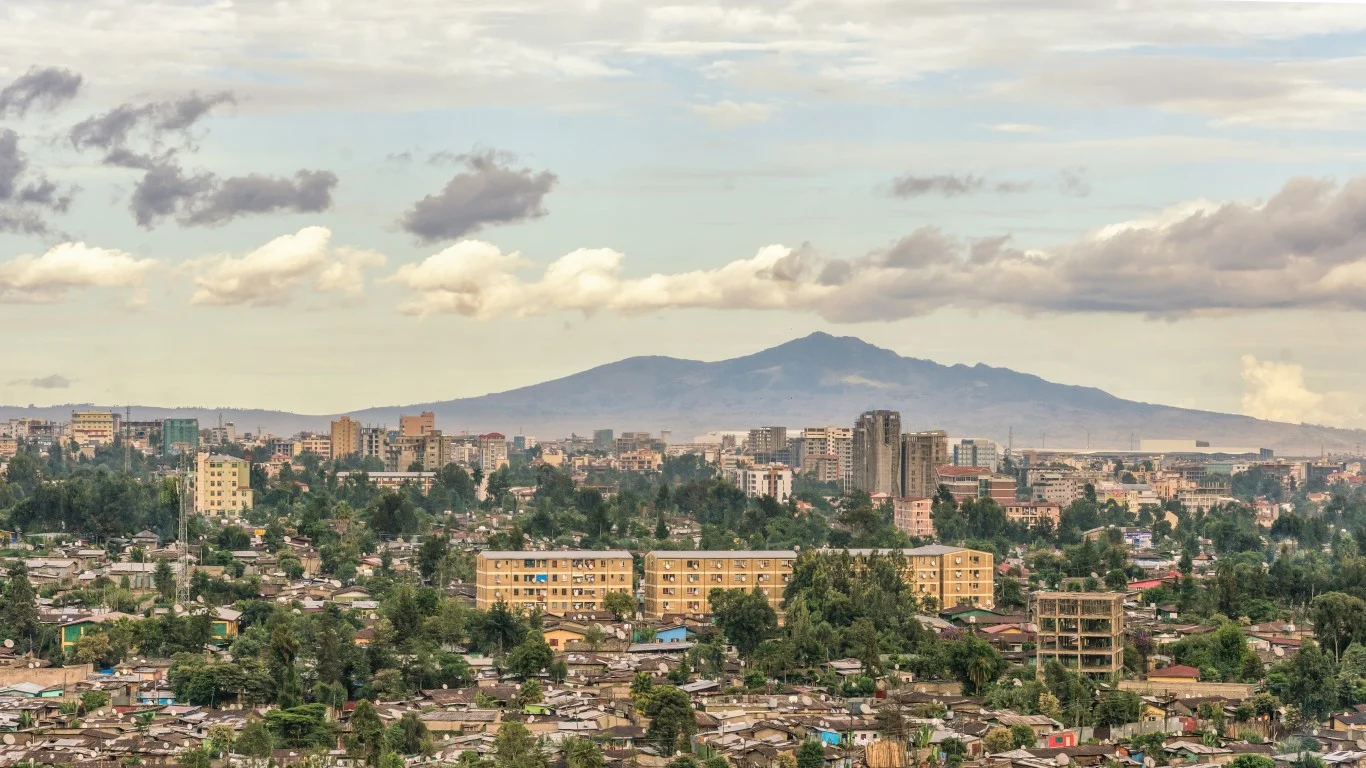
Addis Ababa's annual PM2.5 average was 22.4 µg/m³ in 2025, almost unchanged from 22.2 µg/m³ in 2024. That puts the city's yearly concentration at roughly 4.5 times the WHO annual guideline. It is an elevated long-term level, though well below the averages recorded in places such as Delhi, Lahore, and Dhaka.
The practical advice is the same as elsewhere: use a live AQI reading for today's decision. At moderate levels, most people can remain active normally. Once the index reaches unhealthy ranges, sensitive groups should reduce or avoid prolonged strenuous activity, and everyone should shorten heavy outdoor exertion as pollution rises.
Lahore, Pakistan
Lahore remained among the most polluted cities in IQAir's 2025 data. Its annual average PM2.5 concentration was 88.9 µg/m³, an improvement from 102.1 µg/m³ in 2024 but still nearly 18 times the WHO annual guideline. That is a major long-term exposure burden even after the year-over-year decline.
For residents and visitors, this is one of the places where checking the live AQI is worth making part of the morning routine. During unhealthy pollution episodes, AirNow guidance calls for everyone to reduce prolonged or heavy outdoor exertion, with stricter precautions for children, older adults, and people with heart or lung disease.
Busan, South Korea
Busan's 2025 annual PM2.5 average was 14.8 µg/m³, up from 13.8 µg/m³ in 2024. That is just under three times the WHO annual guideline. Busan's long-term fine-particle pollution is therefore elevated, but it is far lower than the levels seen in the most polluted cities on this list.
That distinction matters. An annual average of 14.8 µg/m³ should not be translated into a permanent "unhealthy" AQI label, because annual PM2.5 and daily AQI measure different things. Travelers should check the current AQI before adjusting plans, especially if they are unusually sensitive to air pollution.
Baghdad, Iraq
Baghdad's annual average PM2.5 concentration reached 44.3 µg/m³ in 2025, according to IQAir, up from 40.5 µg/m³ in 2024. That is almost nine times the WHO annual guideline. The full-year average confirms that fine-particle pollution is a persistent issue rather than something limited to an occasional bad day.
It still does not mean every day in Baghdad has an "unhealthy" AQI. Daily air quality changes, and the U.S. AQI is based on shorter-term pollutant concentrations. Check the live reading before prolonged outdoor activity and take greater precautions if the AQI rises into the unhealthy ranges.
Kolkata, India
Kolkata's 2025 annual PM2.5 average was 51.0 µg/m³, up from 45.6 µg/m³ in 2024, according to IQAir. That is a little more than 10 times the WHO annual guideline. For long-term fine-particle exposure, Kolkata remains one of the more concerning cities in this group.
On the ground, conditions can vary a lot from day to day. If the AQI reaches 101 to 150, people in sensitive groups should cut back on prolonged or heavy exertion. At 151 to 200, AirNow recommends that everyone reduce prolonged or heavy exertion while sensitive groups avoid strenuous outdoor activity.
Accra, Ghana
Accra posted a notable year-over-year improvement in IQAir's data. The city's annual PM2.5 average fell from 36.3 µg/m³ in 2024 to 21.0 µg/m³ in 2025. That's still about 4.2 times the WHO annual guideline, so the better number should not be confused with meeting the health-based target.
Accra can also experience short-term pollution spikes that look much worse than the annual average. That is exactly why a traveler should check current conditions rather than rely on a yearly statistic. If the day's AQI moves into unhealthy territory, shorten strenuous outdoor plans and give sensitive travelers more protection from exposure.
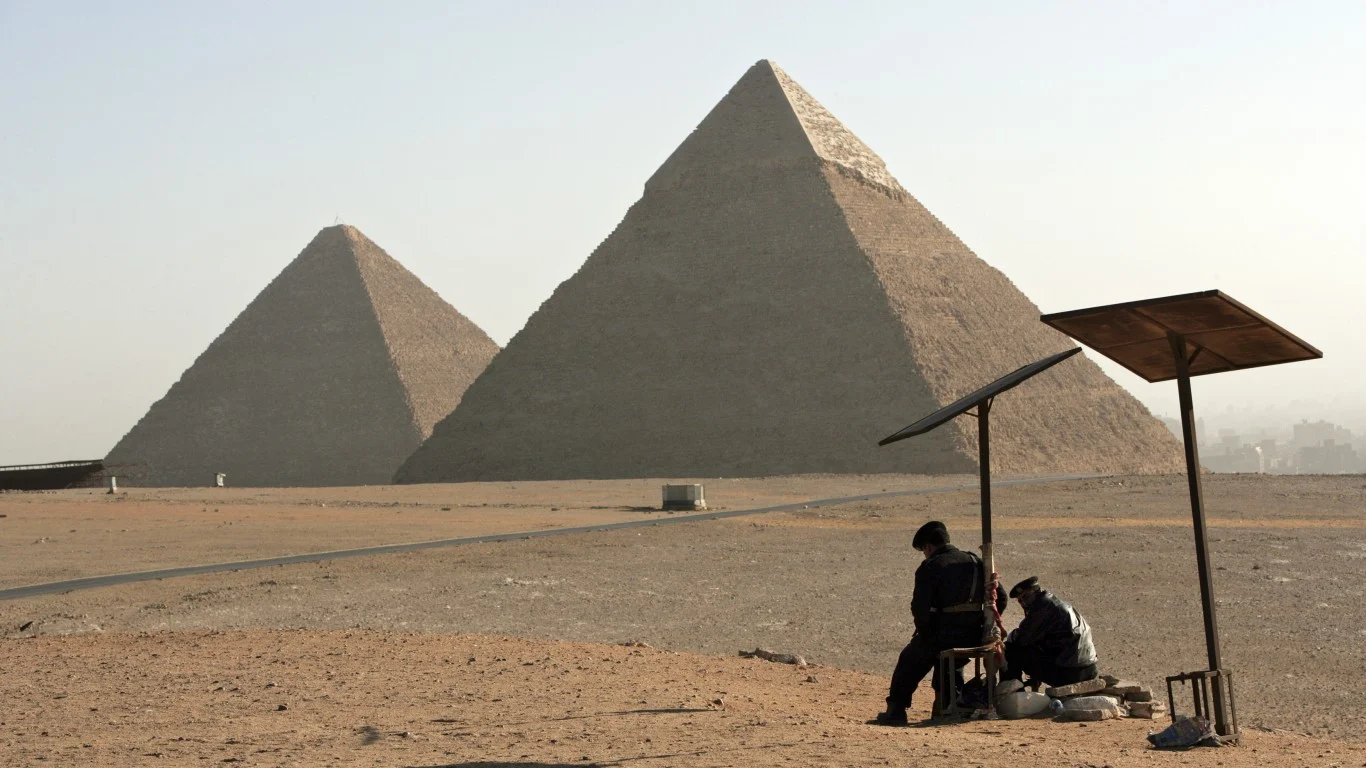
Cairo, Egypt
Cairo's annual average PM2.5 concentration was 40.8 µg/m³ in 2025, nearly unchanged from 39.9 µg/m³ in 2024. That is a little more than eight times the WHO annual guideline. The number reflects fine-particle pollution averaged across an entire year, not a permanent daily AQI category.
For visitors, the best approach is simple: check the current AQI before spending hours outside, especially if the day already looks dusty or hazy. Sensitive groups should reduce prolonged or heavy exertion when the AQI reaches the "unhealthy for sensitive groups" range and take stronger precautions if conditions worsen.
Jerusalem, Israel
Jerusalem's 2025 annual PM2.5 average was 13.9 µg/m³, down from 15.0 µg/m³ in 2024, according to IQAir. That is about 2.8 times the WHO annual guideline. Jerusalem can still have sharp short-term pollution events, but those episodes should not be mistaken for the city's year-round average.
That difference showed up clearly in 2025, when IQAir documented a late-August episode in which Jerusalem briefly ranked among the world's most polluted major cities as its AQI rose above 110. The larger lesson is useful anywhere: annual averages describe long-term exposure, while live AQI is what travelers should use to decide whether today's outdoor plans need to change.
Karachi, Pakistan
Karachi's annual average PM2.5 concentration was 45.9 µg/m³ in 2025, down slightly from 47.1 µg/m³ in 2024. That is a little more than nine times the WHO annual guideline. The year-to-year change was modest, and the city's long-term fine-particle pollution remained high.
There is no need to guess what that means for a specific afternoon. Check the live AQI. When particle pollution reaches unhealthy levels, reducing strenuous outdoor activity lowers the amount of polluted air you inhale, and people with heart or lung disease, children, and older adults should be more cautious than the general population.
Chengdu, China
Chengdu's annual average PM2.5 concentration rose from 32.0 µg/m³ in 2024 to 33.8 µg/m³ in 2025, according to IQAir. That puts the 2025 average at nearly seven times the WHO annual guideline. It is a meaningful long-term pollution level, even though daily conditions will move above and below that yearly average.
Travelers do not need to treat that number as a verdict on every day in Chengdu. Use current AQI data when planning long walks, runs, or other strenuous outdoor activity. If the AQI reaches an unhealthy category, dial back prolonged exertion and take extra care with anyone in a sensitive group.
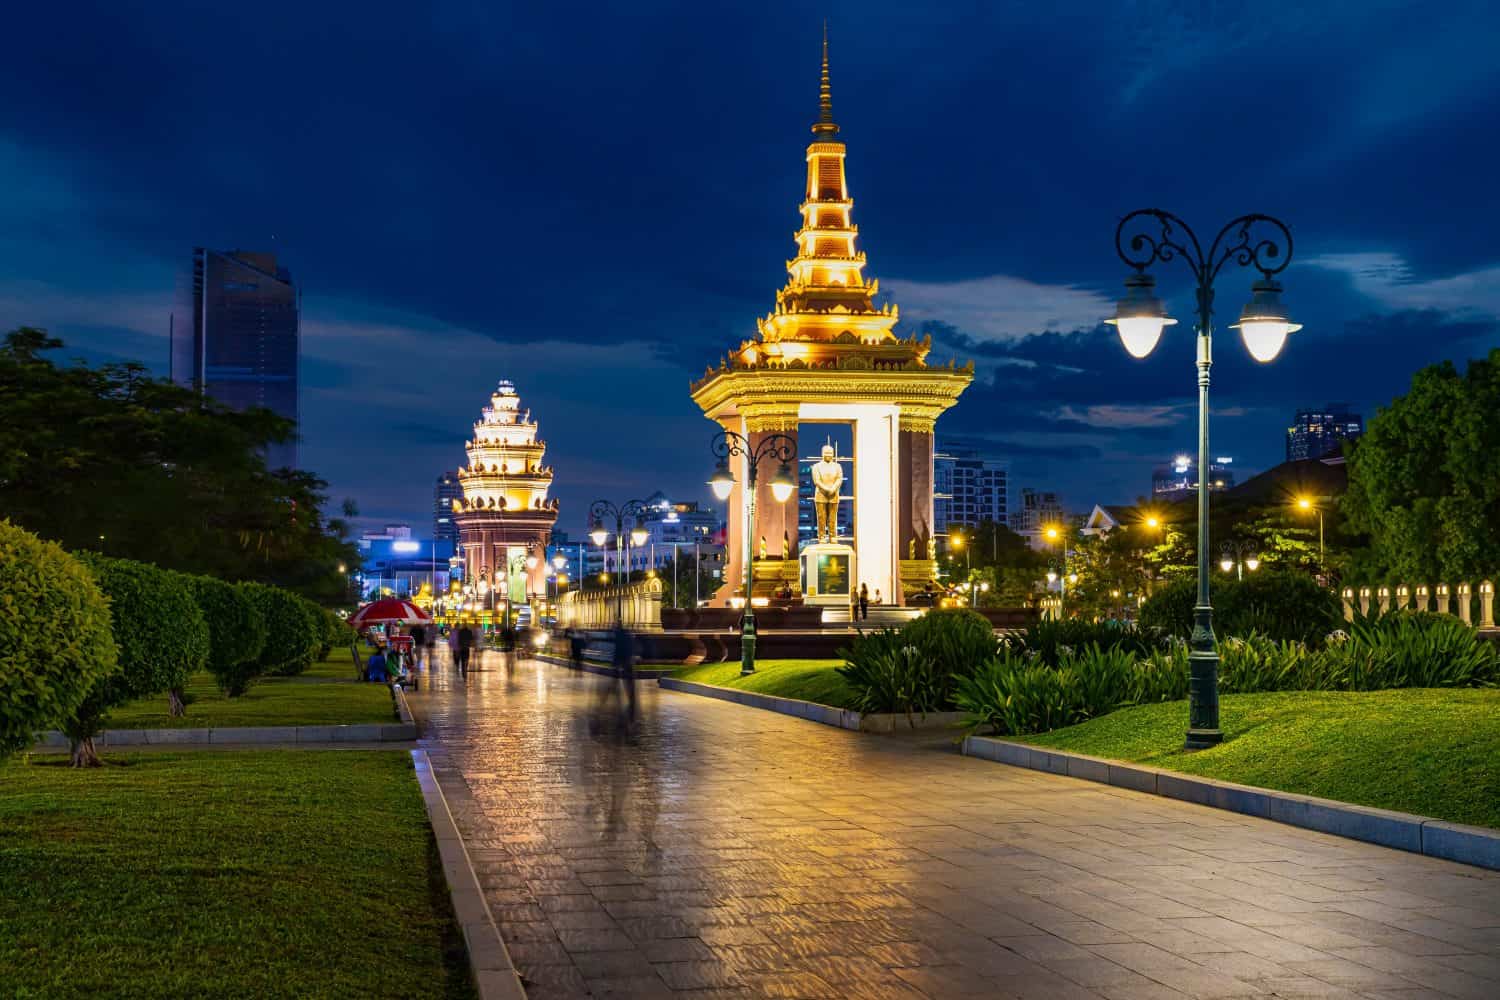
Phnom Penh, Cambodia
Phnom Penh's annual average PM2.5 concentration improved from 21.9 µg/m³ in 2024 to 18.0 µg/m³ in 2025. That is still 3.6 times the WHO annual guideline, but it is substantially lower than the levels recorded in cities such as Delhi, Lahore, Dhaka, and Kolkata.
Because the annual average is not a daily forecast, it would be a mistake to say outdoor exercise is always safe or always unsafe in Phnom Penh. Check the current AQI and adjust accordingly. Most people can carry on normally when air quality is moderate, while sensitive people may need to scale back if pollution climbs.
Dhaka, Bangladesh
Dhaka's annual average PM2.5 concentration was 68.0 µg/m³ in 2025, down from 78.0 µg/m³ in 2024, according to IQAir. Even with that improvement, the 2025 average was 13.6 times the WHO annual guideline. Dhaka therefore remained one of the highest-pollution cities in this group.
For anyone spending time in Dhaka, live AQI should be treated the same way you would treat a weather forecast. If the index rises into unhealthy ranges, reduce prolonged or heavy outdoor exertion. Children, older adults, and people with heart or lung disease should take extra care because they are more likely to experience health effects from elevated particle pollution.