Like the saying goes, we may be finished with COVID, but COVID isn’t finished with us. New variants appear as older ones fade into insignificance. The once-dreaded Omicron strain has all but disappeared, for example. The variant of the moment, an Omicron descendent, carries the more anonymous name of JN.1. According to the Centers for Disease Control and Prevention, it was the cause of an estimated 85.7% of COVID cases nationwide as of late last month – though early hospital data suggests that it does not appear to be any more virulent than its predecessors.
Experts agree that the most accurate way of tracking the progression of new cases is through analysis of wastewater, and in mid-January, PBS reported that data gathered that way “has shown that COVID cases have risen to second-highest levels since the pandemic began.” In December, according to the World Health Organization, hospitalizations for the disease rose by more than 40% in both Europe and America – and people are still dying from COVID, or from conditions exacerbated by the virus, every day. As of early January, as many as 1,400 people in the U.S. were succumbing to it every week.
The virus will probably continue to thrive and claim more lives, at least until warmer weather sets in across the country and slows down its progression as people spend more time outdoors. As always, though, those of advanced age or with compromised immune status or serious health conditions like diabetes and heart or lung disease, remain particularly at risk. (Heart disease still tops the list of the 15 leading causes of death in America.)
To determine the states where the COVID-19 surge is the worst right now, 24/7 Tempo consulted data from the Centers for Disease Control and Prevention on the number of new hospital admissions due to COVID-19 per 100,000 state residents for the week of Jan. 21-Jan. 27, 2024.
There have been some changes since last week. New York had the highest rate of new weekly hospital admissions for COVID, 11.4 per 100,000. This week, it has dropped to third place, with 9.5 per 100,000, with its No. 1 spot taken by Connecticut (formerly in fifth place), at 9.8 per 100,000.
At the other end of the scale, last week’s lowest rate was scored by New Mexico (2.9 per 100,000). That number remains the same for the state, but Wyoming has moved slightly lower, at 2.4 per 100,000.
Here are the states where the COVID-19 surge is the worst:
Methodology
To determine the states where the COVID-19 surge is the worst right now, 24/7 Tempo reviewed data on recent COVID-19 hospital admissions from the Centers for Disease Control and Prevention. States were ranked based on the number of new hospital admissions due to COVID-19 per 100,000 state residents for the week of Jan. 21-Jan. 27, 2024. Supplemental data on the total number of recorded COVID-19 hospital admissions since Aug. 1, 2020; the total number of deaths due to COVID-19 since January 2020; and the COVID-19 test positivity rate for the week of Jan. 21-Jan. 27, 2024 also came from the CDC. It should be noted that this metric is widely considered to be inaccurate today, due to the closing down of many official testing centers and the fact that the results of home tests are rarely reported. Population data used to adjust hospital admission and death counts per capita came from the U.S. Census Bureau’s Population and Housing Unit Estimates program and is for July 1, 2022.
50. Wyoming

- New weekly COVID-19 hospital admissions, Jan. 21-Jan. 27, 2024: 2.4 per 100,000 (14 total)
- COVID-19 hospital admissions since Aug. 1, 2020: 2,076.4 per 100,000 (22nd highest)
- COVID-19 deaths since January 2020: 382.4 per 100,000 (19th highest)
- Current COVID-19 test positivity rate: 7.6% (17th lowest)
49. New Mexico

- New weekly COVID-19 hospital admissions, Jan. 21-Jan. 27, 2024: 2.9 per 100,000 (61 total)
- COVID-19 hospital admissions since Aug. 1, 2020: 1,925.9 per 100,000 (21st lowest)
- COVID-19 deaths since January 2020: 453.7 per 100,000 (5th highest)
- Current COVID-19 test positivity rate: 12.0% (3rd highest)
48. Maine

- New weekly COVID-19 hospital admissions, Jan. 21-Jan. 27, 2024: 3.6 per 100,000 (50 total)
- COVID-19 hospital admissions since Aug. 1, 2020: 1,201.8 per 100,000 (4th lowest)
- COVID-19 deaths since January 2020: 253.8 per 100,000 (8th lowest)
- Current COVID-19 test positivity rate: 1.1% (6th lowest)
47. Kansas
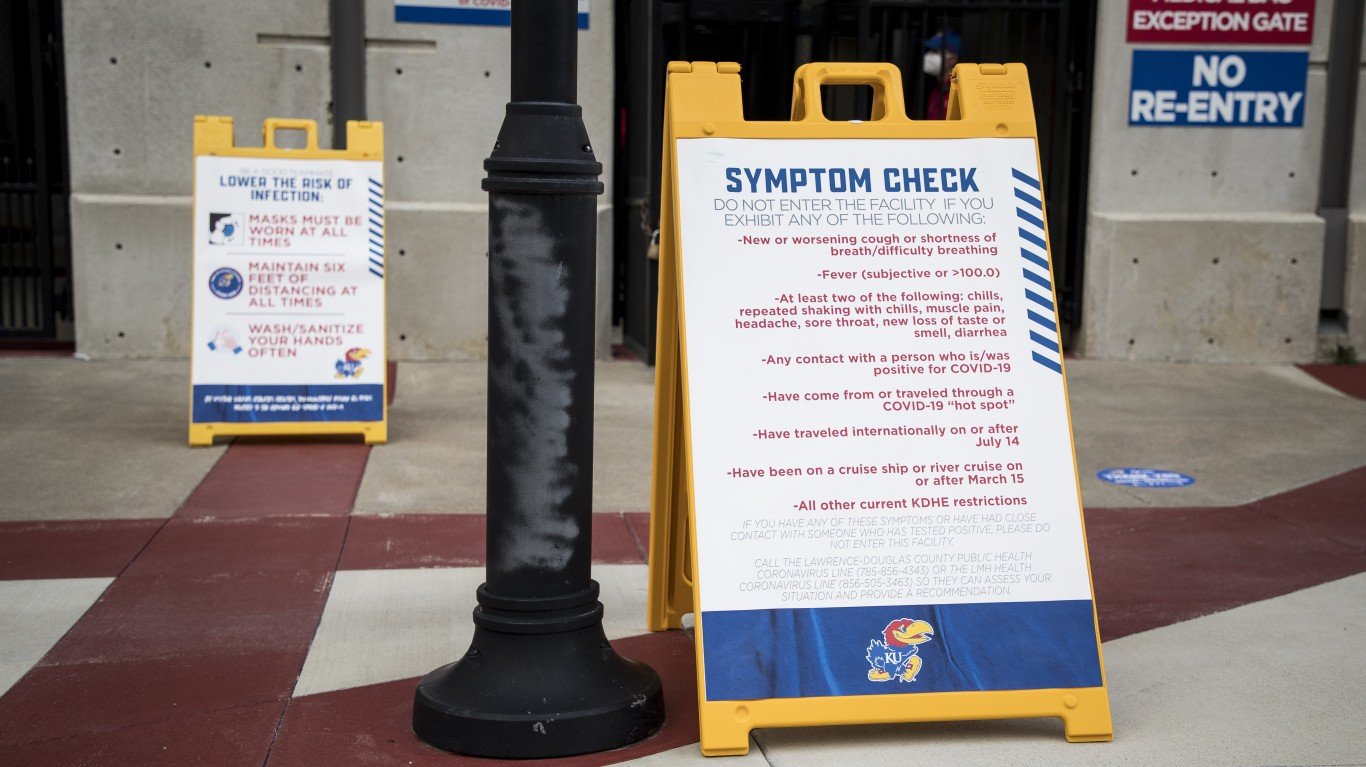
- New weekly COVID-19 hospital admissions, Jan. 21-Jan. 27, 2024: 4.2 per 100,000 (123 total)
- COVID-19 hospital admissions since Aug. 1, 2020: 2,079.9 per 100,000 (21st highest)
- COVID-19 deaths since January 2020: 371.6 per 100,000 (23rd highest)
- Current COVID-19 test positivity rate: 9.1% (22nd highest)
46. Utah

- New weekly COVID-19 hospital admissions, Jan. 21-Jan. 27, 2024: 4.3 per 100,000 (144 total)
- COVID-19 hospital admissions since Aug. 1, 2020: 1,491.7 per 100,000 (9th lowest)
- COVID-19 deaths since January 2020: 168.6 per 100,000 (2nd lowest)
- Current COVID-19 test positivity rate: 7.6% (17th lowest)
45. North Dakota

- New weekly COVID-19 hospital admissions, Jan. 21-Jan. 27, 2024: 4.5 per 100,000 (35 total)
- COVID-19 hospital admissions since Aug. 1, 2020: 2,088.3 per 100,000 (20th highest)
- COVID-19 deaths since January 2020: 347.5 per 100,000 (22nd lowest)
- Current COVID-19 test positivity rate: 7.6% (17th lowest)
44. Mississippi

- New weekly COVID-19 hospital admissions, Jan. 21-Jan. 27, 2024: 4.6 per 100,000 (135 total)
- COVID-19 hospital admissions since Aug. 1, 2020: 1,982.2 per 100,000 (25th lowest)
- COVID-19 deaths since January 2020: 519.3 per 100,000 (the highest)
- Current COVID-19 test positivity rate: 10.8% (8th highest)
43. Colorado

- New weekly COVID-19 hospital admissions, Jan. 21-Jan. 27, 2024: 4.7 per 100,000 (276 total)
- COVID-19 hospital admissions since Aug. 1, 2020: 1,798.7 per 100,000 (18th lowest)
- COVID-19 deaths since January 2020: 265.4 per 100,000 (9th lowest)
- Current COVID-19 test positivity rate: 7.6% (17th lowest)
42. Nebraska

- New weekly COVID-19 hospital admissions, Jan. 21-Jan. 27, 2024: 4.8 per 100,000 (94 total)
- COVID-19 hospital admissions since Aug. 1, 2020: 1,746.9 per 100,000 (17th lowest)
- COVID-19 deaths since January 2020: 302.9 per 100,000 (15th lowest)
- Current COVID-19 test positivity rate: 9.1% (22nd highest)
41. Washington

- New weekly COVID-19 hospital admissions, Jan. 21-Jan. 27, 2024: 4.8 per 100,000 (372 total)
- COVID-19 hospital admissions since Aug. 1, 2020: 1,068.1 per 100,000 (the lowest)
- COVID-19 deaths since January 2020: 201.5 per 100,000 (4th lowest)
- Current COVID-19 test positivity rate: 8.7% (25th lowest)
40. Montana

- New weekly COVID-19 hospital admissions, Jan. 21-Jan. 27, 2024: 4.9 per 100,000 (55 total)
- COVID-19 hospital admissions since Aug. 1, 2020: 2,844.0 per 100,000 (3rd highest)
- COVID-19 deaths since January 2020: 356.5 per 100,000 (25th lowest)
- Current COVID-19 test positivity rate: 7.6% (17th lowest)
39. Nevada

- New weekly COVID-19 hospital admissions, Jan. 21-Jan. 27, 2024: 4.9 per 100,000 (157 total)
- COVID-19 hospital admissions since Aug. 1, 2020: 2,125.5 per 100,000 (16th highest)
- COVID-19 deaths since January 2020: 383.0 per 100,000 (18th highest)
- Current COVID-19 test positivity rate: 7.8% (21st lowest)
38. Oregon

- New weekly COVID-19 hospital admissions, Jan. 21-Jan. 27, 2024: 5.0 per 100,000 (210 total)
- COVID-19 hospital admissions since Aug. 1, 2020: 1,200.7 per 100,000 (3rd lowest)
- COVID-19 deaths since January 2020: 229.2 per 100,000 (6th lowest)
- Current COVID-19 test positivity rate: 8.7% (25th lowest)
37. Alaska

- New weekly COVID-19 hospital admissions, Jan. 21-Jan. 27, 2024: 5.2 per 100,000 (38 total)
- COVID-19 hospital admissions since Aug. 1, 2020: 1,400.7 per 100,000 (6th lowest)
- COVID-19 deaths since January 2020: 211.8 per 100,000 (5th lowest)
- Current COVID-19 test positivity rate: 8.7% (25th lowest)
36. Wisconsin

- New weekly COVID-19 hospital admissions, Jan. 21-Jan. 27, 2024: 5.3 per 100,000 (311 total)
- COVID-19 hospital admissions since Aug. 1, 2020: 2,297.1 per 100,000 (10th highest)
- COVID-19 deaths since January 2020: 301.1 per 100,000 (14th lowest)
- Current COVID-19 test positivity rate: 10.3% (16th highest)
35. New Hampshire
- New weekly COVID-19 hospital admissions, Jan. 21-Jan. 27, 2024: 5.3 per 100,000 (74 total)
- COVID-19 hospital admissions since Aug. 1, 2020: 1,435.2 per 100,000 (7th lowest)
- COVID-19 deaths since January 2020: 248.0 per 100,000 (7th lowest)
- Current COVID-19 test positivity rate: 1.1% (6th lowest)
34. Idaho

- New weekly COVID-19 hospital admissions, Jan. 21-Jan. 27, 2024: 5.3 per 100,000 (103 total)
- COVID-19 hospital admissions since Aug. 1, 2020: 1,558.6 per 100,000 (12th lowest)
- COVID-19 deaths since January 2020: 292.7 per 100,000 (13th lowest)
- Current COVID-19 test positivity rate: 8.7% (25th lowest)
33. Minnesota

- New weekly COVID-19 hospital admissions, Jan. 21-Jan. 27, 2024: 5.3 per 100,000 (305 total)
- COVID-19 hospital admissions since Aug. 1, 2020: 1,505.5 per 100,000 (10th lowest)
- COVID-19 deaths since January 2020: 284.3 per 100,000 (11th lowest)
- Current COVID-19 test positivity rate: 10.3% (16th highest)
32. Indiana

- New weekly COVID-19 hospital admissions, Jan. 21-Jan. 27, 2024: 5.4 per 100,000 (370 total)
- COVID-19 hospital admissions since Aug. 1, 2020: 2,180.9 per 100,000 (15th highest)
- COVID-19 deaths since January 2020: 392.9 per 100,000 (14th highest)
- Current COVID-19 test positivity rate: 10.3% (16th highest)
31. Iowa

- New weekly COVID-19 hospital admissions, Jan. 21-Jan. 27, 2024: 5.4 per 100,000 (174 total)
- COVID-19 hospital admissions since Aug. 1, 2020: 1,841.2 per 100,000 (19th lowest)
- COVID-19 deaths since January 2020: 360.8 per 100,000 (25th highest)
- Current COVID-19 test positivity rate: 9.1% (22nd highest)
30. Tennessee

- New weekly COVID-19 hospital admissions, Jan. 21-Jan. 27, 2024: 5.5 per 100,000 (391 total)
- COVID-19 hospital admissions since Aug. 1, 2020: 1,964.0 per 100,000 (23rd lowest)
- COVID-19 deaths since January 2020: 419.0 per 100,000 (11th highest)
- Current COVID-19 test positivity rate: 10.8% (8th highest)
29. Delaware

- New weekly COVID-19 hospital admissions, Jan. 21-Jan. 27, 2024: 5.8 per 100,000 (59 total)
- COVID-19 hospital admissions since Aug. 1, 2020: 2,107.3 per 100,000 (18th highest)
- COVID-19 deaths since January 2020: 352.1 per 100,000 (24th lowest)
- Current COVID-19 test positivity rate: 6.3% (11th lowest)
28. Maryland

- New weekly COVID-19 hospital admissions, Jan. 21-Jan. 27, 2024: 6.0 per 100,000 (367 total)
- COVID-19 hospital admissions since Aug. 1, 2020: 1,676.5 per 100,000 (14th lowest)
- COVID-19 deaths since January 2020: 305.7 per 100,000 (16th lowest)
- Current COVID-19 test positivity rate: 6.3% (11th lowest)
27. Arizona

- New weekly COVID-19 hospital admissions, Jan. 21-Jan. 27, 2024: 6.0 per 100,000 (439 total)
- COVID-19 hospital admissions since Aug. 1, 2020: 2,210.3 per 100,000 (13th highest)
- COVID-19 deaths since January 2020: 412.7 per 100,000 (13th highest)
- Current COVID-19 test positivity rate: 7.8% (21st lowest)
26. Illinois

- New weekly COVID-19 hospital admissions, Jan. 21-Jan. 27, 2024: 6.0 per 100,000 (754 total)
- COVID-19 hospital admissions since Aug. 1, 2020: 1,975.2 per 100,000 (24th lowest)
- COVID-19 deaths since January 2020: 330.4 per 100,000 (19th lowest)
- Current COVID-19 test positivity rate: 10.3% (16th highest)
25. Oklahoma

- New weekly COVID-19 hospital admissions, Jan. 21-Jan. 27, 2024: 6.0 per 100,000 (241 total)
- COVID-19 hospital admissions since Aug. 1, 2020: 2,863.3 per 100,000 (2nd highest)
- COVID-19 deaths since January 2020: 500.2 per 100,000 (3rd highest)
- Current COVID-19 test positivity rate: 12.0% (3rd highest)
24. Georgia

- New weekly COVID-19 hospital admissions, Jan. 21-Jan. 27, 2024: 6.3 per 100,000 (683 total)
- COVID-19 hospital admissions since Aug. 1, 2020: 2,292.2 per 100,000 (11th highest)
- COVID-19 deaths since January 2020: 338.8 per 100,000 (20th lowest)
- Current COVID-19 test positivity rate: 10.8% (8th highest)
23. Texas

- New weekly COVID-19 hospital admissions, Jan. 21-Jan. 27, 2024: 6.3 per 100,000 (1,883 total)
- COVID-19 hospital admissions since Aug. 1, 2020: 2,124.8 per 100,000 (17th highest)
- COVID-19 deaths since January 2020: 346.6 per 100,000 (21st lowest)
- Current COVID-19 test positivity rate: 12.0% (3rd highest)
22. North Carolina

- New weekly COVID-19 hospital admissions, Jan. 21-Jan. 27, 2024: 6.3 per 100,000 (671 total)
- COVID-19 hospital admissions since Aug. 1, 2020: 1,679.1 per 100,000 (15th lowest)
- COVID-19 deaths since January 2020: 328.1 per 100,000 (18th lowest)
- Current COVID-19 test positivity rate: 10.8% (8th highest)
21. California

- New weekly COVID-19 hospital admissions, Jan. 21-Jan. 27, 2024: 6.4 per 100,000 (2,496 total)
- COVID-19 hospital admissions since Aug. 1, 2020: 1,687.7 per 100,000 (16th lowest)
- COVID-19 deaths since January 2020: 286.3 per 100,000 (12th lowest)
- Current COVID-19 test positivity rate: 7.8% (21st lowest)
20. Michigan

- New weekly COVID-19 hospital admissions, Jan. 21-Jan. 27, 2024: 6.4 per 100,000 (642 total)
- COVID-19 hospital admissions since Aug. 1, 2020: 2,069.3 per 100,000 (23rd highest)
- COVID-19 deaths since January 2020: 388.4 per 100,000 (17th highest)
- Current COVID-19 test positivity rate: 10.3% (16th highest)
19. Arkansas

- New weekly COVID-19 hospital admissions, Jan. 21-Jan. 27, 2024: 6.5 per 100,000 (199 total)
- COVID-19 hospital admissions since Aug. 1, 2020: 2,350.4 per 100,000 (8th highest)
- COVID-19 deaths since January 2020: 422.9 per 100,000 (9th highest)
- Current COVID-19 test positivity rate: 12.0% (3rd highest)
18. Ohio

- New weekly COVID-19 hospital admissions, Jan. 21-Jan. 27, 2024: 6.9 per 100,000 (815 total)
- COVID-19 hospital admissions since Aug. 1, 2020: 2,379.8 per 100,000 (7th highest)
- COVID-19 deaths since January 2020: 435.8 per 100,000 (7th highest)
- Current COVID-19 test positivity rate: 10.3% (16th highest)
17. Kentucky

- New weekly COVID-19 hospital admissions, Jan. 21-Jan. 27, 2024: 7.0 per 100,000 (316 total)
- COVID-19 hospital admissions since Aug. 1, 2020: 3,617.3 per 100,000 (the highest)
- COVID-19 deaths since January 2020: 461.3 per 100,000 (4th highest)
- Current COVID-19 test positivity rate: 10.8% (8th highest)
16. Vermont

- New weekly COVID-19 hospital admissions, Jan. 21-Jan. 27, 2024: 7.1 per 100,000 (46 total)
- COVID-19 hospital admissions since Aug. 1, 2020: 1,102.5 per 100,000 (2nd lowest)
- COVID-19 deaths since January 2020: 173.6 per 100,000 (3rd lowest)
- Current COVID-19 test positivity rate: 1.1% (6th lowest)
15. South Dakota

- New weekly COVID-19 hospital admissions, Jan. 21-Jan. 27, 2024: 7.1 per 100,000 (65 total)
- COVID-19 hospital admissions since Aug. 1, 2020: 2,302.1 per 100,000 (9th highest)
- COVID-19 deaths since January 2020: 372.4 per 100,000 (22nd highest)
- Current COVID-19 test positivity rate: 7.6% (17th lowest)
14. Hawaii

- New weekly COVID-19 hospital admissions, Jan. 21-Jan. 27, 2024: 7.2 per 100,000 (103 total)
- COVID-19 hospital admissions since Aug. 1, 2020: 1,491.6 per 100,000 (8th lowest)
- COVID-19 deaths since January 2020: 142.6 per 100,000 (the lowest)
- Current COVID-19 test positivity rate: 7.8% (21st lowest)
13. Virginia

- New weekly COVID-19 hospital admissions, Jan. 21-Jan. 27, 2024: 7.2 per 100,000 (622 total)
- COVID-19 hospital admissions since Aug. 1, 2020: 1,533.6 per 100,000 (11th lowest)
- COVID-19 deaths since January 2020: 282.7 per 100,000 (10th lowest)
- Current COVID-19 test positivity rate: 6.3% (11th lowest)
12. Pennsylvania

- New weekly COVID-19 hospital admissions, Jan. 21-Jan. 27, 2024: 7.2 per 100,000 (930 total)
- COVID-19 hospital admissions since Aug. 1, 2020: 2,036.2 per 100,000 (24th highest)
- COVID-19 deaths since January 2020: 420.2 per 100,000 (10th highest)
- Current COVID-19 test positivity rate: 6.3% (11th lowest)
11. Louisiana

- New weekly COVID-19 hospital admissions, Jan. 21-Jan. 27, 2024: 7.4 per 100,000 (338 total)
- COVID-19 hospital admissions since Aug. 1, 2020: 2,191.0 per 100,000 (14th highest)
- COVID-19 deaths since January 2020: 392.6 per 100,000 (15th highest)
- Current COVID-19 test positivity rate: 12.0% (3rd highest)
10. Missouri

- New weekly COVID-19 hospital admissions, Jan. 21-Jan. 27, 2024: 7.5 per 100,000 (462 total)
- COVID-19 hospital admissions since Aug. 1, 2020: 2,281.6 per 100,000 (12th highest)
- COVID-19 deaths since January 2020: 376.2 per 100,000 (20th highest)
- Current COVID-19 test positivity rate: 9.1% (22nd highest)
9. Rhode Island

- New weekly COVID-19 hospital admissions, Jan. 21-Jan. 27, 2024: 7.7 per 100,000 (84 total)
- COVID-19 hospital admissions since Aug. 1, 2020: 1,329.8 per 100,000 (5th lowest)
- COVID-19 deaths since January 2020: 374.1 per 100,000 (21st highest)
- Current COVID-19 test positivity rate: 1.1% (6th lowest)
8. South Carolina

- New weekly COVID-19 hospital admissions, Jan. 21-Jan. 27, 2024: 7.7 per 100,000 (408 total)
- COVID-19 hospital admissions since Aug. 1, 2020: 1,916.5 per 100,000 (20th lowest)
- COVID-19 deaths since January 2020: 413.6 per 100,000 (12th highest)
- Current COVID-19 test positivity rate: 10.8% (8th highest)
7. Alabama

- New weekly COVID-19 hospital admissions, Jan. 21-Jan. 27, 2024: 7.8 per 100,000 (398 total)
- COVID-19 hospital admissions since Aug. 1, 2020: 2,474.5 per 100,000 (6th highest)
- COVID-19 deaths since January 2020: 450.9 per 100,000 (6th highest)
- Current COVID-19 test positivity rate: 10.8% (8th highest)
6. Massachusetts

- New weekly COVID-19 hospital admissions, Jan. 21-Jan. 27, 2024: 8.5 per 100,000 (593 total)
- COVID-19 hospital admissions since Aug. 1, 2020: 1,662.4 per 100,000 (13th lowest)
- COVID-19 deaths since January 2020: 311.6 per 100,000 (17th lowest)
- Current COVID-19 test positivity rate: 1.1% (6th lowest)
5. West Virginia

- New weekly COVID-19 hospital admissions, Jan. 21-Jan. 27, 2024: 8.6 per 100,000 (152 total)
- COVID-19 hospital admissions since Aug. 1, 2020: 2,631.3 per 100,000 (5th highest)
- COVID-19 deaths since January 2020: 505.9 per 100,000 (2nd highest)
- Current COVID-19 test positivity rate: 6.3% (11th lowest)
4. Florida

- New weekly COVID-19 hospital admissions, Jan. 21-Jan. 27, 2024: 8.9 per 100,000 (1,988 total)
- COVID-19 hospital admissions since Aug. 1, 2020: 2,684.4 per 100,000 (4th highest)
- COVID-19 deaths since January 2020: 368.7 per 100,000 (24th highest)
- Current COVID-19 test positivity rate: 10.8% (8th highest)
3. New York

- New weekly COVID-19 hospital admissions, Jan. 21-Jan. 27, 2024: 9.5 per 100,000 (1,879 total)
- COVID-19 hospital admissions since Aug. 1, 2020: 2,089.3 per 100,000 (19th highest)
- COVID-19 deaths since January 2020: 423.9 per 100,000 (8th highest)
- Current COVID-19 test positivity rate: 12.9% (the highest)
2. New Jersey

- New weekly COVID-19 hospital admissions, Jan. 21-Jan. 27, 2024: 9.6 per 100,000 (890 total)
- COVID-19 hospital admissions since Aug. 1, 2020: 2,021.6 per 100,000 (25th highest)
- COVID-19 deaths since January 2020: 391.4 per 100,000 (16th highest)
- Current COVID-19 test positivity rate: 12.9% (the highest)
1. Connecticut

- New weekly COVID-19 hospital admissions, Jan. 21-Jan. 27, 2024: 9.8 per 100,000 (357 total)
- COVID-19 hospital admissions since Aug. 1, 2020: 1,951.3 per 100,000 (22nd lowest)
- COVID-19 deaths since January 2020: 350.9 per 100,000 (23rd lowest)
- Current COVID-19 test positivity rate: 1.1% (6th lowest)
