Hospital admissions for COVID-19 reached the highest level in more than 10 months in the most recent reporting period, according to data from the Centers for Disease Control and Prevention. Test positivity rose slightly. As the CDC gets data from periods closer to the Christmas holiday when families gather, the spread of the pandemic will likely accelerate.
To determine the states where the COVID-19 surge is the worst right now, 24/7 Tempo reviewed data on recent COVID-19 hospital admissions from the CDC. States were ranked based on the number of new hospital admissions due to COVID-19 per 100,000 state residents for the week of Dec. 10-16, 2023. Supplemental data on the total number of recorded COVID-19 hospital admissions since Aug. 1, 2020; the total number of deaths due to COVID-19 since January 2020; and the COVID-19 test positivity rate for the week of Dec. 10-16, 2023 also came from the CDC. Population data used to adjust hospital admission and death counts per capita came from the U.S. Census Bureau’s Population and Housing Unit Estimates program and is for July 1, 2022.
The seven-day moving average of hospital admissions across the country rose 10.4% to 25,577 for the reporting period ending Dec. 16 from the previous week. That is the highest weekly total since Feb. 11. Test positivity rose 0.2% to 11.7% for the week ending Dec. 16.
For the fifth straight week, West Virginia had the highest number of new hospital admissions due to COVID-19 per 100,000 state residents, with a rate of 14.3. That was 1.6 percentage points lower than a week prior. The Mountaineer State was one of seven with the highest number of new hospital admissions in the current reporting period that appeared in the previous period. The nine states below West Virginia had hospital admissions rates higher than the corresponding nine states in the previous period.
Alaska again had the lowest hospital admissions rate of any state at 2.9, which was 0.3 percentage point above the previous reporting period. Eight of the 10 lowest states were the same as the previous week and six of them had admissions rates higher than the corresponding lowest rates a week prior.
For at least the sixth straight week, four Midwest/Plains states — Nebraska, Kansas, Missouri, and Iowa — led the nation in test positivity rate. The rate of 18.5 was 1.3 points higher than the prior reporting period. Midwest states fleshed out the remaining 10 states with the test positivity rate of 14.8, almost 1 point higher than the previous period.
Alaska was one of 12 states with the lowest test positivity rate of 7.4. The other states were from the Far West and the South. The low end for test positivity rate the prior period was lower for all 10 states.
Deaths due to COVID-19 rose 3.4% in recent weeks and accounted for 3.0% of all fatalities in the United States for the Dec. 10-16 period, according to the CDC. There have been 1,161,602 total deaths from the pandemic since the onset of the coronavirus in early 2020. (Click here for 30 famous people who died from COVID.)
Here are the states where the COVID-19 surge is the worst right now.
50. Alaska

- New weekly COVID-19 hospital admissions, Dec. 10-16, 2023: 2.9 per 100,000 (21 total)
- COVID-19 hospital admissions since Aug. 1, 2020: 1,372.0 per 100,000 (6th lowest)
- COVID-19 deaths since January 2020: 210.9 per 100,000 (5th lowest)
- Current COVID-19 test positivity rate: 7.4% (12th lowest)
49. Washington

- New weekly COVID-19 hospital admissions, Dec. 10-16, 2023: 3.5 per 100,000 (272 total)
- COVID-19 hospital admissions since Aug. 1, 2020: 1,039.6 per 100,000 (the lowest)
- COVID-19 deaths since January 2020: 198.8 per 100,000 (4th lowest)
- Current COVID-19 test positivity rate: 7.4% (12th lowest)
48. Mississippi
- New weekly COVID-19 hospital admissions, Dec. 10-16, 2023: 4.4 per 100,000 (130 total)
- COVID-19 hospital admissions since Aug. 1, 2020: 1,946.4 per 100,000 (25th highest)
- COVID-19 deaths since January 2020: 513.5 per 100,000 (the highest)
- Current COVID-19 test positivity rate: 7.4% (12th lowest)
47. Louisiana

- New weekly COVID-19 hospital admissions, Dec. 10-16, 2023: 4.5 per 100,000 (205 total)
- COVID-19 hospital admissions since Aug. 1, 2020: 2,144.4 per 100,000 (14th highest)
- COVID-19 deaths since January 2020: 389.9 per 100,000 (14th highest)
- Current COVID-19 test positivity rate: 8.1% (17th lowest)
46. Oregon

- New weekly COVID-19 hospital admissions, Dec. 10-16, 2023: 4.8 per 100,000 (202 total)
- COVID-19 hospital admissions since Aug. 1, 2020: 1,166.9 per 100,000 (4th lowest)
- COVID-19 deaths since January 2020: 226.3 per 100,000 (6th lowest)
- Current COVID-19 test positivity rate: 7.4% (12th lowest)
45. Georgia

- New weekly COVID-19 hospital admissions, Dec. 10-16, 2023: 4.8 per 100,000 (524 total)
- COVID-19 hospital admissions since Aug. 1, 2020: 2,245.5 per 100,000 (9th highest)
- COVID-19 deaths since January 2020: 336.1 per 100,000 (20th lowest)
- Current COVID-19 test positivity rate: 7.4% (12th lowest)
44. South Carolina
- New weekly COVID-19 hospital admissions, Dec. 10-16, 2023: 4.9 per 100,000 (260 total)
- COVID-19 hospital admissions since Aug. 1, 2020: 1,864.6 per 100,000 (20th lowest)
- COVID-19 deaths since January 2020: 409.7 per 100,000 (12th highest)
- Current COVID-19 test positivity rate: 7.4% (12th lowest)
43. Florida

- New weekly COVID-19 hospital admissions, Dec. 10-16, 2023: 5.1 per 100,000 (1,138 total)
- COVID-19 hospital admissions since Aug. 1, 2020: 2,633.2 per 100,000 (4th highest)
- COVID-19 deaths since January 2020: 366.2 per 100,000 (24th highest)
- Current COVID-19 test positivity rate: 7.4% (12th lowest)
42. Hawaii
- New weekly COVID-19 hospital admissions, Dec. 10-16, 2023: 5.1 per 100,000 (74 total)
- COVID-19 hospital admissions since Aug. 1, 2020: 1,449.4 per 100,000 (8th lowest)
- COVID-19 deaths since January 2020: 141.4 per 100,000 (the lowest)
- Current COVID-19 test positivity rate: 10.6% (11th highest)
41. North Carolina

- New weekly COVID-19 hospital admissions, Dec. 10-16, 2023: 5.2 per 100,000 (552 total)
- COVID-19 hospital admissions since Aug. 1, 2020: 1,635.5 per 100,000 (15th lowest)
- COVID-19 deaths since January 2020: 324.0 per 100,000 (18th lowest)
- Current COVID-19 test positivity rate: 7.4% (12th lowest)
40. Texas

- New weekly COVID-19 hospital admissions, Dec. 10-16, 2023: 5.3 per 100,000 (1,606 total)
- COVID-19 hospital admissions since Aug. 1, 2020: 2,086.6 per 100,000 (16th highest)
- COVID-19 deaths since January 2020: 344.4 per 100,000 (21st lowest)
- Current COVID-19 test positivity rate: 8.1% (17th lowest)
39. Nevada

- New weekly COVID-19 hospital admissions, Dec. 10-16, 2023: 5.8 per 100,000 (185 total)
- COVID-19 hospital admissions since Aug. 1, 2020: 2,083.9 per 100,000 (17th highest)
- COVID-19 deaths since January 2020: 380.2 per 100,000 (18th highest)
- Current COVID-19 test positivity rate: 10.6% (11th highest)
38. New Mexico

- New weekly COVID-19 hospital admissions, Dec. 10-16, 2023: 6.1 per 100,000 (128 total)
- COVID-19 hospital admissions since Aug. 1, 2020: 1,900.1 per 100,000 (22nd lowest)
- COVID-19 deaths since January 2020: 449.1 per 100,000 (5th highest)
- Current COVID-19 test positivity rate: 8.1% (17th lowest)
37. Delaware
- New weekly COVID-19 hospital admissions, Dec. 10-16, 2023: 6.2 per 100,000 (63 total)
- COVID-19 hospital admissions since Aug. 1, 2020: 2,051.8 per 100,000 (18th highest)
- COVID-19 deaths since January 2020: 347.0 per 100,000 (24th lowest)
- Current COVID-19 test positivity rate: 9.2% (22nd lowest)
36. Vermont

- New weekly COVID-19 hospital admissions, Dec. 10-16, 2023: 6.3 per 100,000 (41 total)
- COVID-19 hospital admissions since Aug. 1, 2020: 1,055.1 per 100,000 (2nd lowest)
- COVID-19 deaths since January 2020: 168.3 per 100,000 (3rd lowest)
- Current COVID-19 test positivity rate: 10.2% (17th highest)
35. Arizona
- New weekly COVID-19 hospital admissions, Dec. 10-16, 2023: 6.3 per 100,000 (467 total)
- COVID-19 hospital admissions since Aug. 1, 2020: 2,165.9 per 100,000 (13th highest)
- COVID-19 deaths since January 2020: 409.4 per 100,000 (13th highest)
- Current COVID-19 test positivity rate: 10.6% (11th highest)
34. Tennessee

- New weekly COVID-19 hospital admissions, Dec. 10-16, 2023: 6.4 per 100,000 (448 total)
- COVID-19 hospital admissions since Aug. 1, 2020: 1,917.2 per 100,000 (24th lowest)
- COVID-19 deaths since January 2020: 414.5 per 100,000 (11th highest)
- Current COVID-19 test positivity rate: 7.4% (12th lowest)
33. Rhode Island

- New weekly COVID-19 hospital admissions, Dec. 10-16, 2023: 7.0 per 100,000 (77 total)
- COVID-19 hospital admissions since Aug. 1, 2020: 1,271.2 per 100,000 (5th lowest)
- COVID-19 deaths since January 2020: 370.0 per 100,000 (21st highest)
- Current COVID-19 test positivity rate: 10.2% (17th highest)
32. Colorado
- New weekly COVID-19 hospital admissions, Dec. 10-16, 2023: 7.1 per 100,000 (412 total)
- COVID-19 hospital admissions since Aug. 1, 2020: 1,757.7 per 100,000 (18th lowest)
- COVID-19 deaths since January 2020: 262.9 per 100,000 (9th lowest)
- Current COVID-19 test positivity rate: 9.7% (23rd highest)
31. Maryland

- New weekly COVID-19 hospital admissions, Dec. 10-16, 2023: 7.2 per 100,000 (443 total)
- COVID-19 hospital admissions since Aug. 1, 2020: 1,629.1 per 100,000 (14th lowest)
- COVID-19 deaths since January 2020: 301.1 per 100,000 (16th lowest)
- Current COVID-19 test positivity rate: 9.2% (22nd lowest)
30. Wyoming

- New weekly COVID-19 hospital admissions, Dec. 10-16, 2023: 7.2 per 100,000 (42 total)
- COVID-19 hospital admissions since Aug. 1, 2020: 2,043.8 per 100,000 (19th highest)
- COVID-19 deaths since January 2020: 377.7 per 100,000 (19th highest)
- Current COVID-19 test positivity rate: 9.7% (23rd highest)
29. California

- New weekly COVID-19 hospital admissions, Dec. 10-16, 2023: 7.5 per 100,000 (2,924 total)
- COVID-19 hospital admissions since Aug. 1, 2020: 1,637.9 per 100,000 (16th lowest)
- COVID-19 deaths since January 2020: 283.5 per 100,000 (12th lowest)
- Current COVID-19 test positivity rate: 10.6% (11th highest)
28. Virginia

- New weekly COVID-19 hospital admissions, Dec. 10-16, 2023: 7.5 per 100,000 (652 total)
- COVID-19 hospital admissions since Aug. 1, 2020: 1,476.1 per 100,000 (11th lowest)
- COVID-19 deaths since January 2020: 278.0 per 100,000 (10th lowest)
- Current COVID-19 test positivity rate: 9.2% (22nd lowest)
27. New Jersey

- New weekly COVID-19 hospital admissions, Dec. 10-16, 2023: 7.5 per 100,000 (697 total)
- COVID-19 hospital admissions since Aug. 1, 2020: 1,944.5 per 100,000 (25th lowest)
- COVID-19 deaths since January 2020: 386.9 per 100,000 (16th highest)
- Current COVID-19 test positivity rate: 10.6% (11th highest)
26. Minnesota

- New weekly COVID-19 hospital admissions, Dec. 10-16, 2023: 7.5 per 100,000 (431 total)
- COVID-19 hospital admissions since Aug. 1, 2020: 1,455.5 per 100,000 (9th lowest)
- COVID-19 deaths since January 2020: 279.5 per 100,000 (11th lowest)
- Current COVID-19 test positivity rate: 14.8% (5th highest)
25. Utah

- New weekly COVID-19 hospital admissions, Dec. 10-16, 2023: 7.6 per 100,000 (256 total)
- COVID-19 hospital admissions since Aug. 1, 2020: 1,457.0 per 100,000 (10th lowest)
- COVID-19 deaths since January 2020: 166.5 per 100,000 (2nd lowest)
- Current COVID-19 test positivity rate: 9.7% (23rd highest)
24. Alabama
- New weekly COVID-19 hospital admissions, Dec. 10-16, 2023: 7.7 per 100,000 (393 total)
- COVID-19 hospital admissions since Aug. 1, 2020: 2,421.1 per 100,000 (6th highest)
- COVID-19 deaths since January 2020: 446.8 per 100,000 (6th highest)
- Current COVID-19 test positivity rate: 7.4% (12th lowest)
23. Maine

- New weekly COVID-19 hospital admissions, Dec. 10-16, 2023: 7.9 per 100,000 (110 total)
- COVID-19 hospital admissions since Aug. 1, 2020: 1,158.6 per 100,000 (3rd lowest)
- COVID-19 deaths since January 2020: 246.5 per 100,000 (8th lowest)
- Current COVID-19 test positivity rate: 10.2% (17th highest)
22. New Hampshire
- New weekly COVID-19 hospital admissions, Dec. 10-16, 2023: 8.2 per 100,000 (115 total)
- COVID-19 hospital admissions since Aug. 1, 2020: 1,383.4 per 100,000 (7th lowest)
- COVID-19 deaths since January 2020: 243.0 per 100,000 (7th lowest)
- Current COVID-19 test positivity rate: 10.2% (17th highest)
21. Idaho

- New weekly COVID-19 hospital admissions, Dec. 10-16, 2023: 8.3 per 100,000 (161 total)
- COVID-19 hospital admissions since Aug. 1, 2020: 1,510.4 per 100,000 (12th lowest)
- COVID-19 deaths since January 2020: 289.7 per 100,000 (13th lowest)
- Current COVID-19 test positivity rate: 7.4% (12th lowest)
20. Pennsylvania

- New weekly COVID-19 hospital admissions, Dec. 10-16, 2023: 8.6 per 100,000 (1,111 total)
- COVID-19 hospital admissions since Aug. 1, 2020: 1,976.0 per 100,000 (24th highest)
- COVID-19 deaths since January 2020: 414.7 per 100,000 (10th highest)
- Current COVID-19 test positivity rate: 9.2% (22nd lowest)
19. Arkansas

- New weekly COVID-19 hospital admissions, Dec. 10-16, 2023: 9.4 per 100,000 (286 total)
- COVID-19 hospital admissions since Aug. 1, 2020: 2,294.9 per 100,000 (8th highest)
- COVID-19 deaths since January 2020: 418.4 per 100,000 (9th highest)
- Current COVID-19 test positivity rate: 8.1% (17th lowest)
18. Connecticut
- New weekly COVID-19 hospital admissions, Dec. 10-16, 2023: 9.4 per 100,000 (341 total)
- COVID-19 hospital admissions since Aug. 1, 2020: 1,883.6 per 100,000 (21st lowest)
- COVID-19 deaths since January 2020: 346.0 per 100,000 (23rd lowest)
- Current COVID-19 test positivity rate: 10.2% (17th highest)
17. Kansas
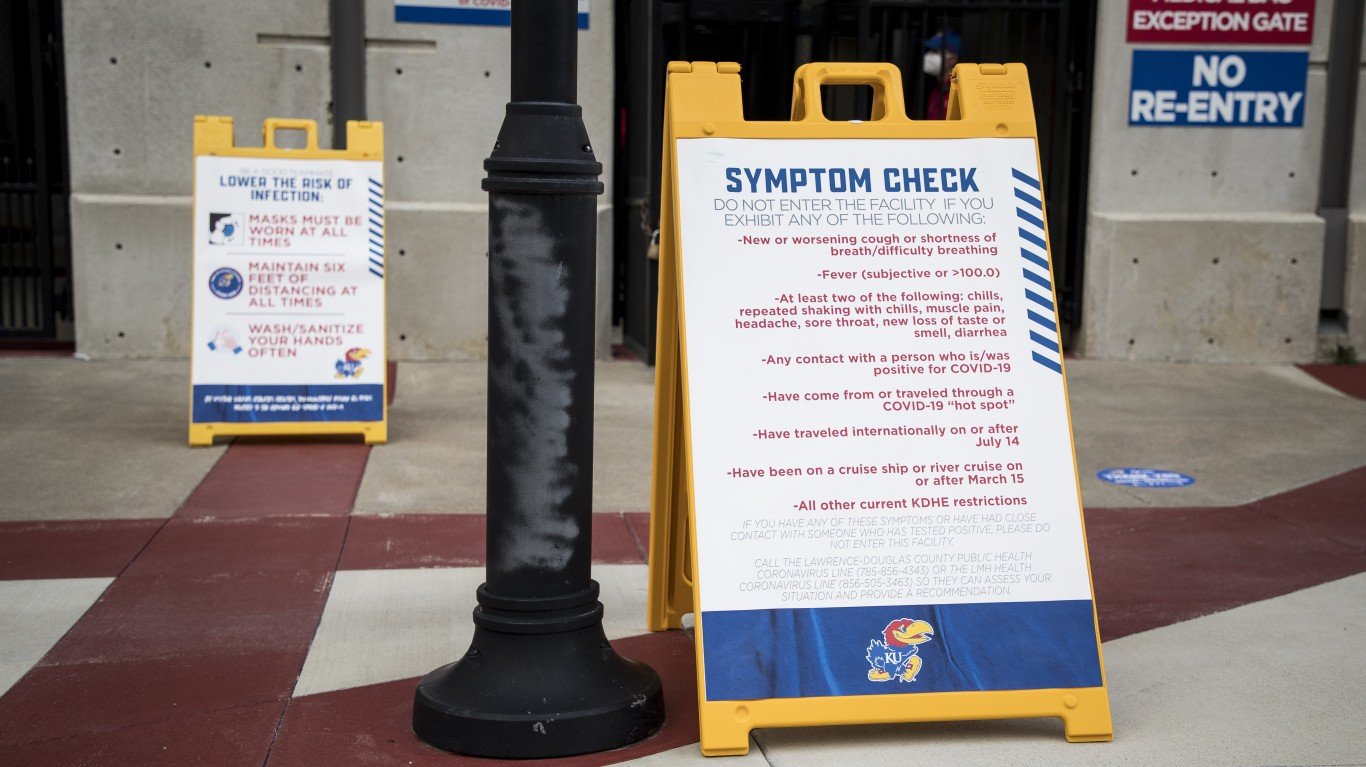
- New weekly COVID-19 hospital admissions, Dec. 10-16, 2023: 9.5 per 100,000 (278 total)
- COVID-19 hospital admissions since Aug. 1, 2020: 2,031.4 per 100,000 (21st highest)
- COVID-19 deaths since January 2020: 367.0 per 100,000 (23rd highest)
- Current COVID-19 test positivity rate: 18.5% (the highest)
16. Kentucky

- New weekly COVID-19 hospital admissions, Dec. 10-16, 2023: 9.7 per 100,000 (437 total)
- COVID-19 hospital admissions since Aug. 1, 2020: 3,555.4 per 100,000 (the highest)
- COVID-19 deaths since January 2020: 453.8 per 100,000 (4th highest)
- Current COVID-19 test positivity rate: 7.4% (12th lowest)
15. Michigan

- New weekly COVID-19 hospital admissions, Dec. 10-16, 2023: 9.8 per 100,000 (980 total)
- COVID-19 hospital admissions since Aug. 1, 2020: 2,008.4 per 100,000 (23rd highest)
- COVID-19 deaths since January 2020: 382.0 per 100,000 (17th highest)
- Current COVID-19 test positivity rate: 14.8% (5th highest)
14. New York

- New weekly COVID-19 hospital admissions, Dec. 10-16, 2023: 9.8 per 100,000 (1,927 total)
- COVID-19 hospital admissions since Aug. 1, 2020: 2,012.3 per 100,000 (22nd highest)
- COVID-19 deaths since January 2020: 419.2 per 100,000 (8th highest)
- Current COVID-19 test positivity rate: 10.6% (11th highest)
13. North Dakota
- New weekly COVID-19 hospital admissions, Dec. 10-16, 2023: 9.9 per 100,000 (77 total)
- COVID-19 hospital admissions since Aug. 1, 2020: 2,035.1 per 100,000 (20th highest)
- COVID-19 deaths since January 2020: 344.8 per 100,000 (22nd lowest)
- Current COVID-19 test positivity rate: 9.7% (23rd highest)
12. Illinois

- New weekly COVID-19 hospital admissions, Dec. 10-16, 2023: 10.0 per 100,000 (1,261 total)
- COVID-19 hospital admissions since Aug. 1, 2020: 1,912.5 per 100,000 (23rd lowest)
- COVID-19 deaths since January 2020: 326.6 per 100,000 (19th lowest)
- Current COVID-19 test positivity rate: 14.8% (5th highest)
11. Massachusetts

- New weekly COVID-19 hospital admissions, Dec. 10-16, 2023: 10.1 per 100,000 (703 total)
- COVID-19 hospital admissions since Aug. 1, 2020: 1,588.8 per 100,000 (13th lowest)
- COVID-19 deaths since January 2020: 307.3 per 100,000 (17th lowest)
- Current COVID-19 test positivity rate: 10.2% (17th highest)
10. Wisconsin

- New weekly COVID-19 hospital admissions, Dec. 10-16, 2023: 10.2 per 100,000 (599 total)
- COVID-19 hospital admissions since Aug. 1, 2020: 2,241.5 per 100,000 (10th highest)
- COVID-19 deaths since January 2020: 296.8 per 100,000 (14th lowest)
- Current COVID-19 test positivity rate: 14.8% (5th highest)
9. Oklahoma
- New weekly COVID-19 hospital admissions, Dec. 10-16, 2023: 10.3 per 100,000 (413 total)
- COVID-19 hospital admissions since Aug. 1, 2020: 2,813.8 per 100,000 (2nd highest)
- COVID-19 deaths since January 2020: 494.1 per 100,000 (3rd highest)
- Current COVID-19 test positivity rate: 8.1% (17th lowest)
8. Montana

- New weekly COVID-19 hospital admissions, Dec. 10-16, 2023: 10.3 per 100,000 (116 total)
- COVID-19 hospital admissions since Aug. 1, 2020: 2,796.3 per 100,000 (3rd highest)
- COVID-19 deaths since January 2020: 352.3 per 100,000 (25th lowest)
- Current COVID-19 test positivity rate: 9.7% (23rd highest)
7. Ohio

- New weekly COVID-19 hospital admissions, Dec. 10-16, 2023: 11.4 per 100,000 (1,335 total)
- COVID-19 hospital admissions since Aug. 1, 2020: 2,314.8 per 100,000 (7th highest)
- COVID-19 deaths since January 2020: 430.5 per 100,000 (7th highest)
- Current COVID-19 test positivity rate: 14.8% (5th highest)
6. Missouri

- New weekly COVID-19 hospital admissions, Dec. 10-16, 2023: 11.5 per 100,000 (712 total)
- COVID-19 hospital admissions since Aug. 1, 2020: 2,215.1 per 100,000 (12th highest)
- COVID-19 deaths since January 2020: 371.4 per 100,000 (20th highest)
- Current COVID-19 test positivity rate: 18.5% (the highest)
5. Nebraska
- New weekly COVID-19 hospital admissions, Dec. 10-16, 2023: 11.7 per 100,000 (231 total)
- COVID-19 hospital admissions since Aug. 1, 2020: 1,693.8 per 100,000 (17th lowest)
- COVID-19 deaths since January 2020: 298.4 per 100,000 (15th lowest)
- Current COVID-19 test positivity rate: 18.5% (the highest)
4. Indiana
- New weekly COVID-19 hospital admissions, Dec. 10-16, 2023: 12.3 per 100,000 (839 total)
- COVID-19 hospital admissions since Aug. 1, 2020: 2,123.4 per 100,000 (15th highest)
- COVID-19 deaths since January 2020: 387.2 per 100,000 (15th highest)
- Current COVID-19 test positivity rate: 14.8% (5th highest)
3. Iowa
- New weekly COVID-19 hospital admissions, Dec. 10-16, 2023: 12.7 per 100,000 (405 total)
- COVID-19 hospital admissions since Aug. 1, 2020: 1,783.7 per 100,000 (19th lowest)
- COVID-19 deaths since January 2020: 354.5 per 100,000 (25th highest)
- Current COVID-19 test positivity rate: 18.5% (the highest)
2. South Dakota

- New weekly COVID-19 hospital admissions, Dec. 10-16, 2023: 14.0 per 100,000 (127 total)
- COVID-19 hospital admissions since Aug. 1, 2020: 2,234.5 per 100,000 (11th highest)
- COVID-19 deaths since January 2020: 367.4 per 100,000 (22nd highest)
- Current COVID-19 test positivity rate: 9.7% (23rd highest)
1. West Virginia

- New weekly COVID-19 hospital admissions, Dec. 10-16, 2023: 14.3 per 100,000 (254 total)
- COVID-19 hospital admissions since Aug. 1, 2020: 2,542.0 per 100,000 (5th highest)
- COVID-19 deaths since January 2020: 498.7 per 100,000 (2nd highest)
- Current COVID-19 test positivity rate: 9.2% (22nd lowest)


