The CDC is closely tracking a new COVID-19 variant called JN.1 that has been claiming a larger share of infections. The agency estimated that the variant could account for up to 29% of infections nationwide, up from 8.8% at the end of November.
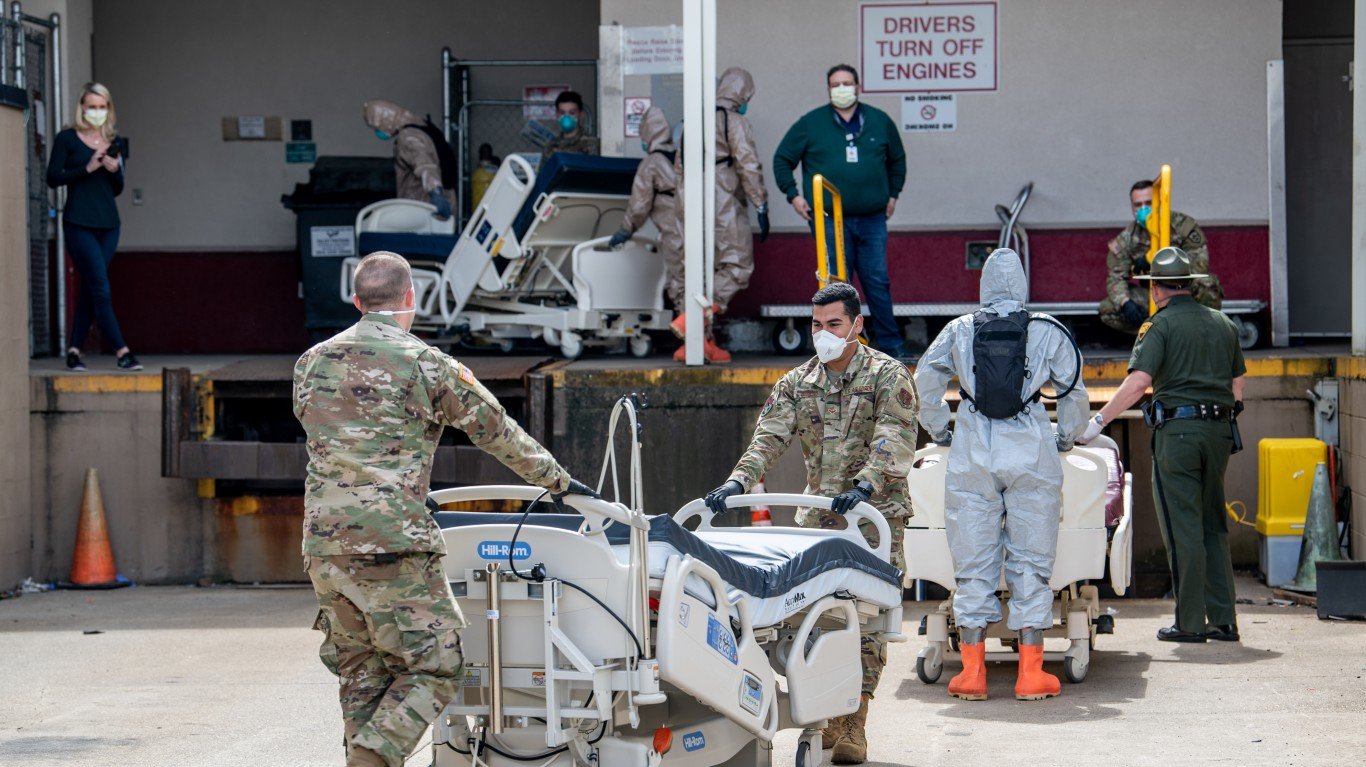
Hospital admissions for COVID-19 reached the highest level in nearly 10 months in the most recent reporting period, according to data from the Centers for Disease Control and Prevention. Test positivity declined slightly. Christmas is near and with it the fear that family gatherings will contribute to the spread of the pandemic. (Click here for 30 famous people who died from COVID.)
To determine the states where the COVID-19 surge is the worst right now, 24/7 Tempo reviewed data on recent COVID-19 hospital admissions from the CDC. States were ranked based on the number of new hospital admissions due to COVID-19 per 100,000 state residents for the week of Dec. 3-9, 2023. Supplemental data on the total number of recorded COVID-19 hospital admissions since Aug. 1, 2020; the total number of deaths due to COVID-19 since January 2020; and the COVID-19 test positivity rate for the week of Dec. 3-9, 2023 also came from the CDC. Population data used to adjust hospital admission and death counts per capita came from the U.S. Census Bureau’s Population and Housing Unit Estimates program and is for July 1, 2022.
The seven-day moving average of hospital admissions across the country rose 3.1% to 23,432 for the reporting period ending Dec. 9 from the previous week, the highest weekly total since Feb. 25. Test positivity slipped 0.4% to 11.0% for the week ending Dec. 9.
For the fourth straight week, West Virginia had the highest number of new hospital admissions due to COVID-19 per 100,000 state residents, with a rate of 15.9. That was 1.6 percentage points lower than a week prior. The Mountaineer State was one of six states with the highest number of new hospital admissions in the current reporting period that appeared in the previous period.
Alaska once again had the lowest hospital admissions rate of any state at 2.6, which was 0.5 percentage point below the previous reporting period. Nine of the 10 lowest states were the same as the previous week, though admissions rates in six states were higher than the prior reporting period.
For at least the fifth straight week, four Midwest/Plains states — Nebraska, Kansas, Missouri, and Iowa — led the nation in test positivity rate. The rate of 17.2 was 0.5 point higher than the prior reporting period. Other Midwest states filled out the 10 states with the highest test positivity rate, which was 1 point lower than the previous period.
New York and New Jersey had the lowest test positivity rate for the week ending Dec. 9 at 6.8, which was 0.7 higher than Kentucky, the state with lowest rate a week prior. Western and southern states populated the rest of the lowest states for test positivity.
The CDC reports that infection rates for COVID-19 as well as for influenza and respiratory syncytial virus (RSV) are below last year’s level. The agency said illnesses have started later, suggesting that we have not reached peak respiratory illness levels.
There has been a steep rise in COVID-19 cases at nursing homes, particularly in the Midwest, according to the agency.
50. Alaska
- New weekly COVID-19 hospital admissions, Dec. 3-9, 2023: 2.6 per 100,000 (19 total)
- COVID-19 hospital admissions since Aug. 1, 2020: 1,369.2 per 100,000 (6th lowest)
- COVID-19 deaths since January 2020: 210.9 per 100,000 (5th lowest)
- Current COVID-19 test positivity rate: 8.0% (23rd lowest)
49. Georgia

- New weekly COVID-19 hospital admissions, Dec. 3-9, 2023: 3.3 per 100,000 (356 total)
- COVID-19 hospital admissions since Aug. 1, 2020: 2,241.1 per 100,000 (9th highest)
- COVID-19 deaths since January 2020: 335.9 per 100,000 (20th lowest)
- Current COVID-19 test positivity rate: 7.1% (14th lowest)
48. Washington

- New weekly COVID-19 hospital admissions, Dec. 3-9, 2023: 3.9 per 100,000 (301 total)
- COVID-19 hospital admissions since Aug. 1, 2020: 1,036.1 per 100,000 (the lowest)
- COVID-19 deaths since January 2020: 198.5 per 100,000 (4th lowest)
- Current COVID-19 test positivity rate: 8.0% (23rd lowest)
47. Florida

- New weekly COVID-19 hospital admissions, Dec. 3-9, 2023: 3.9 per 100,000 (863 total)
- COVID-19 hospital admissions since Aug. 1, 2020: 2,628.0 per 100,000 (4th highest)
- COVID-19 deaths since January 2020: 365.8 per 100,000 (23rd highest)
- Current COVID-19 test positivity rate: 7.1% (14th lowest)
46. Louisiana

- New weekly COVID-19 hospital admissions, Dec. 3-9, 2023: 4.0 per 100,000 (185 total)
- COVID-19 hospital admissions since Aug. 1, 2020: 2,140.0 per 100,000 (14th highest)
- COVID-19 deaths since January 2020: 389.4 per 100,000 (14th highest)
- Current COVID-19 test positivity rate: 7.4% (19th lowest)
45. Mississippi

- New weekly COVID-19 hospital admissions, Dec. 3-9, 2023: 4.1 per 100,000 (122 total)
- COVID-19 hospital admissions since Aug. 1, 2020: 1,941.7 per 100,000 (25th highest)
- COVID-19 deaths since January 2020: 512.8 per 100,000 (the highest)
- Current COVID-19 test positivity rate: 7.1% (14th lowest)
44. South Carolina

Charleston, South Carolina, USA in the French Quarter.
- New weekly COVID-19 hospital admissions, Dec. 3-9, 2023: 4.6 per 100,000 (241 total)
- COVID-19 hospital admissions since Aug. 1, 2020: 1,859.6 per 100,000 (20th lowest)
- COVID-19 deaths since January 2020: 409.3 per 100,000 (12th highest)
- Current COVID-19 test positivity rate: 7.1% (14th lowest)
43. Rhode Island

- New weekly COVID-19 hospital admissions, Dec. 3-9, 2023: 4.7 per 100,000 (51 total)
- COVID-19 hospital admissions since Aug. 1, 2020: 1,264.2 per 100,000 (5th lowest)
- COVID-19 deaths since January 2020: 369.7 per 100,000 (21st highest)
- Current COVID-19 test positivity rate: 10.6% (16th highest)
42. Texas

- New weekly COVID-19 hospital admissions, Dec. 3-9, 2023: 4.7 per 100,000 (1,412 total)
- COVID-19 hospital admissions since Aug. 1, 2020: 2,081.7 per 100,000 (16th highest)
- COVID-19 deaths since January 2020: 344.2 per 100,000 (22nd lowest)
- Current COVID-19 test positivity rate: 7.4% (19th lowest)
41. Oregon

- New weekly COVID-19 hospital admissions, Dec. 3-9, 2023: 4.8 per 100,000 (203 total)
- COVID-19 hospital admissions since Aug. 1, 2020: 1,162.1 per 100,000 (4th lowest)
- COVID-19 deaths since January 2020: 225.8 per 100,000 (6th lowest)
- Current COVID-19 test positivity rate: 8.0% (23rd lowest)
40. Tennessee

- New weekly COVID-19 hospital admissions, Dec. 3-9, 2023: 5.1 per 100,000 (359 total)
- COVID-19 hospital admissions since Aug. 1, 2020: 1,910.4 per 100,000 (24th lowest)
- COVID-19 deaths since January 2020: 413.9 per 100,000 (11th highest)
- Current COVID-19 test positivity rate: 7.1% (14th lowest)
39. North Carolina
- New weekly COVID-19 hospital admissions, Dec. 3-9, 2023: 5.2 per 100,000 (553 total)
- COVID-19 hospital admissions since Aug. 1, 2020: 1,630.3 per 100,000 (16th lowest)
- COVID-19 deaths since January 2020: 323.6 per 100,000 (18th lowest)
- Current COVID-19 test positivity rate: 7.1% (14th lowest)
38. New Mexico

- New weekly COVID-19 hospital admissions, Dec. 3-9, 2023: 5.3 per 100,000 (113 total)
- COVID-19 hospital admissions since Aug. 1, 2020: 1,894.1 per 100,000 (22nd lowest)
- COVID-19 deaths since January 2020: 448.7 per 100,000 (5th highest)
- Current COVID-19 test positivity rate: 7.4% (19th lowest)
37. Arizona

- New weekly COVID-19 hospital admissions, Dec. 3-9, 2023: 5.8 per 100,000 (427 total)
- COVID-19 hospital admissions since Aug. 1, 2020: 2,159.2 per 100,000 (13th highest)
- COVID-19 deaths since January 2020: 408.8 per 100,000 (13th highest)
- Current COVID-19 test positivity rate: 6.9% (6th lowest)
36. Hawaii
- New weekly COVID-19 hospital admissions, Dec. 3-9, 2023: 5.8 per 100,000 (84 total)
- COVID-19 hospital admissions since Aug. 1, 2020: 1,444.0 per 100,000 (8th lowest)
- COVID-19 deaths since January 2020: 141.3 per 100,000 (the lowest)
- Current COVID-19 test positivity rate: 6.9% (6th lowest)
35. Nevada

- New weekly COVID-19 hospital admissions, Dec. 3-9, 2023: 6.1 per 100,000 (193 total)
- COVID-19 hospital admissions since Aug. 1, 2020: 2,078.1 per 100,000 (17th highest)
- COVID-19 deaths since January 2020: 379.4 per 100,000 (18th highest)
- Current COVID-19 test positivity rate: 6.9% (6th lowest)
34. California

- New weekly COVID-19 hospital admissions, Dec. 3-9, 2023: 6.3 per 100,000 (2,449 total)
- COVID-19 hospital admissions since Aug. 1, 2020: 1,629.8 per 100,000 (15th lowest)
- COVID-19 deaths since January 2020: 283.1 per 100,000 (12th lowest)
- Current COVID-19 test positivity rate: 6.9% (6th lowest)
33. Delaware
- New weekly COVID-19 hospital admissions, Dec. 3-9, 2023: 6.3 per 100,000 (64 total)
- COVID-19 hospital admissions since Aug. 1, 2020: 2,045.6 per 100,000 (18th highest)
- COVID-19 deaths since January 2020: 345.7 per 100,000 (23rd lowest)
- Current COVID-19 test positivity rate: 10.7% (11th highest)
32. Alabama
- New weekly COVID-19 hospital admissions, Dec. 3-9, 2023: 6.3 per 100,000 (320 total)
- COVID-19 hospital admissions since Aug. 1, 2020: 2,413.1 per 100,000 (6th highest)
- COVID-19 deaths since January 2020: 446.2 per 100,000 (6th highest)
- Current COVID-19 test positivity rate: 7.1% (14th lowest)
31. Virginia

- New weekly COVID-19 hospital admissions, Dec. 3-9, 2023: 6.6 per 100,000 (573 total)
- COVID-19 hospital admissions since Aug. 1, 2020: 1,468.2 per 100,000 (11th lowest)
- COVID-19 deaths since January 2020: 277.5 per 100,000 (10th lowest)
- Current COVID-19 test positivity rate: 10.7% (11th highest)
30. New Jersey

- New weekly COVID-19 hospital admissions, Dec. 3-9, 2023: 6.7 per 100,000 (623 total)
- COVID-19 hospital admissions since Aug. 1, 2020: 1,936.8 per 100,000 (25th lowest)
- COVID-19 deaths since January 2020: 386.4 per 100,000 (15th highest)
- Current COVID-19 test positivity rate: 6.8% (2nd lowest)
29. Utah

- New weekly COVID-19 hospital admissions, Dec. 3-9, 2023: 6.9 per 100,000 (232 total)
- COVID-19 hospital admissions since Aug. 1, 2020: 1,450.1 per 100,000 (10th lowest)
- COVID-19 deaths since January 2020: 166.2 per 100,000 (2nd lowest)
- Current COVID-19 test positivity rate: 10.4% (22nd highest)
28. New Hampshire

- New weekly COVID-19 hospital admissions, Dec. 3-9, 2023: 7.0 per 100,000 (97 total)
- COVID-19 hospital admissions since Aug. 1, 2020: 1,375.4 per 100,000 (7th lowest)
- COVID-19 deaths since January 2020: 242.3 per 100,000 (7th lowest)
- Current COVID-19 test positivity rate: 10.6% (16th highest)
27. Maryland

- New weekly COVID-19 hospital admissions, Dec. 3-9, 2023: 7.0 per 100,000 (432 total)
- COVID-19 hospital admissions since Aug. 1, 2020: 1,621.9 per 100,000 (14th lowest)
- COVID-19 deaths since January 2020: 300.4 per 100,000 (16th lowest)
- Current COVID-19 test positivity rate: 10.7% (11th highest)
26. Vermont

- New weekly COVID-19 hospital admissions, Dec. 3-9, 2023: 7.1 per 100,000 (46 total)
- COVID-19 hospital admissions since Aug. 1, 2020: 1,048.6 per 100,000 (2nd lowest)
- COVID-19 deaths since January 2020: 168.1 per 100,000 (3rd lowest)
- Current COVID-19 test positivity rate: 10.6% (16th highest)
25. Minnesota

- New weekly COVID-19 hospital admissions, Dec. 3-9, 2023: 7.9 per 100,000 (449 total)
- COVID-19 hospital admissions since Aug. 1, 2020: 1,448.0 per 100,000 (9th lowest)
- COVID-19 deaths since January 2020: 278.8 per 100,000 (11th lowest)
- Current COVID-19 test positivity rate: 13.9% (5th highest)
24. Colorado
- New weekly COVID-19 hospital admissions, Dec. 3-9, 2023: 8.0 per 100,000 (467 total)
- COVID-19 hospital admissions since Aug. 1, 2020: 1,750.6 per 100,000 (18th lowest)
- COVID-19 deaths since January 2020: 262.3 per 100,000 (9th lowest)
- Current COVID-19 test positivity rate: 10.4% (22nd highest)
23. Idaho
- New weekly COVID-19 hospital admissions, Dec. 3-9, 2023: 8.5 per 100,000 (164 total)
- COVID-19 hospital admissions since Aug. 1, 2020: 1,502.1 per 100,000 (12th lowest)
- COVID-19 deaths since January 2020: 289.4 per 100,000 (13th lowest)
- Current COVID-19 test positivity rate: 8.0% (23rd lowest)
22. Arkansas
- New weekly COVID-19 hospital admissions, Dec. 3-9, 2023: 8.5 per 100,000 (259 total)
- COVID-19 hospital admissions since Aug. 1, 2020: 2,286.1 per 100,000 (8th highest)
- COVID-19 deaths since January 2020: 417.9 per 100,000 (9th highest)
- Current COVID-19 test positivity rate: 7.4% (19th lowest)
21. Maine

- New weekly COVID-19 hospital admissions, Dec. 3-9, 2023: 8.5 per 100,000 (118 total)
- COVID-19 hospital admissions since Aug. 1, 2020: 1,150.8 per 100,000 (3rd lowest)
- COVID-19 deaths since January 2020: 246.0 per 100,000 (8th lowest)
- Current COVID-19 test positivity rate: 10.6% (16th highest)
20. Massachusetts

- New weekly COVID-19 hospital admissions, Dec. 3-9, 2023: 8.6 per 100,000 (598 total)
- COVID-19 hospital admissions since Aug. 1, 2020: 1,578.7 per 100,000 (13th lowest)
- COVID-19 deaths since January 2020: 306.7 per 100,000 (17th lowest)
- Current COVID-19 test positivity rate: 10.6% (16th highest)
19. Pennsylvania

- New weekly COVID-19 hospital admissions, Dec. 3-9, 2023: 8.6 per 100,000 (1,120 total)
- COVID-19 hospital admissions since Aug. 1, 2020: 1,967.9 per 100,000 (24th highest)
- COVID-19 deaths since January 2020: 414.0 per 100,000 (10th highest)
- Current COVID-19 test positivity rate: 10.7% (11th highest)
18. New York

- New weekly COVID-19 hospital admissions, Dec. 3-9, 2023: 8.7 per 100,000 (1,717 total)
- COVID-19 hospital admissions since Aug. 1, 2020: 2,002.8 per 100,000 (22nd highest)
- COVID-19 deaths since January 2020: 418.7 per 100,000 (8th highest)
- Current COVID-19 test positivity rate: 6.8% (2nd lowest)
17. Connecticut

- New weekly COVID-19 hospital admissions, Dec. 3-9, 2023: 9.1 per 100,000 (329 total)
- COVID-19 hospital admissions since Aug. 1, 2020: 1,874.2 per 100,000 (21st lowest)
- COVID-19 deaths since January 2020: 345.8 per 100,000 (24th lowest)
- Current COVID-19 test positivity rate: 10.6% (16th highest)
16. North Dakota
- New weekly COVID-19 hospital admissions, Dec. 3-9, 2023: 9.2 per 100,000 (72 total)
- COVID-19 hospital admissions since Aug. 1, 2020: 2,022.3 per 100,000 (20th highest)
- COVID-19 deaths since January 2020: 343.7 per 100,000 (21st lowest)
- Current COVID-19 test positivity rate: 10.4% (22nd highest)
15. Oklahoma
- New weekly COVID-19 hospital admissions, Dec. 3-9, 2023: 9.3 per 100,000 (375 total)
- COVID-19 hospital admissions since Aug. 1, 2020: 2,803.6 per 100,000 (2nd highest)
- COVID-19 deaths since January 2020: 493.2 per 100,000 (3rd highest)
- Current COVID-19 test positivity rate: 7.4% (19th lowest)
14. Kansas
- New weekly COVID-19 hospital admissions, Dec. 3-9, 2023: 9.4 per 100,000 (276 total)
- COVID-19 hospital admissions since Aug. 1, 2020: 2,022.2 per 100,000 (21st highest)
- COVID-19 deaths since January 2020: 366.2 per 100,000 (22nd highest)
- Current COVID-19 test positivity rate: 17.2% (the highest)
13. Wisconsin

- New weekly COVID-19 hospital admissions, Dec. 3-9, 2023: 9.4 per 100,000 (556 total)
- COVID-19 hospital admissions since Aug. 1, 2020: 2,231.5 per 100,000 (10th highest)
- COVID-19 deaths since January 2020: 296.1 per 100,000 (14th lowest)
- Current COVID-19 test positivity rate: 13.9% (5th highest)
12. Michigan
- New weekly COVID-19 hospital admissions, Dec. 3-9, 2023: 9.8 per 100,000 (980 total)
- COVID-19 hospital admissions since Aug. 1, 2020: 1,999.0 per 100,000 (23rd highest)
- COVID-19 deaths since January 2020: 381.9 per 100,000 (17th highest)
- Current COVID-19 test positivity rate: 13.9% (5th highest)
11. Ohio

- New weekly COVID-19 hospital admissions, Dec. 3-9, 2023: 9.9 per 100,000 (1,165 total)
- COVID-19 hospital admissions since Aug. 1, 2020: 2,302.7 per 100,000 (7th highest)
- COVID-19 deaths since January 2020: 429.8 per 100,000 (7th highest)
- Current COVID-19 test positivity rate: 13.9% (5th highest)
10. Illinois

- New weekly COVID-19 hospital admissions, Dec. 3-9, 2023: 9.9 per 100,000 (1,251 total)
- COVID-19 hospital admissions since Aug. 1, 2020: 1,902.6 per 100,000 (23rd lowest)
- COVID-19 deaths since January 2020: 325.8 per 100,000 (19th lowest)
- Current COVID-19 test positivity rate: 13.9% (5th highest)
9. Montana

- New weekly COVID-19 hospital admissions, Dec. 3-9, 2023: 10.2 per 100,000 (114 total)
- COVID-19 hospital admissions since Aug. 1, 2020: 2,786.5 per 100,000 (3rd highest)
- COVID-19 deaths since January 2020: 351.4 per 100,000 (25th lowest)
- Current COVID-19 test positivity rate: 10.4% (22nd highest)
8. Nebraska
- New weekly COVID-19 hospital admissions, Dec. 3-9, 2023: 10.6 per 100,000 (208 total)
- COVID-19 hospital admissions since Aug. 1, 2020: 1,682.9 per 100,000 (17th lowest)
- COVID-19 deaths since January 2020: 297.9 per 100,000 (15th lowest)
- Current COVID-19 test positivity rate: 17.2% (the highest)
7. Kentucky

- New weekly COVID-19 hospital admissions, Dec. 3-9, 2023: 10.6 per 100,000 (479 total)
- COVID-19 hospital admissions since Aug. 1, 2020: 3,545.6 per 100,000 (the highest)
- COVID-19 deaths since January 2020: 452.5 per 100,000 (4th highest)
- Current COVID-19 test positivity rate: 7.1% (14th lowest)
6. Iowa
- New weekly COVID-19 hospital admissions, Dec. 3-9, 2023: 10.8 per 100,000 (345 total)
- COVID-19 hospital admissions since Aug. 1, 2020: 1,771.0 per 100,000 (19th lowest)
- COVID-19 deaths since January 2020: 353.7 per 100,000 (25th highest)
- Current COVID-19 test positivity rate: 17.2% (the highest)
5. Wyoming

- New weekly COVID-19 hospital admissions, Dec. 3-9, 2023: 11.0 per 100,000 (64 total)
- COVID-19 hospital admissions since Aug. 1, 2020: 2,039.5 per 100,000 (19th highest)
- COVID-19 deaths since January 2020: 376.2 per 100,000 (19th highest)
- Current COVID-19 test positivity rate: 10.4% (22nd highest)
4. South Dakota

- New weekly COVID-19 hospital admissions, Dec. 3-9, 2023: 11.3 per 100,000 (103 total)
- COVID-19 hospital admissions since Aug. 1, 2020: 2,220.3 per 100,000 (11th highest)
- COVID-19 deaths since January 2020: 365.8 per 100,000 (24th highest)
- Current COVID-19 test positivity rate: 10.4% (22nd highest)
3. Missouri

- New weekly COVID-19 hospital admissions, Dec. 3-9, 2023: 11.4 per 100,000 (703 total)
- COVID-19 hospital admissions since Aug. 1, 2020: 2,203.9 per 100,000 (12th highest)
- COVID-19 deaths since January 2020: 370.6 per 100,000 (20th highest)
- Current COVID-19 test positivity rate: 17.2% (the highest)
2. Indiana

- New weekly COVID-19 hospital admissions, Dec. 3-9, 2023: 11.7 per 100,000 (802 total)
- COVID-19 hospital admissions since Aug. 1, 2020: 2,112.3 per 100,000 (15th highest)
- COVID-19 deaths since January 2020: 386.2 per 100,000 (16th highest)
- Current COVID-19 test positivity rate: 13.9% (5th highest)
1. West Virginia
- New weekly COVID-19 hospital admissions, Dec. 3-9, 2023: 15.9 per 100,000 (283 total)
- COVID-19 hospital admissions since Aug. 1, 2020: 2,528.0 per 100,000 (5th highest)
- COVID-19 deaths since January 2020: 497.4 per 100,000 (2nd highest)
- Current COVID-19 test positivity rate: 10.7% (11th highest)

