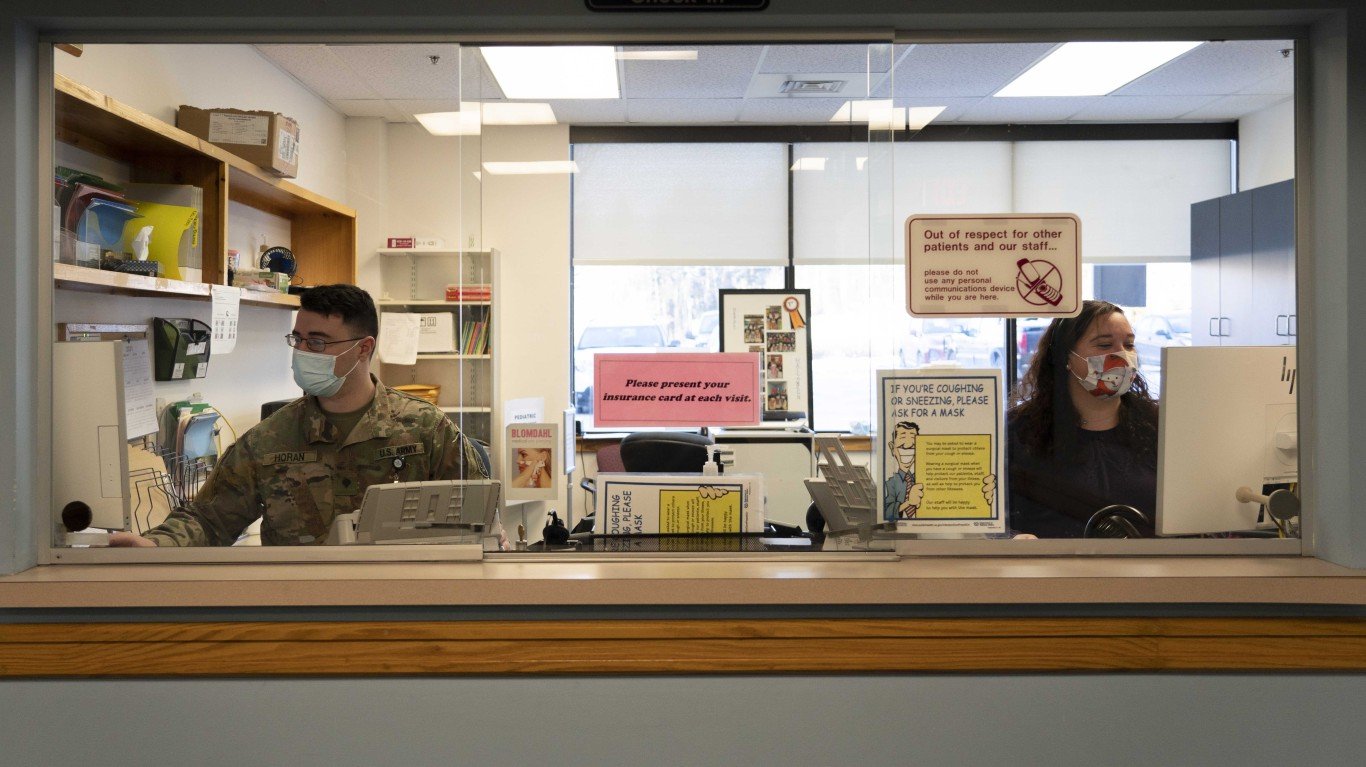
One traveler in a thousand, at the most, wears a mask these days in a crowded airport. Restaurants bustle with diners packed into tables like sardines, maskless. Hospitals now post signs by the entrance informing patients and visitors alike that masks are welcomed and perhaps recommended, but no longer required. Clearly, COVID-19 is over.
In our dreams.
It’s well-known that cases of COVID, as with other respiratory diseases, tend to peak in the winter months, when we live more of our lives indoors and are more likely to spend time with groups of friends and family for the year-end holidays. Still, comparing COVID-19 hospital admissions this December with those last summer paints a sobering picture.
To determine the states where the COVID-19 surge is the worst, 24/7 Tempo consulted data from the Centers for Disease Control and Prevention on the number of new hospital admissions due to COVID-19 per 100,000 state residents for the week of Dec. 17-Dec. 22, 2023.
Reviewing data from the same source for the week ending August 13, 2023 tells a sobering story. The state with the lowest number of hospital admissions for COVID that week was North Dakota, with a rate of 1.5 per 100,000 residents. By mid-December, six other states had lower rates, and North Dakota registered 6.9 per 100,000. (Click here to see the states where the COVID-19 surge was worst in mid-August.)
And in the case of our two most populous states, California – which, along with Oregon, has just issued a formal statement overriding the CDC’s COVID isolation guidelines – had 5.9 admissions per 100,000 in August, but 8.8 in mid-December; and New York (site of many of the aforementioned crowded restaurants), meanwhile, which had the eighth most admissions for that period, with 5.4 per 100,000, has seen its rate skyrocket to 15.6.
As the saying goes, we might be finished with COVID but COVID isn’t finished with us. (Click here for 30 famous people who died from COVID.)
Methodology
To determine the states where the COVID-19 surge is the worst right now, 24/7 Tempo reviewed data on recent COVID-19 hospital admissions from the Centers for Disease Control and Prevention. States were ranked based on the number of new hospital admissions due to COVID-19 per 100,000 state residents for the week of Dec. 17-Dec. 22, 2023. Supplemental data on the total number of recorded COVID-19 hospital admissions since Aug. 1, 2020; the total number of deaths due to COVID-19 since January 2020; and the COVID-19 test positivity rate for the week of Dec. 17-Dec. 22, 2023 also came from the CDC. It should be noted that this metric is widely considered to be inaccurate today, due to the closing down of many official testing centers and the fact that the results of home tests are rarely reported. Population data used to adjust hospital admission and death counts per capita came from the U.S. Census Bureau’s Population and Housing Unit Estimates program and is for July 1, 2022.
Scroll down for the states where the COVID-19 surge is the worst, according to data:
50. New Mexico

- New weekly COVID-19 hospital admissions, Dec. 17-Dec. 22, 2023: 2.4 per 100,000 (50 total)
- COVID-19 hospital admissions since Aug. 1, 2020: 1,920.1 per 100,000 (21st lowest)
- COVID-19 deaths since January 2020: 451.9 per 100,000 (5th highest)
- Current COVID-19 test positivity rate: 10.4% (24th highest)
49. Washington

- New weekly COVID-19 hospital admissions, Dec. 17-Dec. 22, 2023: 4.6 per 100,000 (356 total)
- COVID-19 hospital admissions since Aug. 1, 2020: 1,058.4 per 100,000 (the lowest)
- COVID-19 deaths since January 2020: 200.5 per 100,000 (4th lowest)
- Current COVID-19 test positivity rate: 10.2% (22nd lowest)
48. Utah

- New weekly COVID-19 hospital admissions, Dec. 17-Dec. 22, 2023: 5.2 per 100,000 (177 total)
- COVID-19 hospital admissions since Aug. 1, 2020: 1,482.2 per 100,000 (9th lowest)
- COVID-19 deaths since January 2020: 168.0 per 100,000 (2nd lowest)
- Current COVID-19 test positivity rate: 8.5% (6th lowest)
47. Alaska

- New weekly COVID-19 hospital admissions, Dec. 17-Dec. 22, 2023: 5.5 per 100,000 (40 total)
- COVID-19 hospital admissions since Aug. 1, 2020: 1,390.0 per 100,000 (6th lowest)
- COVID-19 deaths since January 2020: 211.6 per 100,000 (5th lowest)
- Current COVID-19 test positivity rate: 10.2% (22nd lowest)
46. Oregon

- New weekly COVID-19 hospital admissions, Dec. 17-Dec. 22, 2023: 6.3 per 100,000 (267 total)
- COVID-19 hospital admissions since Aug. 1, 2020: 1,191.8 per 100,000 (3rd lowest)
- COVID-19 deaths since January 2020: 228.3 per 100,000 (6th lowest)
- Current COVID-19 test positivity rate: 10.2% (22nd lowest)
45. Nevada

- New weekly COVID-19 hospital admissions, Dec. 17-Dec. 22, 2023: 6.4 per 100,000 (204 total)
- COVID-19 hospital admissions since Aug. 1, 2020: 2,114.4 per 100,000 (17th highest)
- COVID-19 deaths since January 2020: 381.4 per 100,000 (18th highest)
- Current COVID-19 test positivity rate: 9.2% (10th lowest)
44. North Dakota
- New weekly COVID-19 hospital admissions, Dec. 17-Dec. 22, 2023: 6.9 per 100,000 (54 total)
- COVID-19 hospital admissions since Aug. 1, 2020: 2,076.2 per 100,000 (19th highest)
- COVID-19 deaths since January 2020: 346.7 per 100,000 (22nd lowest)
- Current COVID-19 test positivity rate: 8.5% (6th lowest)
43. Kansas
- New weekly COVID-19 hospital admissions, Dec. 17-Dec. 22, 2023: 7.0 per 100,000 (206 total)
- COVID-19 hospital admissions since Aug. 1, 2020: 2,070.3 per 100,000 (22nd highest)
- COVID-19 deaths since January 2020: 370.2 per 100,000 (23rd highest)
- Current COVID-19 test positivity rate: 14.0% (3rd highest)
42. Maine

- New weekly COVID-19 hospital admissions, Dec. 17-Dec. 22, 2023: 7.1 per 100,000 (99 total)
- COVID-19 hospital admissions since Aug. 1, 2020: 1,191.8 per 100,000 (4th lowest)
- COVID-19 deaths since January 2020: 251.9 per 100,000 (8th lowest)
- Current COVID-19 test positivity rate: 13.7% (7th highest)
41. Colorado
- New weekly COVID-19 hospital admissions, Dec. 17-Dec. 22, 2023: 7.3 per 100,000 (426 total)
- COVID-19 hospital admissions since Aug. 1, 2020: 1,787.9 per 100,000 (18th lowest)
- COVID-19 deaths since January 2020: 264.6 per 100,000 (9th lowest)
- Current COVID-19 test positivity rate: 8.5% (6th lowest)
40. Hawaii
- New weekly COVID-19 hospital admissions, Dec. 17-Dec. 22, 2023: 7.5 per 100,000 (108 total)
- COVID-19 hospital admissions since Aug. 1, 2020: 1,476.1 per 100,000 (8th lowest)
- COVID-19 deaths since January 2020: 142.1 per 100,000 (the lowest)
- Current COVID-19 test positivity rate: 9.2% (10th lowest)
39. Tennessee

- New weekly COVID-19 hospital admissions, Dec. 17-Dec. 22, 2023: 7.6 per 100,000 (537 total)
- COVID-19 hospital admissions since Aug. 1, 2020: 1,952.8 per 100,000 (23rd lowest)
- COVID-19 deaths since January 2020: 417.2 per 100,000 (11th highest)
- Current COVID-19 test positivity rate: 9.8% (18th lowest)
38. Vermont

- New weekly COVID-19 hospital admissions, Dec. 17-Dec. 22, 2023: 7.7 per 100,000 (50 total)
- COVID-19 hospital admissions since Aug. 1, 2020: 1,089.7 per 100,000 (2nd lowest)
- COVID-19 deaths since January 2020: 171.7 per 100,000 (3rd lowest)
- Current COVID-19 test positivity rate: 13.7% (7th highest)
37. Texas

- New weekly COVID-19 hospital admissions, Dec. 17-Dec. 22, 2023: 7.9 per 100,000 (2,374 total)
- COVID-19 hospital admissions since Aug. 1, 2020: 2,114.5 per 100,000 (16th highest)
- COVID-19 deaths since January 2020: 345.8 per 100,000 (21st lowest)
- Current COVID-19 test positivity rate: 10.4% (24th highest)
36. Arizona

- New weekly COVID-19 hospital admissions, Dec. 17-Dec. 22, 2023: 7.9 per 100,000 (585 total)
- COVID-19 hospital admissions since Aug. 1, 2020: 2,198.1 per 100,000 (13th highest)
- COVID-19 deaths since January 2020: 411.3 per 100,000 (13th highest)
- Current COVID-19 test positivity rate: 9.2% (10th lowest)
35. North Carolina

- New weekly COVID-19 hospital admissions, Dec. 17-Dec. 22, 2023: 8.2 per 100,000 (874 total)
- COVID-19 hospital admissions since Aug. 1, 2020: 1,666.3 per 100,000 (15th lowest)
- COVID-19 deaths since January 2020: 326.8 per 100,000 (18th lowest)
- Current COVID-19 test positivity rate: 9.8% (18th lowest)
34. Minnesota

- New weekly COVID-19 hospital admissions, Dec. 17-Dec. 22, 2023: 8.4 per 100,000 (480 total)
- COVID-19 hospital admissions since Aug. 1, 2020: 1,494.3 per 100,000 (10th lowest)
- COVID-19 deaths since January 2020: 283.0 per 100,000 (11th lowest)
- Current COVID-19 test positivity rate: 12.6% (13th highest)
33. Mississippi
- New weekly COVID-19 hospital admissions, Dec. 17-Dec. 22, 2023: 8.4 per 100,000 (248 total)
- COVID-19 hospital admissions since Aug. 1, 2020: 1,974.0 per 100,000 (25th lowest)
- COVID-19 deaths since January 2020: 517.0 per 100,000 (the highest)
- Current COVID-19 test positivity rate: 9.8% (18th lowest)
32. Maryland

- New weekly COVID-19 hospital admissions, Dec. 17-Dec. 22, 2023: 8.6 per 100,000 (528 total)
- COVID-19 hospital admissions since Aug. 1, 2020: 1,664.0 per 100,000 (14th lowest)
- COVID-19 deaths since January 2020: 304.0 per 100,000 (16th lowest)
- Current COVID-19 test positivity rate: 11.6% (19th highest)
31. Iowa
- New weekly COVID-19 hospital admissions, Dec. 17-Dec. 22, 2023: 8.7 per 100,000 (280 total)
- COVID-19 hospital admissions since Aug. 1, 2020: 1,829.6 per 100,000 (19th lowest)
- COVID-19 deaths since January 2020: 358.7 per 100,000 (25th highest)
- Current COVID-19 test positivity rate: 14.0% (3rd highest)
30. California
- New weekly COVID-19 hospital admissions, Dec. 17-Dec. 22, 2023: 8.8 per 100,000 (3,425 total)
- COVID-19 hospital admissions since Aug. 1, 2020: 1,674.2 per 100,000 (16th lowest)
- COVID-19 deaths since January 2020: 285.2 per 100,000 (12th lowest)
- Current COVID-19 test positivity rate: 9.2% (10th lowest)
29. Nebraska
- New weekly COVID-19 hospital admissions, Dec. 17-Dec. 22, 2023: 8.8 per 100,000 (174 total)
- COVID-19 hospital admissions since Aug. 1, 2020: 1,738.5 per 100,000 (17th lowest)
- COVID-19 deaths since January 2020: 301.4 per 100,000 (15th lowest)
- Current COVID-19 test positivity rate: 14.0% (3rd highest)
28. Louisiana

- New weekly COVID-19 hospital admissions, Dec. 17-Dec. 22, 2023: 8.8 per 100,000 (406 total)
- COVID-19 hospital admissions since Aug. 1, 2020: 2,176.8 per 100,000 (14th highest)
- COVID-19 deaths since January 2020: 391.3 per 100,000 (14th highest)
- Current COVID-19 test positivity rate: 10.4% (24th highest)
27. South Carolina

- New weekly COVID-19 hospital admissions, Dec. 17-Dec. 22, 2023: 8.9 per 100,000 (470 total)
- COVID-19 hospital admissions since Aug. 1, 2020: 1,901.1 per 100,000 (20th lowest)
- COVID-19 deaths since January 2020: 412.3 per 100,000 (12th highest)
- Current COVID-19 test positivity rate: 9.8% (18th lowest)
26. Wyoming

- New weekly COVID-19 hospital admissions, Dec. 17-Dec. 22, 2023: 8.9 per 100,000 (52 total)
- COVID-19 hospital admissions since Aug. 1, 2020: 2,073.5 per 100,000 (20th highest)
- COVID-19 deaths since January 2020: 380.6 per 100,000 (19th highest)
- Current COVID-19 test positivity rate: 8.5% (6th lowest)
25. Oklahoma
- New weekly COVID-19 hospital admissions, Dec. 17-Dec. 22, 2023: 9.0 per 100,000 (362 total)
- COVID-19 hospital admissions since Aug. 1, 2020: 2,851.8 per 100,000 (2nd highest)
- COVID-19 deaths since January 2020: 498.0 per 100,000 (3rd highest)
- Current COVID-19 test positivity rate: 10.4% (24th highest)
24. Idaho

- New weekly COVID-19 hospital admissions, Dec. 17-Dec. 22, 2023: 9.1 per 100,000 (177 total)
- COVID-19 hospital admissions since Aug. 1, 2020: 1,548.6 per 100,000 (12th lowest)
- COVID-19 deaths since January 2020: 291.3 per 100,000 (13th lowest)
- Current COVID-19 test positivity rate: 10.2% (22nd lowest)
23. Florida

- New weekly COVID-19 hospital admissions, Dec. 17-Dec. 22, 2023: 9.2 per 100,000 (2,051 total)
- COVID-19 hospital admissions since Aug. 1, 2020: 2,666.3 per 100,000 (4th highest)
- COVID-19 deaths since January 2020: 367.6 per 100,000 (24th highest)
- Current COVID-19 test positivity rate: 9.8% (18th lowest)
22. Wisconsin

- New weekly COVID-19 hospital admissions, Dec. 17-Dec. 22, 2023: 9.9 per 100,000 (582 total)
- COVID-19 hospital admissions since Aug. 1, 2020: 2,286.7 per 100,000 (9th highest)
- COVID-19 deaths since January 2020: 299.9 per 100,000 (14th lowest)
- Current COVID-19 test positivity rate: 12.6% (13th highest)
21. Alabama
- New weekly COVID-19 hospital admissions, Dec. 17-Dec. 22, 2023: 10.0 per 100,000 (506 total)
- COVID-19 hospital admissions since Aug. 1, 2020: 2,460.8 per 100,000 (6th highest)
- COVID-19 deaths since January 2020: 449.0 per 100,000 (6th highest)
- Current COVID-19 test positivity rate: 9.8% (18th lowest)
20. Georgia

- New weekly COVID-19 hospital admissions, Dec. 17-Dec. 22, 2023: 10.1 per 100,000 (1,102 total)
- COVID-19 hospital admissions since Aug. 1, 2020: 2,282.7 per 100,000 (11th highest)
- COVID-19 deaths since January 2020: 337.5 per 100,000 (20th lowest)
- Current COVID-19 test positivity rate: 9.8% (18th lowest)
19. Virginia

- New weekly COVID-19 hospital admissions, Dec. 17-Dec. 22, 2023: 10.3 per 100,000 (892 total)
- COVID-19 hospital admissions since Aug. 1, 2020: 1,518.6 per 100,000 (11th lowest)
- COVID-19 deaths since January 2020: 280.9 per 100,000 (10th lowest)
- Current COVID-19 test positivity rate: 11.6% (19th highest)
18. Kentucky

- New weekly COVID-19 hospital admissions, Dec. 17-Dec. 22, 2023: 10.4 per 100,000 (471 total)
- COVID-19 hospital admissions since Aug. 1, 2020: 3,602.2 per 100,000 (the highest)
- COVID-19 deaths since January 2020: 457.6 per 100,000 (4th highest)
- Current COVID-19 test positivity rate: 9.8% (18th lowest)
17. Delaware
- New weekly COVID-19 hospital admissions, Dec. 17-Dec. 22, 2023: 10.7 per 100,000 (109 total)
- COVID-19 hospital admissions since Aug. 1, 2020: 2,093.8 per 100,000 (18th highest)
- COVID-19 deaths since January 2020: 349.7 per 100,000 (24th lowest)
- Current COVID-19 test positivity rate: 11.6% (19th highest)
16. South Dakota

- New weekly COVID-19 hospital admissions, Dec. 17-Dec. 22, 2023: 10.9 per 100,000 (99 total)
- COVID-19 hospital admissions since Aug. 1, 2020: 2,285.9 per 100,000 (10th highest)
- COVID-19 deaths since January 2020: 370.7 per 100,000 (22nd highest)
- Current COVID-19 test positivity rate: 8.5% (6th lowest)
15. Montana

- New weekly COVID-19 hospital admissions, Dec. 17-Dec. 22, 2023: 11.0 per 100,000 (123 total)
- COVID-19 hospital admissions since Aug. 1, 2020: 2,835.7 per 100,000 (3rd highest)
- COVID-19 deaths since January 2020: 355.0 per 100,000 (25th lowest)
- Current COVID-19 test positivity rate: 8.5% (6th lowest)
14. New Hampshire
- New weekly COVID-19 hospital admissions, Dec. 17-Dec. 22, 2023: 11.0 per 100,000 (153 total)
- COVID-19 hospital admissions since Aug. 1, 2020: 1,425.5 per 100,000 (7th lowest)
- COVID-19 deaths since January 2020: 246.1 per 100,000 (7th lowest)
- Current COVID-19 test positivity rate: 13.7% (7th highest)
13. Michigan

- New weekly COVID-19 hospital admissions, Dec. 17-Dec. 22, 2023: 11.0 per 100,000 (1,101 total)
- COVID-19 hospital admissions since Aug. 1, 2020: 2,056.4 per 100,000 (23rd highest)
- COVID-19 deaths since January 2020: 386.6 per 100,000 (17th highest)
- Current COVID-19 test positivity rate: 12.6% (13th highest)
12. Illinois

- New weekly COVID-19 hospital admissions, Dec. 17-Dec. 22, 2023: 11.1 per 100,000 (1,393 total)
- COVID-19 hospital admissions since Aug. 1, 2020: 1,962.7 per 100,000 (24th lowest)
- COVID-19 deaths since January 2020: 329.1 per 100,000 (19th lowest)
- Current COVID-19 test positivity rate: 12.6% (13th highest)
11. Rhode Island

- New weekly COVID-19 hospital admissions, Dec. 17-Dec. 22, 2023: 11.2 per 100,000 (122 total)
- COVID-19 hospital admissions since Aug. 1, 2020: 1,314.3 per 100,000 (5th lowest)
- COVID-19 deaths since January 2020: 372.4 per 100,000 (21st highest)
- Current COVID-19 test positivity rate: 13.7% (7th highest)
10. Ohio

- New weekly COVID-19 hospital admissions, Dec. 17-Dec. 22, 2023: 11.3 per 100,000 (1,334 total)
- COVID-19 hospital admissions since Aug. 1, 2020: 2,366.1 per 100,000 (7th highest)
- COVID-19 deaths since January 2020: 433.8 per 100,000 (7th highest)
- Current COVID-19 test positivity rate: 12.6% (13th highest)
9. Pennsylvania
- New weekly COVID-19 hospital admissions, Dec. 17-Dec. 22, 2023: 11.4 per 100,000 (1,473 total)
- COVID-19 hospital admissions since Aug. 1, 2020: 2,022.4 per 100,000 (24th highest)
- COVID-19 deaths since January 2020: 417.6 per 100,000 (10th highest)
- Current COVID-19 test positivity rate: 11.6% (19th highest)
8. Indiana

- New weekly COVID-19 hospital admissions, Dec. 17-Dec. 22, 2023: 12.1 per 100,000 (826 total)
- COVID-19 hospital admissions since Aug. 1, 2020: 2,172.0 per 100,000 (15th highest)
- COVID-19 deaths since January 2020: 391.1 per 100,000 (15th highest)
- Current COVID-19 test positivity rate: 12.6% (13th highest)
7. Arkansas

- New weekly COVID-19 hospital admissions, Dec. 17-Dec. 22, 2023: 12.3 per 100,000 (375 total)
- COVID-19 hospital admissions since Aug. 1, 2020: 2,339.5 per 100,000 (8th highest)
- COVID-19 deaths since January 2020: 420.7 per 100,000 (9th highest)
- Current COVID-19 test positivity rate: 10.4% (24th highest)
6. Massachusetts

- New weekly COVID-19 hospital admissions, Dec. 17-Dec. 22, 2023: 12.6 per 100,000 (879 total)
- COVID-19 hospital admissions since Aug. 1, 2020: 1,642.7 per 100,000 (13th lowest)
- COVID-19 deaths since January 2020: 310.2 per 100,000 (17th lowest)
- Current COVID-19 test positivity rate: 13.7% (7th highest)
5. Missouri

- New weekly COVID-19 hospital admissions, Dec. 17-Dec. 22, 2023: 12.7 per 100,000 (782 total)
- COVID-19 hospital admissions since Aug. 1, 2020: 2,266.7 per 100,000 (12th highest)
- COVID-19 deaths since January 2020: 374.6 per 100,000 (20th highest)
- Current COVID-19 test positivity rate: 14.0% (3rd highest)
4. Connecticut

- New weekly COVID-19 hospital admissions, Dec. 17-Dec. 22, 2023: 13.5 per 100,000 (488 total)
- COVID-19 hospital admissions since Aug. 1, 2020: 1,931.4 per 100,000 (22nd lowest)
- COVID-19 deaths since January 2020: 348.7 per 100,000 (23rd lowest)
- Current COVID-19 test positivity rate: 13.7% (7th highest)
3. New Jersey

- New weekly COVID-19 hospital admissions, Dec. 17-Dec. 22, 2023: 14.2 per 100,000 (1,312 total)
- COVID-19 hospital admissions since Aug. 1, 2020: 2,000.3 per 100,000 (25th highest)
- COVID-19 deaths since January 2020: 389.5 per 100,000 (16th highest)
- Current COVID-19 test positivity rate: 14.8% (the highest)
2. West Virginia

- New weekly COVID-19 hospital admissions, Dec. 17-Dec. 22, 2023: 15.4 per 100,000 (274 total)
- COVID-19 hospital admissions since Aug. 1, 2020: 2,612.8 per 100,000 (5th highest)
- COVID-19 deaths since January 2020: 503.5 per 100,000 (2nd highest)
- Current COVID-19 test positivity rate: 11.6% (19th highest)
1. New York

- New weekly COVID-19 hospital admissions, Dec. 17-Dec. 22, 2023: 15.6 per 100,000 (3,065 total)
- COVID-19 hospital admissions since Aug. 1, 2020: 2,071.7 per 100,000 (21st highest)
- COVID-19 deaths since January 2020: 422.2 per 100,000 (8th highest)
- Current COVID-19 test positivity rate: 14.8% (the highest)

