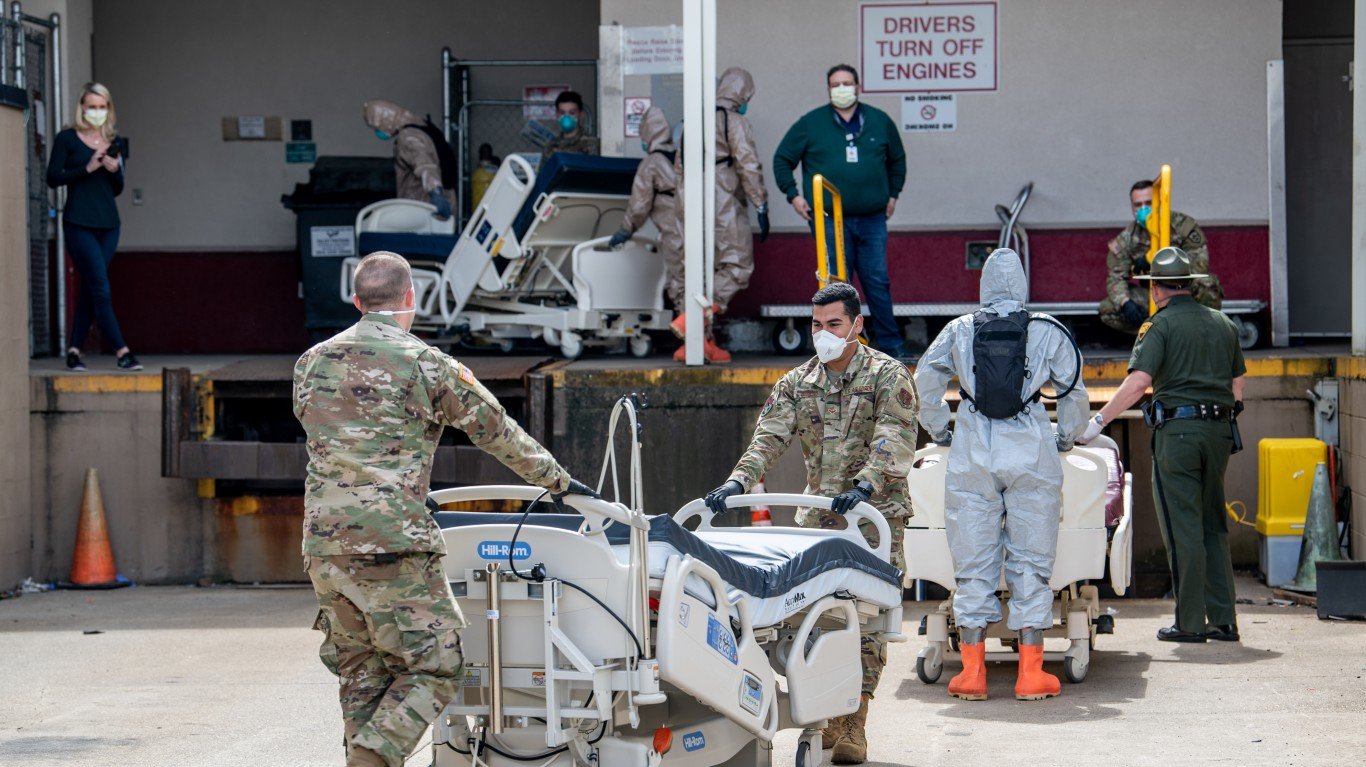
Hospitalizations for COVID-19 have surged to the highest level in over nine months, as per the latest data from the Centers for Disease Control and Prevention. Simultaneously, there has been an uptick in test positivity rates. Senior citizens, middle-aged adults, and children under the age of 4 continue to experience higher rates of COVID-related hospitalizations.
To determine the states where the COVID-19 surge is the worst right now, 24/7 Tempo reviewed data on recent COVID-19 hospital admissions from the Centers for Disease Control and Prevention. States were ranked based on the number of new hospital admissions due to COVID-19 per 100,000 state residents for the week of Nov. 26-Dec. 2, 2023.
During the week ending December 2, the seven-day moving average of nationwide hospital admissions increased by 17.6%, reaching 22,513—a figure not seen since March 4. Concurrently, the test positivity rate surged to 11.5% for the same week.
For the third consecutive week, West Virginia reported the highest rate of new COVID-19-related hospital admissions per 100,000 state residents, reaching 17.5—a 2-percentage-point increase compared to the previous week. The top 10 states in terms of new hospital admissions during the current reporting period all exhibited rates at least 1 point higher than their counterparts in the preceding period.
Once again, Alaska recorded the lowest hospital admissions rate at 3.1, marking an increase of over 1 percentage point from the previous reporting period. Alaska was among nine states that consistently ranked in the bottom 10 for hospital admissions, and notably, seven of these states were located in the southern region.
Continuing a trend observed for at least the fourth consecutive week, four Midwest/Plains states—Nebraska, Kansas, Missouri, and Iowa—maintained the nation’s highest test positivity rate at 16.7, indicating a 0.5-point increase from the prior reporting period. Other Midwest states comprised the remaining positions among the top 10 states with the highest test positivity rates. (Click here for 30 famous people who died from COVID.)
50. Alaska
- New weekly COVID-19 hospital admissions, Nov. 26-Dec. 2, 2023: 3.1 per 100,000 (23 total)
- COVID-19 hospital admissions since Aug. 1, 2020: 1,366.6 per 100,000 (6th lowest)
- COVID-19 deaths since January 2020: 210.6 per 100,000 (5th lowest)
- Current COVID-19 test positivity rate: 8.2% (21st lowest)
49. Washington

- New weekly COVID-19 hospital admissions, Nov. 26-Dec. 2, 2023: 3.3 per 100,000 (254 total)
- COVID-19 hospital admissions since Aug. 1, 2020: 1,032.3 per 100,000 (the lowest)
- COVID-19 deaths since January 2020: 198.0 per 100,000 (4th lowest)
- Current COVID-19 test positivity rate: 8.2% (21st lowest)
48. Georgia

- New weekly COVID-19 hospital admissions, Nov. 26-Dec. 2, 2023: 3.3 per 100,000 (365 total)
- COVID-19 hospital admissions since Aug. 1, 2020: 2,237.8 per 100,000 (9th highest)
- COVID-19 deaths since January 2020: 335.7 per 100,000 (20th lowest)
- Current COVID-19 test positivity rate: 6.1% (8th lowest)
47. Mississippi

- New weekly COVID-19 hospital admissions, Nov. 26-Dec. 2, 2023: 3.5 per 100,000 (102 total)
- COVID-19 hospital admissions since Aug. 1, 2020: 1,937.5 per 100,000 (25th highest)
- COVID-19 deaths since January 2020: 512.2 per 100,000 (the highest)
- Current COVID-19 test positivity rate: 6.1% (8th lowest)
46. Florida

- New weekly COVID-19 hospital admissions, Nov. 26-Dec. 2, 2023: 3.6 per 100,000 (797 total)
- COVID-19 hospital admissions since Aug. 1, 2020: 2,624.1 per 100,000 (4th highest)
- COVID-19 deaths since January 2020: 365.6 per 100,000 (23rd highest)
- Current COVID-19 test positivity rate: 6.1% (8th lowest)
45. Texas

- New weekly COVID-19 hospital admissions, Nov. 26-Dec. 2, 2023: 4.0 per 100,000 (1,210 total)
- COVID-19 hospital admissions since Aug. 1, 2020: 2,077.0 per 100,000 (16th highest)
- COVID-19 deaths since January 2020: 343.9 per 100,000 (22nd lowest)
- Current COVID-19 test positivity rate: 7.2% (13th lowest)
44. Louisiana

- New weekly COVID-19 hospital admissions, Nov. 26-Dec. 2, 2023: 4.3 per 100,000 (196 total)
- COVID-19 hospital admissions since Aug. 1, 2020: 2,135.9 per 100,000 (14th highest)
- COVID-19 deaths since January 2020: 389.3 per 100,000 (14th highest)
- Current COVID-19 test positivity rate: 7.2% (13th lowest)
43. North Carolina
- New weekly COVID-19 hospital admissions, Nov. 26-Dec. 2, 2023: 4.3 per 100,000 (462 total)
- COVID-19 hospital admissions since Aug. 1, 2020: 1,625.2 per 100,000 (16th lowest)
- COVID-19 deaths since January 2020: 323.0 per 100,000 (18th lowest)
- Current COVID-19 test positivity rate: 6.1% (8th lowest)
42. South Carolina

- New weekly COVID-19 hospital admissions, Nov. 26-Dec. 2, 2023: 4.8 per 100,000 (253 total)
- COVID-19 hospital admissions since Aug. 1, 2020: 1,855.1 per 100,000 (20th lowest)
- COVID-19 deaths since January 2020: 408.8 per 100,000 (12th highest)
- Current COVID-19 test positivity rate: 6.1% (8th lowest)
41. Rhode Island

- New weekly COVID-19 hospital admissions, Nov. 26-Dec. 2, 2023: 4.8 per 100,000 (53 total)
- COVID-19 hospital admissions since Aug. 1, 2020: 1,259.5 per 100,000 (5th lowest)
- COVID-19 deaths since January 2020: 369.4 per 100,000 (21st highest)
- Current COVID-19 test positivity rate: 10.0% (17th highest)
40. Oregon

- New weekly COVID-19 hospital admissions, Nov. 26-Dec. 2, 2023: 5.1 per 100,000 (216 total)
- COVID-19 hospital admissions since Aug. 1, 2020: 1,157.0 per 100,000 (4th lowest)
- COVID-19 deaths since January 2020: 225.2 per 100,000 (6th lowest)
- Current COVID-19 test positivity rate: 8.2% (21st lowest)
39. Alabama
- New weekly COVID-19 hospital admissions, Nov. 26-Dec. 2, 2023: 5.3 per 100,000 (267 total)
- COVID-19 hospital admissions since Aug. 1, 2020: 2,406.4 per 100,000 (6th highest)
- COVID-19 deaths since January 2020: 445.9 per 100,000 (6th highest)
- Current COVID-19 test positivity rate: 6.1% (8th lowest)
38. Hawaii
- New weekly COVID-19 hospital admissions, Nov. 26-Dec. 2, 2023: 5.3 per 100,000 (77 total)
- COVID-19 hospital admissions since Aug. 1, 2020: 1,438.1 per 100,000 (8th lowest)
- COVID-19 deaths since January 2020: 141.2 per 100,000 (the lowest)
- Current COVID-19 test positivity rate: 8.2% (21st lowest)
37. Tennessee

- New weekly COVID-19 hospital admissions, Nov. 26-Dec. 2, 2023: 5.7 per 100,000 (401 total)
- COVID-19 hospital admissions since Aug. 1, 2020: 1,905.4 per 100,000 (24th lowest)
- COVID-19 deaths since January 2020: 413.4 per 100,000 (10th highest)
- Current COVID-19 test positivity rate: 6.1% (8th lowest)
36. Nevada

- New weekly COVID-19 hospital admissions, Nov. 26-Dec. 2, 2023: 6.1 per 100,000 (195 total)
- COVID-19 hospital admissions since Aug. 1, 2020: 2,072.0 per 100,000 (17th highest)
- COVID-19 deaths since January 2020: 378.2 per 100,000 (18th highest)
- Current COVID-19 test positivity rate: 8.2% (21st lowest)
35. Maine

- New weekly COVID-19 hospital admissions, Nov. 26-Dec. 2, 2023: 6.3 per 100,000 (87 total)
- COVID-19 hospital admissions since Aug. 1, 2020: 1,142.3 per 100,000 (3rd lowest)
- COVID-19 deaths since January 2020: 245.0 per 100,000 (8th lowest)
- Current COVID-19 test positivity rate: 10.0% (17th highest)
34. California

- New weekly COVID-19 hospital admissions, Nov. 26-Dec. 2, 2023: 6.4 per 100,000 (2,488 total)
- COVID-19 hospital admissions since Aug. 1, 2020: 1,623.4 per 100,000 (15th lowest)
- COVID-19 deaths since January 2020: 282.7 per 100,000 (12th lowest)
- Current COVID-19 test positivity rate: 8.2% (21st lowest)
33. Arkansas

- New weekly COVID-19 hospital admissions, Nov. 26-Dec. 2, 2023: 6.5 per 100,000 (198 total)
- COVID-19 hospital admissions since Aug. 1, 2020: 2,277.5 per 100,000 (8th highest)
- COVID-19 deaths since January 2020: 417.4 per 100,000 (9th highest)
- Current COVID-19 test positivity rate: 7.2% (13th lowest)
32. New Hampshire

- New weekly COVID-19 hospital admissions, Nov. 26-Dec. 2, 2023: 6.5 per 100,000 (91 total)
- COVID-19 hospital admissions since Aug. 1, 2020: 1,368.4 per 100,000 (7th lowest)
- COVID-19 deaths since January 2020: 241.6 per 100,000 (7th lowest)
- Current COVID-19 test positivity rate: 10.0% (17th highest)
31. Utah

- New weekly COVID-19 hospital admissions, Nov. 26-Dec. 2, 2023: 6.5 per 100,000 (221 total)
- COVID-19 hospital admissions since Aug. 1, 2020: 1,443.3 per 100,000 (10th lowest)
- COVID-19 deaths since January 2020: 166.1 per 100,000 (2nd lowest)
- Current COVID-19 test positivity rate: 10.6% (11th highest)
30. Maryland

- New weekly COVID-19 hospital admissions, Nov. 26-Dec. 2, 2023: 6.6 per 100,000 (407 total)
- COVID-19 hospital admissions since Aug. 1, 2020: 1,614.9 per 100,000 (14th lowest)
- COVID-19 deaths since January 2020: 299.8 per 100,000 (16th lowest)
- Current COVID-19 test positivity rate: 10.0% (17th highest)
29. Vermont

- New weekly COVID-19 hospital admissions, Nov. 26-Dec. 2, 2023: 6.6 per 100,000 (43 total)
- COVID-19 hospital admissions since Aug. 1, 2020: 1,041.5 per 100,000 (2nd lowest)
- COVID-19 deaths since January 2020: 167.4 per 100,000 (3rd lowest)
- Current COVID-19 test positivity rate: 10.0% (17th highest)
28. New Jersey

- New weekly COVID-19 hospital admissions, Nov. 26-Dec. 2, 2023: 6.7 per 100,000 (621 total)
- COVID-19 hospital admissions since Aug. 1, 2020: 1,930.0 per 100,000 (25th lowest)
- COVID-19 deaths since January 2020: 386.0 per 100,000 (15th highest)
- Current COVID-19 test positivity rate: 8.5% (23rd lowest)
27. Virginia

- New weekly COVID-19 hospital admissions, Nov. 26-Dec. 2, 2023: 6.9 per 100,000 (600 total)
- COVID-19 hospital admissions since Aug. 1, 2020: 1,461.5 per 100,000 (11th lowest)
- COVID-19 deaths since January 2020: 276.7 per 100,000 (10th lowest)
- Current COVID-19 test positivity rate: 10.0% (17th highest)
26. Oklahoma
- New weekly COVID-19 hospital admissions, Nov. 26-Dec. 2, 2023: 6.9 per 100,000 (279 total)
- COVID-19 hospital admissions since Aug. 1, 2020: 2,793.7 per 100,000 (2nd highest)
- COVID-19 deaths since January 2020: 492.5 per 100,000 (3rd highest)
- Current COVID-19 test positivity rate: 7.2% (13th lowest)
25. Arizona

- New weekly COVID-19 hospital admissions, Nov. 26-Dec. 2, 2023: 7.0 per 100,000 (512 total)
- COVID-19 hospital admissions since Aug. 1, 2020: 2,153.4 per 100,000 (13th highest)
- COVID-19 deaths since January 2020: 408.2 per 100,000 (13th highest)
- Current COVID-19 test positivity rate: 8.2% (21st lowest)
24. Kansas
- New weekly COVID-19 hospital admissions, Nov. 26-Dec. 2, 2023: 7.2 per 100,000 (212 total)
- COVID-19 hospital admissions since Aug. 1, 2020: 2,012.8 per 100,000 (20th highest)
- COVID-19 deaths since January 2020: 365.4 per 100,000 (24th highest)
- Current COVID-19 test positivity rate: 16.7% (the highest)
23. New Mexico

- New weekly COVID-19 hospital admissions, Nov. 26-Dec. 2, 2023: 7.3 per 100,000 (154 total)
- COVID-19 hospital admissions since Aug. 1, 2020: 1,886.4 per 100,000 (22nd lowest)
- COVID-19 deaths since January 2020: 447.7 per 100,000 (5th highest)
- Current COVID-19 test positivity rate: 7.2% (13th lowest)
22. Delaware
- New weekly COVID-19 hospital admissions, Nov. 26-Dec. 2, 2023: 7.5 per 100,000 (76 total)
- COVID-19 hospital admissions since Aug. 1, 2020: 2,039.3 per 100,000 (18th highest)
- COVID-19 deaths since January 2020: 345.4 per 100,000 (24th lowest)
- Current COVID-19 test positivity rate: 10.0% (17th highest)
21. New York

- New weekly COVID-19 hospital admissions, Nov. 26-Dec. 2, 2023: 7.7 per 100,000 (1,510 total)
- COVID-19 hospital admissions since Aug. 1, 2020: 1,994.0 per 100,000 (22nd highest)
- COVID-19 deaths since January 2020: 418.2 per 100,000 (8th highest)
- Current COVID-19 test positivity rate: 8.5% (23rd lowest)
20. Minnesota

- New weekly COVID-19 hospital admissions, Nov. 26-Dec. 2, 2023: 7.9 per 100,000 (450 total)
- COVID-19 hospital admissions since Aug. 1, 2020: 1,440.1 per 100,000 (9th lowest)
- COVID-19 deaths since January 2020: 278.0 per 100,000 (11th lowest)
- Current COVID-19 test positivity rate: 14.9% (5th highest)
19. Pennsylvania

- New weekly COVID-19 hospital admissions, Nov. 26-Dec. 2, 2023: 7.9 per 100,000 (1,026 total)
- COVID-19 hospital admissions since Aug. 1, 2020: 1,959.2 per 100,000 (24th highest)
- COVID-19 deaths since January 2020: 413.3 per 100,000 (11th highest)
- Current COVID-19 test positivity rate: 10.0% (17th highest)
18. Idaho
- New weekly COVID-19 hospital admissions, Nov. 26-Dec. 2, 2023: 8.0 per 100,000 (155 total)
- COVID-19 hospital admissions since Aug. 1, 2020: 1,493.6 per 100,000 (12th lowest)
- COVID-19 deaths since January 2020: 288.6 per 100,000 (13th lowest)
- Current COVID-19 test positivity rate: 8.2% (21st lowest)
17. Wyoming

- New weekly COVID-19 hospital admissions, Nov. 26-Dec. 2, 2023: 8.1 per 100,000 (47 total)
- COVID-19 hospital admissions since Aug. 1, 2020: 2,028.4 per 100,000 (19th highest)
- COVID-19 deaths since January 2020: 375.8 per 100,000 (19th highest)
- Current COVID-19 test positivity rate: 10.6% (11th highest)
16. Massachusetts

- New weekly COVID-19 hospital admissions, Nov. 26-Dec. 2, 2023: 8.5 per 100,000 (595 total)
- COVID-19 hospital admissions since Aug. 1, 2020: 1,570.1 per 100,000 (13th lowest)
- COVID-19 deaths since January 2020: 306.2 per 100,000 (17th lowest)
- Current COVID-19 test positivity rate: 10.0% (17th highest)
15. Colorado
- New weekly COVID-19 hospital admissions, Nov. 26-Dec. 2, 2023: 8.7 per 100,000 (506 total)
- COVID-19 hospital admissions since Aug. 1, 2020: 1,742.6 per 100,000 (18th lowest)
- COVID-19 deaths since January 2020: 261.7 per 100,000 (9th lowest)
- Current COVID-19 test positivity rate: 10.6% (11th highest)
14. Connecticut

- New weekly COVID-19 hospital admissions, Nov. 26-Dec. 2, 2023: 8.9 per 100,000 (322 total)
- COVID-19 hospital admissions since Aug. 1, 2020: 1,865.1 per 100,000 (21st lowest)
- COVID-19 deaths since January 2020: 345.4 per 100,000 (23rd lowest)
- Current COVID-19 test positivity rate: 10.0% (17th highest)
13. Nebraska
- New weekly COVID-19 hospital admissions, Nov. 26-Dec. 2, 2023: 9.2 per 100,000 (181 total)
- COVID-19 hospital admissions since Aug. 1, 2020: 1,672.3 per 100,000 (17th lowest)
- COVID-19 deaths since January 2020: 297.0 per 100,000 (15th lowest)
- Current COVID-19 test positivity rate: 16.7% (the highest)
12. Montana

- New weekly COVID-19 hospital admissions, Nov. 26-Dec. 2, 2023: 9.3 per 100,000 (104 total)
- COVID-19 hospital admissions since Aug. 1, 2020: 2,776.4 per 100,000 (3rd highest)
- COVID-19 deaths since January 2020: 350.9 per 100,000 (25th lowest)
- Current COVID-19 test positivity rate: 10.6% (11th highest)
11. Kentucky

- New weekly COVID-19 hospital admissions, Nov. 26-Dec. 2, 2023: 9.5 per 100,000 (428 total)
- COVID-19 hospital admissions since Aug. 1, 2020: 3,534.6 per 100,000 (the highest)
- COVID-19 deaths since January 2020: 451.5 per 100,000 (4th highest)
- Current COVID-19 test positivity rate: 6.1% (8th lowest)
10. North Dakota
- New weekly COVID-19 hospital admissions, Nov. 26-Dec. 2, 2023: 9.5 per 100,000 (74 total)
- COVID-19 hospital admissions since Aug. 1, 2020: 2,011.4 per 100,000 (21st highest)
- COVID-19 deaths since January 2020: 343.1 per 100,000 (21st lowest)
- Current COVID-19 test positivity rate: 10.6% (11th highest)
9. Illinois

- New weekly COVID-19 hospital admissions, Nov. 26-Dec. 2, 2023: 9.7 per 100,000 (1,225 total)
- COVID-19 hospital admissions since Aug. 1, 2020: 1,892.0 per 100,000 (23rd lowest)
- COVID-19 deaths since January 2020: 325.3 per 100,000 (19th lowest)
- Current COVID-19 test positivity rate: 14.9% (5th highest)
8. Iowa
- New weekly COVID-19 hospital admissions, Nov. 26-Dec. 2, 2023: 9.8 per 100,000 (315 total)
- COVID-19 hospital admissions since Aug. 1, 2020: 1,760.0 per 100,000 (19th lowest)
- COVID-19 deaths since January 2020: 352.8 per 100,000 (25th highest)
- Current COVID-19 test positivity rate: 16.7% (the highest)
7. Wisconsin

- New weekly COVID-19 hospital admissions, Nov. 26-Dec. 2, 2023: 9.9 per 100,000 (582 total)
- COVID-19 hospital admissions since Aug. 1, 2020: 2,222.1 per 100,000 (10th highest)
- COVID-19 deaths since January 2020: 295.5 per 100,000 (14th lowest)
- Current COVID-19 test positivity rate: 14.9% (5th highest)
6. Missouri

- New weekly COVID-19 hospital admissions, Nov. 26-Dec. 2, 2023: 10.1 per 100,000 (621 total)
- COVID-19 hospital admissions since Aug. 1, 2020: 2,191.7 per 100,000 (12th highest)
- COVID-19 deaths since January 2020: 369.8 per 100,000 (20th highest)
- Current COVID-19 test positivity rate: 16.7% (the highest)
5. Indiana
- New weekly COVID-19 hospital admissions, Nov. 26-Dec. 2, 2023: 10.1 per 100,000 (690 total)
- COVID-19 hospital admissions since Aug. 1, 2020: 2,100.5 per 100,000 (15th highest)
- COVID-19 deaths since January 2020: 385.3 per 100,000 (16th highest)
- Current COVID-19 test positivity rate: 14.9% (5th highest)
4. Michigan
- New weekly COVID-19 hospital admissions, Nov. 26-Dec. 2, 2023: 10.2 per 100,000 (1,022 total)
- COVID-19 hospital admissions since Aug. 1, 2020: 1,988.8 per 100,000 (23rd highest)
- COVID-19 deaths since January 2020: 381.3 per 100,000 (17th highest)
- Current COVID-19 test positivity rate: 14.9% (5th highest)
3. Ohio

- New weekly COVID-19 hospital admissions, Nov. 26-Dec. 2, 2023: 10.6 per 100,000 (1,243 total)
- COVID-19 hospital admissions since Aug. 1, 2020: 2,292.8 per 100,000 (7th highest)
- COVID-19 deaths since January 2020: 429.0 per 100,000 (7th highest)
- Current COVID-19 test positivity rate: 14.9% (5th highest)
2. South Dakota

- New weekly COVID-19 hospital admissions, Nov. 26-Dec. 2, 2023: 12.6 per 100,000 (115 total)
- COVID-19 hospital admissions since Aug. 1, 2020: 2,209.0 per 100,000 (11th highest)
- COVID-19 deaths since January 2020: 365.7 per 100,000 (22nd highest)
- Current COVID-19 test positivity rate: 10.6% (11th highest)
1. West Virginia
- New weekly COVID-19 hospital admissions, Nov. 26-Dec. 2, 2023: 17.5 per 100,000 (310 total)
- COVID-19 hospital admissions since Aug. 1, 2020: 2,512.1 per 100,000 (5th highest)
- COVID-19 deaths since January 2020: 496.9 per 100,000 (2nd highest)
- Current COVID-19 test positivity rate: 10.0% (17th highest)

