Health officials have warned that the colder temperatures will bring on greater incidences of seasonal afflictions such as the flu that will compromise immune systems and allow the coronavirus to spread. That appears to be happening. Hospital admissions climbed for the most recent reporting period.
To determine the states where the COVID-19 surge is the worst right now, 24/7 Tempo reviewed data on recent COVID-19 hospital admissions from the Centers for Disease Control and Prevention. States were ranked based on the number of new hospital admissions due to COVID-19 per 100,000 state residents for the week of Nov. 12-18, 2023. Supplemental data on the total number of recorded COVID-19 hospital admissions since Aug. 1, 2020; the total number of deaths due to COVID-19 since January 2020; and the COVID-19 test positivity rate for the week of Nov. 12-18, 2023 also came from the CDC.
The seven-day moving average of hospital admissions across the country climbed to 9.7% to 18,119 for the reporting period ending Nov. 18 from the previous week. Test positivity slid by 1.7% to 8.2% for the week ending Nov. 18.
The prevalence of a highly mutated COVID-19 variant called BA.2.86 has tripled in the past two weeks, new government data shows, increasing from 4.8% to 15.2%. Nearly 1 in 10 new COVID-19 cases are linked to this variant, the CDC reported Monday. The predominant variants are HV.1 and EG.5, which make up nearly 45% of all COVID-19 cases in the U.S.
West Virginia had the highest number of new hospital admissions due to COVID-19 per 100,000 state residents in the latest report with a rate of 12.1. A week earlier, Hawaii had the highest rate at 11.9.
Nine of the 10 states with the highest rates were among the highest 10 the previous week and nine states in the top 10 had higher rates than the corresponding 10 states the prior week. Seven of the lowest 10 in the current period were also among the lowest 10 the prior week. Alaska had the lowest hospital admissions rate at 2.6, and seven of the next lowest states were Southern states. New Jersey had the lowest rate the prior week. (Click here for 30 famous people who died from COVID.)
There was a wider gulf between the states with the highest and lowest test positivity rates. Four Midwest/Plains states — Nebraska, Kansas, Missouri, and Iowa — had a nation-high test positivity rate of 14.1. Those states were also the highest in the prior reporting period. At the lower end were New Mexico, Oklahoma, Texas, and Arkansas at 3.3. That rate was lower than the previous week when New York and New Jersey had the lowest rates at 5.8. Those two Northeastern states were among six states at the next-lowest rate of 6.3.
Here are the states where COVID-19 is the worst right now.
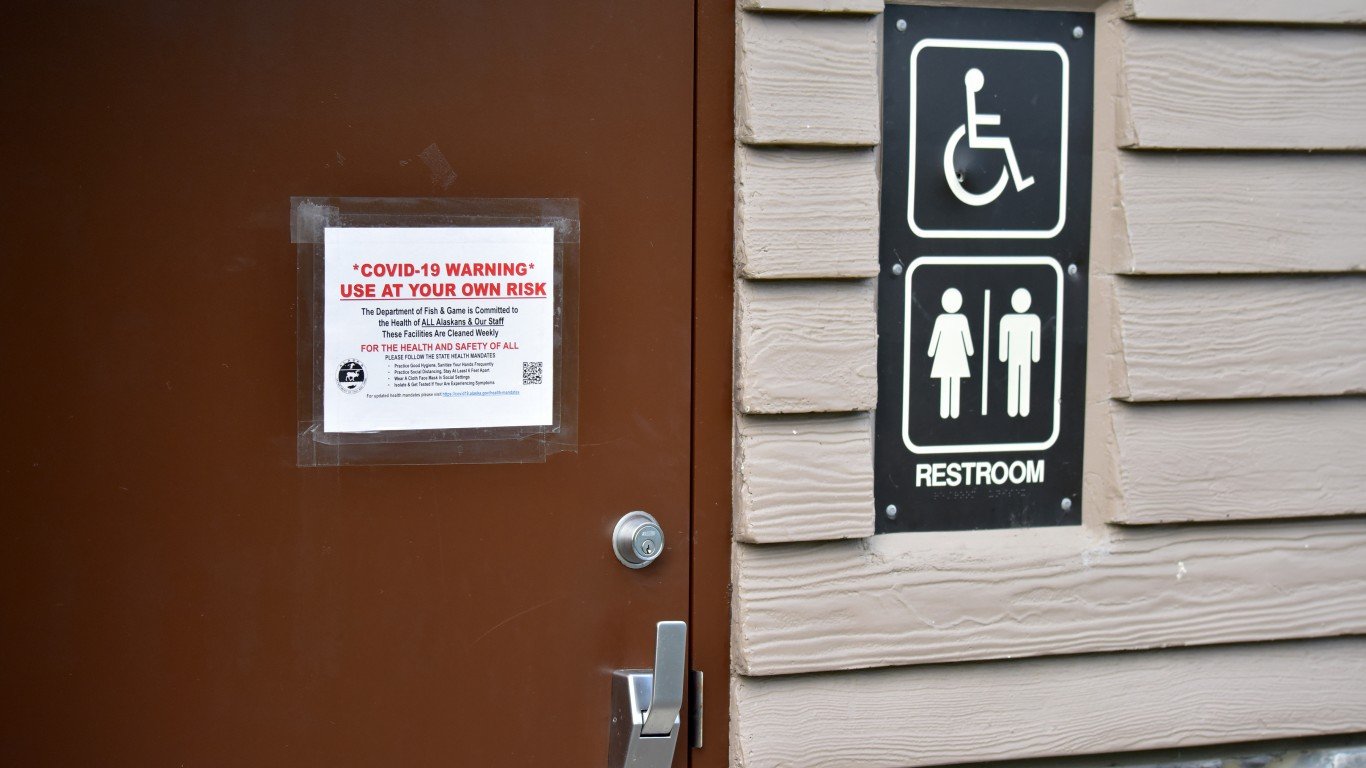
50. Alaska
> New weekly COVID-19 hospital admissions, Nov. 12-18, 2023: 2.6 per 100,000 (19 total)
> COVID-19 hospital admissions since Aug. 1, 2020: 1,361.4 per 100,000 (7th lowest)
> COVID-19 deaths since January 2020: 210.1 per 100,000 (5th lowest)
> Current COVID-19 test positivity rate: 7.4% (25th lowest)

49. Mississippi
> New weekly COVID-19 hospital admissions, Nov. 12-18, 2023: 2.7 per 100,000 (78 total)
> COVID-19 hospital admissions since Aug. 1, 2020: 1,930.5 per 100,000 (25th highest)
> COVID-19 deaths since January 2020: 511.4 per 100,000 (the highest)
> Current COVID-19 test positivity rate: 6.5% (15th lowest)

48. Georgia
> New weekly COVID-19 hospital admissions, Nov. 12-18, 2023: 2.9 per 100,000 (320 total)
> COVID-19 hospital admissions since Aug. 1, 2020: 2,230.7 per 100,000 (9th highest)
> COVID-19 deaths since January 2020: 335.1 per 100,000 (20th lowest)
> Current COVID-19 test positivity rate: 6.5% (15th lowest)

47. Washington
> New weekly COVID-19 hospital admissions, Nov. 12-18, 2023: 3.2 per 100,000 (253 total)
> COVID-19 hospital admissions since Aug. 1, 2020: 1,026.0 per 100,000 (the lowest)
> COVID-19 deaths since January 2020: 197.4 per 100,000 (4th lowest)
> Current COVID-19 test positivity rate: 7.4% (25th lowest)

46. Florida
> New weekly COVID-19 hospital admissions, Nov. 12-18, 2023: 3.3 per 100,000 (725 total)
> COVID-19 hospital admissions since Aug. 1, 2020: 2,617.2 per 100,000 (4th highest)
> COVID-19 deaths since January 2020: 365.0 per 100,000 (23rd highest)
> Current COVID-19 test positivity rate: 6.5% (15th lowest)

45. Louisiana
> New weekly COVID-19 hospital admissions, Nov. 12-18, 2023: 3.5 per 100,000 (159 total)
> COVID-19 hospital admissions since Aug. 1, 2020: 2,128.3 per 100,000 (14th highest)
> COVID-19 deaths since January 2020: 388.6 per 100,000 (14th highest)
> Current COVID-19 test positivity rate: 3.3% (5th lowest)

44. North Carolina
> New weekly COVID-19 hospital admissions, Nov. 12-18, 2023: 3.6 per 100,000 (390 total)
> COVID-19 hospital admissions since Aug. 1, 2020: 1,617.0 per 100,000 (16th lowest)
> COVID-19 deaths since January 2020: 321.4 per 100,000 (18th lowest)
> Current COVID-19 test positivity rate: 6.5% (15th lowest)

43. Texas
> New weekly COVID-19 hospital admissions, Nov. 12-18, 2023: 3.8 per 100,000 (1,135 total)
> COVID-19 hospital admissions since Aug. 1, 2020: 2,069.8 per 100,000 (16th highest)
> COVID-19 deaths since January 2020: 343.6 per 100,000 (22nd lowest)
> Current COVID-19 test positivity rate: 3.3% (5th lowest)

42. Rhode Island
> New weekly COVID-19 hospital admissions, Nov. 12-18, 2023: 3.9 per 100,000 (43 total)
> COVID-19 hospital admissions since Aug. 1, 2020: 1,250.7 per 100,000 (5th lowest)
> COVID-19 deaths since January 2020: 368.6 per 100,000 (20th highest)
> Current COVID-19 test positivity rate: 7.4% (25th lowest)

41. Tennessee
> New weekly COVID-19 hospital admissions, Nov. 12-18, 2023: 4.2 per 100,000 (293 total)
> COVID-19 hospital admissions since Aug. 1, 2020: 1,894.3 per 100,000 (24th lowest)
> COVID-19 deaths since January 2020: 412.2 per 100,000 (10th highest)
> Current COVID-19 test positivity rate: 6.5% (15th lowest)
40. Alabama
> New weekly COVID-19 hospital admissions, Nov. 12-18, 2023: 4.2 per 100,000 (213 total)
> COVID-19 hospital admissions since Aug. 1, 2020: 2,396.9 per 100,000 (6th highest)
> COVID-19 deaths since January 2020: 445.0 per 100,000 (6th highest)
> Current COVID-19 test positivity rate: 6.5% (15th lowest)

39. Oregon
> New weekly COVID-19 hospital admissions, Nov. 12-18, 2023: 4.2 per 100,000 (178 total)
> COVID-19 hospital admissions since Aug. 1, 2020: 1,147.9 per 100,000 (4th lowest)
> COVID-19 deaths since January 2020: 224.5 per 100,000 (6th lowest)
> Current COVID-19 test positivity rate: 7.4% (25th lowest)

38. South Carolina
> New weekly COVID-19 hospital admissions, Nov. 12-18, 2023: 4.4 per 100,000 (230 total)
> COVID-19 hospital admissions since Aug. 1, 2020: 1,845.6 per 100,000 (20th lowest)
> COVID-19 deaths since January 2020: 408.2 per 100,000 (12th highest)
> Current COVID-19 test positivity rate: 6.5% (15th lowest)

37. Maine
> New weekly COVID-19 hospital admissions, Nov. 12-18, 2023: 4.4 per 100,000 (61 total)
> COVID-19 hospital admissions since Aug. 1, 2020: 1,131.0 per 100,000 (3rd lowest)
> COVID-19 deaths since January 2020: 243.1 per 100,000 (8th lowest)
> Current COVID-19 test positivity rate: 7.4% (25th lowest)
36. Delaware
> New weekly COVID-19 hospital admissions, Nov. 12-18, 2023: 4.4 per 100,000 (45 total)
> COVID-19 hospital admissions since Aug. 1, 2020: 2,025.5 per 100,000 (18th highest)
> COVID-19 deaths since January 2020: 344.9 per 100,000 (24th lowest)
> Current COVID-19 test positivity rate: 8.6% (17th highest)

35. New Hampshire
> New weekly COVID-19 hospital admissions, Nov. 12-18, 2023: 4.6 per 100,000 (64 total)
> COVID-19 hospital admissions since Aug. 1, 2020: 1,357.4 per 100,000 (6th lowest)
> COVID-19 deaths since January 2020: 240.9 per 100,000 (7th lowest)
> Current COVID-19 test positivity rate: 7.4% (25th lowest)

34. Idaho
> New weekly COVID-19 hospital admissions, Nov. 12-18, 2023: 4.6 per 100,000 (89 total)
> COVID-19 hospital admissions since Aug. 1, 2020: 1,479.8 per 100,000 (12th lowest)
> COVID-19 deaths since January 2020: 287.9 per 100,000 (13th lowest)
> Current COVID-19 test positivity rate: 7.4% (25th lowest)

33. New Jersey
> New weekly COVID-19 hospital admissions, Nov. 12-18, 2023: 4.6 per 100,000 (428 total)
> COVID-19 hospital admissions since Aug. 1, 2020: 1,917.5 per 100,000 (25th lowest)
> COVID-19 deaths since January 2020: 385.3 per 100,000 (15th highest)
> Current COVID-19 test positivity rate: 6.3% (7th lowest)

32. Maryland
> New weekly COVID-19 hospital admissions, Nov. 12-18, 2023: 4.8 per 100,000 (293 total)
> COVID-19 hospital admissions since Aug. 1, 2020: 1,602.7 per 100,000 (14th lowest)
> COVID-19 deaths since January 2020: 298.5 per 100,000 (16th lowest)
> Current COVID-19 test positivity rate: 8.6% (17th highest)

31. Arkansas
> New weekly COVID-19 hospital admissions, Nov. 12-18, 2023: 4.8 per 100,000 (147 total)
> COVID-19 hospital admissions since Aug. 1, 2020: 2,265.6 per 100,000 (8th highest)
> COVID-19 deaths since January 2020: 416.7 per 100,000 (9th highest)
> Current COVID-19 test positivity rate: 3.3% (5th lowest)

30. Utah
> New weekly COVID-19 hospital admissions, Nov. 12-18, 2023: 5.1 per 100,000 (171 total)
> COVID-19 hospital admissions since Aug. 1, 2020: 1,430.8 per 100,000 (9th lowest)
> COVID-19 deaths since January 2020: 165.4 per 100,000 (3rd lowest)
> Current COVID-19 test positivity rate: 13.0% (5th highest)

29. California
> New weekly COVID-19 hospital admissions, Nov. 12-18, 2023: 5.2 per 100,000 (2,011 total)
> COVID-19 hospital admissions since Aug. 1, 2020: 1,612.0 per 100,000 (15th lowest)
> COVID-19 deaths since January 2020: 282.1 per 100,000 (12th lowest)
> Current COVID-19 test positivity rate: 8.1% (22nd highest)

28. Virginia
> New weekly COVID-19 hospital admissions, Nov. 12-18, 2023: 5.2 per 100,000 (449 total)
> COVID-19 hospital admissions since Aug. 1, 2020: 1,449.0 per 100,000 (11th lowest)
> COVID-19 deaths since January 2020: 276.0 per 100,000 (10th lowest)
> Current COVID-19 test positivity rate: 8.6% (17th highest)

27. Nevada
> New weekly COVID-19 hospital admissions, Nov. 12-18, 2023: 5.3 per 100,000 (169 total)
> COVID-19 hospital admissions since Aug. 1, 2020: 2,060.9 per 100,000 (17th highest)
> COVID-19 deaths since January 2020: 376.1 per 100,000 (18th highest)
> Current COVID-19 test positivity rate: 8.1% (22nd highest)

26. Vermont
> New weekly COVID-19 hospital admissions, Nov. 12-18, 2023: 5.7 per 100,000 (37 total)
> COVID-19 hospital admissions since Aug. 1, 2020: 1,027.1 per 100,000 (2nd lowest)
> COVID-19 deaths since January 2020: 165.4 per 100,000 (2nd lowest)
> Current COVID-19 test positivity rate: 7.4% (25th lowest)
25. Oklahoma
> New weekly COVID-19 hospital admissions, Nov. 12-18, 2023: 5.7 per 100,000 (230 total)
> COVID-19 hospital admissions since Aug. 1, 2020: 2,780.9 per 100,000 (2nd highest)
> COVID-19 deaths since January 2020: 491.2 per 100,000 (3rd highest)
> Current COVID-19 test positivity rate: 3.3% (5th lowest)
24. Iowa
> New weekly COVID-19 hospital admissions, Nov. 12-18, 2023: 5.8 per 100,000 (186 total)
> COVID-19 hospital admissions since Aug. 1, 2020: 1,743.7 per 100,000 (19th lowest)
> COVID-19 deaths since January 2020: 351.5 per 100,000 (25th highest)
> Current COVID-19 test positivity rate: 14.1% (the highest)

23. New York
> New weekly COVID-19 hospital admissions, Nov. 12-18, 2023: 5.9 per 100,000 (1,154 total)
> COVID-19 hospital admissions since Aug. 1, 2020: 1,980.0 per 100,000 (22nd highest)
> COVID-19 deaths since January 2020: 417.2 per 100,000 (8th highest)
> Current COVID-19 test positivity rate: 6.3% (7th lowest)

22. Michigan
> New weekly COVID-19 hospital admissions, Nov. 12-18, 2023: 6.3 per 100,000 (628 total)
> COVID-19 hospital admissions since Aug. 1, 2020: 1,970.4 per 100,000 (23rd highest)
> COVID-19 deaths since January 2020: 380.2 per 100,000 (17th highest)
> Current COVID-19 test positivity rate: 12.5% (11th highest)

21. Indiana
> New weekly COVID-19 hospital admissions, Nov. 12-18, 2023: 6.4 per 100,000 (435 total)
> COVID-19 hospital admissions since Aug. 1, 2020: 2,084.2 per 100,000 (15th highest)
> COVID-19 deaths since January 2020: 384.4 per 100,000 (16th highest)
> Current COVID-19 test positivity rate: 12.5% (11th highest)

20. Wyoming
> New weekly COVID-19 hospital admissions, Nov. 12-18, 2023: 6.7 per 100,000 (39 total)
> COVID-19 hospital admissions since Aug. 1, 2020: 2,013.5 per 100,000 (19th highest)
> COVID-19 deaths since January 2020: 374.6 per 100,000 (19th highest)
> Current COVID-19 test positivity rate: 13.0% (5th highest)

19. Pennsylvania
> New weekly COVID-19 hospital admissions, Nov. 12-18, 2023: 6.8 per 100,000 (881 total)
> COVID-19 hospital admissions since Aug. 1, 2020: 1,944.2 per 100,000 (24th highest)
> COVID-19 deaths since January 2020: 411.9 per 100,000 (11th highest)
> Current COVID-19 test positivity rate: 8.6% (17th highest)

18. Minnesota
> New weekly COVID-19 hospital admissions, Nov. 12-18, 2023: 6.8 per 100,000 (389 total)
> COVID-19 hospital admissions since Aug. 1, 2020: 1,426.2 per 100,000 (8th lowest)
> COVID-19 deaths since January 2020: 276.5 per 100,000 (11th lowest)
> Current COVID-19 test positivity rate: 12.5% (11th highest)

17. Massachusetts
> New weekly COVID-19 hospital admissions, Nov. 12-18, 2023: 6.9 per 100,000 (482 total)
> COVID-19 hospital admissions since Aug. 1, 2020: 1,555.6 per 100,000 (13th lowest)
> COVID-19 deaths since January 2020: 305.1 per 100,000 (17th lowest)
> Current COVID-19 test positivity rate: 7.4% (25th lowest)

16. Connecticut
> New weekly COVID-19 hospital admissions, Nov. 12-18, 2023: 7.2 per 100,000 (261 total)
> COVID-19 hospital admissions since Aug. 1, 2020: 1,848.2 per 100,000 (21st lowest)
> COVID-19 deaths since January 2020: 344.1 per 100,000 (23rd lowest)
> Current COVID-19 test positivity rate: 7.4% (25th lowest)

15. Illinois
> New weekly COVID-19 hospital admissions, Nov. 12-18, 2023: 7.2 per 100,000 (908 total)
> COVID-19 hospital admissions since Aug. 1, 2020: 1,873.9 per 100,000 (23rd lowest)
> COVID-19 deaths since January 2020: 324.3 per 100,000 (19th lowest)
> Current COVID-19 test positivity rate: 12.5% (11th highest)

14. Missouri
> New weekly COVID-19 hospital admissions, Nov. 12-18, 2023: 7.3 per 100,000 (451 total)
> COVID-19 hospital admissions since Aug. 1, 2020: 2,173.0 per 100,000 (12th highest)
> COVID-19 deaths since January 2020: 368.5 per 100,000 (21st highest)
> Current COVID-19 test positivity rate: 14.1% (the highest)

13. Ohio
> New weekly COVID-19 hospital admissions, Nov. 12-18, 2023: 7.6 per 100,000 (889 total)
> COVID-19 hospital admissions since Aug. 1, 2020: 2,273.4 per 100,000 (7th highest)
> COVID-19 deaths since January 2020: 428.1 per 100,000 (7th highest)
> Current COVID-19 test positivity rate: 12.5% (11th highest)

12. Arizona
> New weekly COVID-19 hospital admissions, Nov. 12-18, 2023: 7.7 per 100,000 (565 total)
> COVID-19 hospital admissions since Aug. 1, 2020: 2,138.7 per 100,000 (13th highest)
> COVID-19 deaths since January 2020: 407.3 per 100,000 (13th highest)
> Current COVID-19 test positivity rate: 8.1% (22nd highest)
11. Nebraska
> New weekly COVID-19 hospital admissions, Nov. 12-18, 2023: 7.8 per 100,000 (154 total)
> COVID-19 hospital admissions since Aug. 1, 2020: 1,655.0 per 100,000 (17th lowest)
> COVID-19 deaths since January 2020: 296.4 per 100,000 (15th lowest)
> Current COVID-19 test positivity rate: 14.1% (the highest)
10. Kansas
> New weekly COVID-19 hospital admissions, Nov. 12-18, 2023: 8.0 per 100,000 (235 total)
> COVID-19 hospital admissions since Aug. 1, 2020: 1,998.2 per 100,000 (20th highest)
> COVID-19 deaths since January 2020: 364.4 per 100,000 (24th highest)
> Current COVID-19 test positivity rate: 14.1% (the highest)

9. Wisconsin
> New weekly COVID-19 hospital admissions, Nov. 12-18, 2023: 8.0 per 100,000 (473 total)
> COVID-19 hospital admissions since Aug. 1, 2020: 2,204.0 per 100,000 (10th highest)
> COVID-19 deaths since January 2020: 294.5 per 100,000 (14th lowest)
> Current COVID-19 test positivity rate: 12.5% (11th highest)

8. Kentucky
> New weekly COVID-19 hospital admissions, Nov. 12-18, 2023: 8.1 per 100,000 (365 total)
> COVID-19 hospital admissions since Aug. 1, 2020: 3,516.0 per 100,000 (the highest)
> COVID-19 deaths since January 2020: 449.9 per 100,000 (4th highest)
> Current COVID-19 test positivity rate: 6.5% (15th lowest)

7. Montana
> New weekly COVID-19 hospital admissions, Nov. 12-18, 2023: 8.3 per 100,000 (93 total)
> COVID-19 hospital admissions since Aug. 1, 2020: 2,759.5 per 100,000 (3rd highest)
> COVID-19 deaths since January 2020: 349.6 per 100,000 (25th lowest)
> Current COVID-19 test positivity rate: 13.0% (5th highest)

6. Hawaii
> New weekly COVID-19 hospital admissions, Nov. 12-18, 2023: 8.3 per 100,000 (120 total)
> COVID-19 hospital admissions since Aug. 1, 2020: 1,431.0 per 100,000 (10th lowest)
> COVID-19 deaths since January 2020: 140.5 per 100,000 (the lowest)
> Current COVID-19 test positivity rate: 8.1% (22nd highest)

5. South Dakota
> New weekly COVID-19 hospital admissions, Nov. 12-18, 2023: 8.4 per 100,000 (76 total)
> COVID-19 hospital admissions since Aug. 1, 2020: 2,182.2 per 100,000 (11th highest)
> COVID-19 deaths since January 2020: 365.2 per 100,000 (22nd highest)
> Current COVID-19 test positivity rate: 13.0% (5th highest)
4. Colorado
> New weekly COVID-19 hospital admissions, Nov. 12-18, 2023: 8.6 per 100,000 (504 total)
> COVID-19 hospital admissions since Aug. 1, 2020: 1,725.4 per 100,000 (18th lowest)
> COVID-19 deaths since January 2020: 260.3 per 100,000 (9th lowest)
> Current COVID-19 test positivity rate: 13.0% (5th highest)

3. New Mexico
> New weekly COVID-19 hospital admissions, Nov. 12-18, 2023: 8.7 per 100,000 (183 total)
> COVID-19 hospital admissions since Aug. 1, 2020: 1,870.7 per 100,000 (22nd lowest)
> COVID-19 deaths since January 2020: 446.4 per 100,000 (5th highest)
> Current COVID-19 test positivity rate: 3.3% (5th lowest)
2. North Dakota
> New weekly COVID-19 hospital admissions, Nov. 12-18, 2023: 9.5 per 100,000 (74 total)
> COVID-19 hospital admissions since Aug. 1, 2020: 1,991.9 per 100,000 (21st highest)
> COVID-19 deaths since January 2020: 342.5 per 100,000 (21st lowest)
> Current COVID-19 test positivity rate: 13.0% (5th highest)
1. West Virginia
> New weekly COVID-19 hospital admissions, Nov. 12-18, 2023: 12.1 per 100,000 (214 total)
> COVID-19 hospital admissions since Aug. 1, 2020: 2,479.9 per 100,000 (5th highest)
> COVID-19 deaths since January 2020: 494.6 per 100,000 (2nd highest)
> Current COVID-19 test positivity rate: 8.6% (17th highest)


