Punxsutawney Phil, the groundhog who “predicts” how much longer winter will last when he emerges from his burrow in Gobbler’s Knob, PA, each Feb. 2, didn’t see his shadow this year – meaning, they say, that we’ll have an early spring.
Maybe so. We’ll see. But in the meantime, it’s still very obviously winter in much of the United States, and that means it’s still COVID season. Why does the coronavirus thrive in colder temperatures? One major factor is that people are more likely to spend time indoors, especially (though not only) during holiday gatherings. Being together with others in an enclosed space, probably not well-ventilated because who needs those icy blasts coming through, definitely increases the possibilities for transmission of disease.
There are other reasons why COVID likes the cold, though. The size of virus-bearing droplets, released when people sneeze or cough, shrinks significantly when humidity drops, as it does in winter, allowing the germs to spread farther. The cold also lessens the efficiency of the cilia, or tiny hairs, in the nasal passages that help keep infection at bay. As if that weren’t enough, we’re also at increased risk due to reduced sunlight: The sun stimulates the production of vitamin D, vital to a strong immune response, and both the sun’s heat and its ultraviolet rays actually render some viruses less powerful.
Of course, climate isn’t the only factor determining an area’s susceptibility to COVID. Demographic and cultural factors may also be in play, as is demonstrated by a comparison of new infection rates between the states.
To determine the states where the COVID-19 surge is the worst right now, 24/7 Tempo consulted data from the Centers for Disease Control and Prevention on the number of new hospital admissions due to COVID-19 per 100,000 state residents for the week of Jan. 28-Feb. 3, 2024.
The states with the lowest rates of new COVID-related hospital admissions, Montana and Wyoming, are the two most sparsely populated states in the continental U.S. (only Alaska has a lower population density), a fact which may contribute to their position in this week’s ranking. It should be noted, though, that Wyoming’s rate has actually increased slightly, from 2.9 admissions per 100,000 residents to 3.1, while Montana’s has dropped from 4.9 last week to 3.0. (Click here to see last week’s ranking of states where COVID-19 is the worst.)
On the other end of things, Florida, formerly in the No. 4 position, now leads the nation in new hospital admissions related to COVID, with 8.9 per 100,000. This may simply reflect the fact that it has a particularly large population of adults over 65, who are at increased risk due to their age and the fact that they are more likely to suffer from co-morbidities like diabetes or cancer. It should be noted, though, that the Sunshine State also has a historically low vaccination rate, and that Florida’s surgeon general called for the cessation of COVID vaccinations earlier this year, based on the spurious claim that the vaccines contain contaminants that can damage human DNA.
Methodology
To determine the states where the COVID-19 surge is the worst right now, 24/7 Tempo reviewed data on recent COVID-19 hospital admissions from the Centers for Disease Control and Prevention. States were ranked based on the number of new hospital admissions due to COVID-19 per 100,000 state residents for the week of Jan. 28-Feb. 3, 2024. Supplemental data on the total number of recorded COVID-19 hospital admissions since Aug. 1, 2020; the total number of deaths due to COVID-19 since January 2020; and the COVID-19 test positivity rate for the week of Jan. 28-Feb. 3, 2024 also came from the CDC. It should be noted that this metric is widely considered to be inaccurate today, due to the closing down of many official testing centers and the fact that the results of home tests are rarely reported. Population data used to adjust hospital admission and death counts per capita came from the U.S. Census Bureau’s Population and Housing Unit Estimates program and is for July 1, 2022.
Here are the states where the COVID-19 surge is the worst:
50. Montana

- New weekly COVID-19 hospital admissions, Jan. 28-Feb. 3, 2024: 3.0 per 100,000 (34 total)
- COVID-19 hospital admissions since Aug. 1, 2020: 2,847.0 per 100,000 (3rd highest)
- COVID-19 deaths since January 2020: 357.1 per 100,000 (25th lowest)
- Current COVID-19 test positivity rate: 8.8% (16th lowest)
49. Wyoming

- New weekly COVID-19 hospital admissions, Jan. 28-Feb. 3, 2024: 3.1 per 100,000 (18 total)
- COVID-19 hospital admissions since Aug. 1, 2020: 2,079.5 per 100,000 (22nd highest)
- COVID-19 deaths since January 2020: 383.6 per 100,000 (19th highest)
- Current COVID-19 test positivity rate: 8.8% (16th lowest)
48. New Mexico

- New weekly COVID-19 hospital admissions, Jan. 28-Feb. 3, 2024: 3.3 per 100,000 (70 total)
- COVID-19 hospital admissions since Aug. 1, 2020: 1,929.2 per 100,000 (21st lowest)
- COVID-19 deaths since January 2020: 454.3 per 100,000 (5th highest)
- Current COVID-19 test positivity rate: 11.4% (11th highest)
47. Utah

- New weekly COVID-19 hospital admissions, Jan. 28-Feb. 3, 2024: 3.7 per 100,000 (125 total)
- COVID-19 hospital admissions since Aug. 1, 2020: 1,495.4 per 100,000 (8th lowest)
- COVID-19 deaths since January 2020: 168.8 per 100,000 (2nd lowest)
- Current COVID-19 test positivity rate: 8.8% (16th lowest)
46. Iowa

- New weekly COVID-19 hospital admissions, Jan. 28-Feb. 3, 2024: 4.0 per 100,000 (129 total)
- COVID-19 hospital admissions since Aug. 1, 2020: 1,845.4 per 100,000 (19th lowest)
- COVID-19 deaths since January 2020: 361.9 per 100,000 (25th highest)
- Current COVID-19 test positivity rate: 8.6% (4th lowest)
45. Kansas
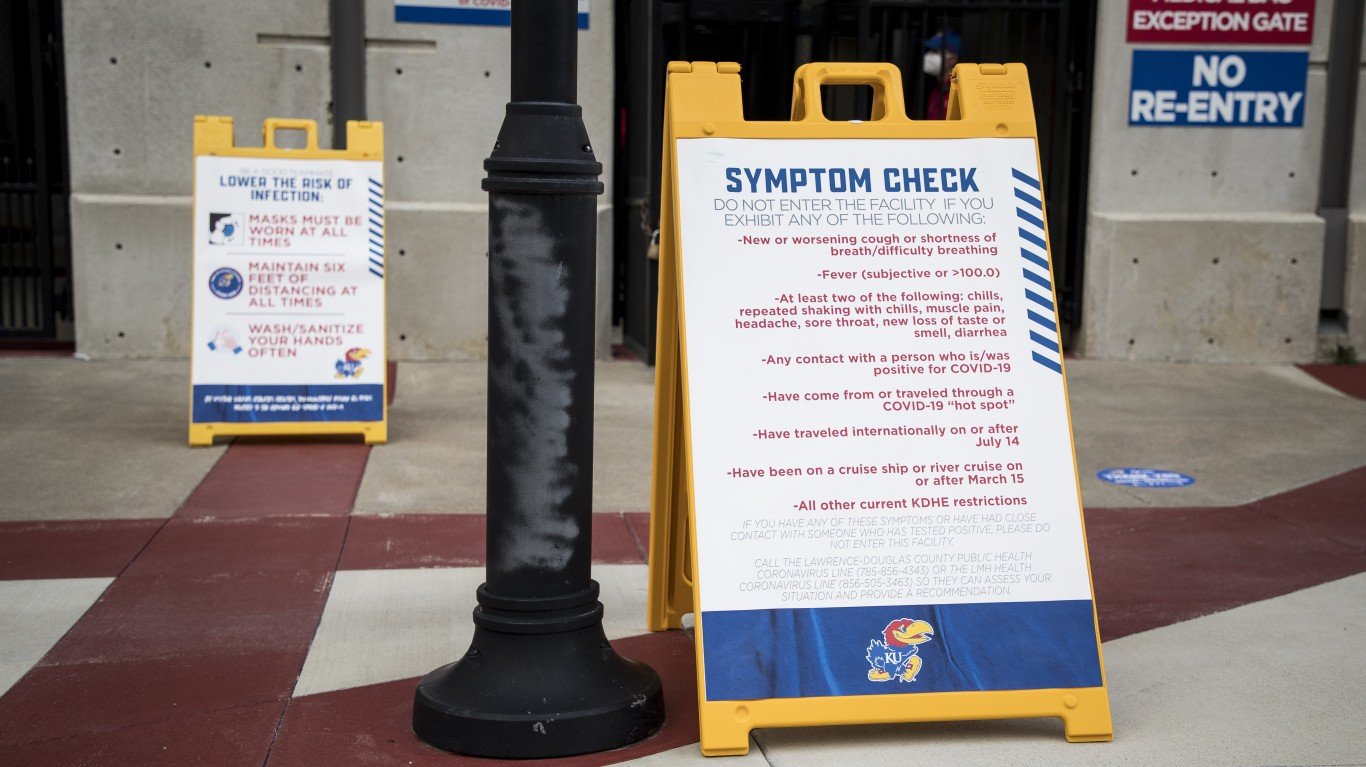
- New weekly COVID-19 hospital admissions, Jan. 28-Feb. 3, 2024: 4.2 per 100,000 (124 total)
- COVID-19 hospital admissions since Aug. 1, 2020: 2,084.2 per 100,000 (21st highest)
- COVID-19 deaths since January 2020: 372.3 per 100,000 (23rd highest)
- Current COVID-19 test positivity rate: 8.6% (4th lowest)
44. Idaho

- New weekly COVID-19 hospital admissions, Jan. 28-Feb. 3, 2024: 4.2 per 100,000 (82 total)
- COVID-19 hospital admissions since Aug. 1, 2020: 1,562.8 per 100,000 (12th lowest)
- COVID-19 deaths since January 2020: 293.2 per 100,000 (13th lowest)
- Current COVID-19 test positivity rate: 9.8% (16th highest)
43. Colorado

- New weekly COVID-19 hospital admissions, Jan. 28-Feb. 3, 2024: 4.3 per 100,000 (252 total)
- COVID-19 hospital admissions since Aug. 1, 2020: 1,803.0 per 100,000 (18th lowest)
- COVID-19 deaths since January 2020: 265.8 per 100,000 (9th lowest)
- Current COVID-19 test positivity rate: 8.8% (16th lowest)
42. North Dakota

- New weekly COVID-19 hospital admissions, Jan. 28-Feb. 3, 2024: 4.4 per 100,000 (34 total)
- COVID-19 hospital admissions since Aug. 1, 2020: 2,093.7 per 100,000 (20th highest)
- COVID-19 deaths since January 2020: 348.3 per 100,000 (22nd lowest)
- Current COVID-19 test positivity rate: 8.8% (16th lowest)
41. Maine

- New weekly COVID-19 hospital admissions, Jan. 28-Feb. 3, 2024: 4.4 per 100,000 (61 total)
- COVID-19 hospital admissions since Aug. 1, 2020: 1,206.4 per 100,000 (4th lowest)
- COVID-19 deaths since January 2020: 254.5 per 100,000 (8th lowest)
- Current COVID-19 test positivity rate: 8.7% (10th lowest)
40. Washington

- New weekly COVID-19 hospital admissions, Jan. 28-Feb. 3, 2024: 4.6 per 100,000 (356 total)
- COVID-19 hospital admissions since Aug. 1, 2020: 1,072.7 per 100,000 (the lowest)
- COVID-19 deaths since January 2020: 202.0 per 100,000 (4th lowest)
- Current COVID-19 test positivity rate: 9.8% (16th highest)
39. Oregon

- New weekly COVID-19 hospital admissions, Jan. 28-Feb. 3, 2024: 4.6 per 100,000 (195 total)
- COVID-19 hospital admissions since Aug. 1, 2020: 1,205.4 per 100,000 (3rd lowest)
- COVID-19 deaths since January 2020: 229.6 per 100,000 (6th lowest)
- Current COVID-19 test positivity rate: 9.8% (16th highest)
38. Nevada

- New weekly COVID-19 hospital admissions, Jan. 28-Feb. 3, 2024: 4.7 per 100,000 (148 total)
- COVID-19 hospital admissions since Aug. 1, 2020: 2,130.2 per 100,000 (17th highest)
- COVID-19 deaths since January 2020: 383.9 per 100,000 (18th highest)
- Current COVID-19 test positivity rate: 9.5% (25th lowest)
37. Minnesota

- New weekly COVID-19 hospital admissions, Jan. 28-Feb. 3, 2024: 4.7 per 100,000 (269 total)
- COVID-19 hospital admissions since Aug. 1, 2020: 1,510.2 per 100,000 (10th lowest)
- COVID-19 deaths since January 2020: 284.9 per 100,000 (11th lowest)
- Current COVID-19 test positivity rate: 9.6% (20th highest)
36. Mississippi

- New weekly COVID-19 hospital admissions, Jan. 28-Feb. 3, 2024: 4.8 per 100,000 (141 total)
- COVID-19 hospital admissions since Aug. 1, 2020: 1,987.3 per 100,000 (25th lowest)
- COVID-19 deaths since January 2020: 520.4 per 100,000 (the highest)
- Current COVID-19 test positivity rate: 11.6% (3rd highest)
35. Indiana

- New weekly COVID-19 hospital admissions, Jan. 28-Feb. 3, 2024: 4.9 per 100,000 (332 total)
- COVID-19 hospital admissions since Aug. 1, 2020: 2,185.7 per 100,000 (15th highest)
- COVID-19 deaths since January 2020: 393.6 per 100,000 (14th highest)
- Current COVID-19 test positivity rate: 9.6% (20th highest)
34. Tennessee

- New weekly COVID-19 hospital admissions, Jan. 28-Feb. 3, 2024: 4.9 per 100,000 (348 total)
- COVID-19 hospital admissions since Aug. 1, 2020: 1,969.0 per 100,000 (23rd lowest)
- COVID-19 deaths since January 2020: 419.9 per 100,000 (11th highest)
- Current COVID-19 test positivity rate: 11.6% (3rd highest)
33. Delaware

- New weekly COVID-19 hospital admissions, Jan. 28-Feb. 3, 2024: 5.0 per 100,000 (51 total)
- COVID-19 hospital admissions since Aug. 1, 2020: 2,112.6 per 100,000 (18th highest)
- COVID-19 deaths since January 2020: 353.4 per 100,000 (24th lowest)
- Current COVID-19 test positivity rate: 9.4% (21st lowest)
32. Illinois

- New weekly COVID-19 hospital admissions, Jan. 28-Feb. 3, 2024: 5.1 per 100,000 (647 total)
- COVID-19 hospital admissions since Aug. 1, 2020: 1,980.8 per 100,000 (24th lowest)
- COVID-19 deaths since January 2020: 330.9 per 100,000 (19th lowest)
- Current COVID-19 test positivity rate: 9.6% (20th highest)
31. Arizona

- New weekly COVID-19 hospital admissions, Jan. 28-Feb. 3, 2024: 5.2 per 100,000 (383 total)
- COVID-19 hospital admissions since Aug. 1, 2020: 2,215.6 per 100,000 (13th highest)
- COVID-19 deaths since January 2020: 413.2 per 100,000 (13th highest)
- Current COVID-19 test positivity rate: 9.5% (25th lowest)
30. Maryland

- New weekly COVID-19 hospital admissions, Jan. 28-Feb. 3, 2024: 5.3 per 100,000 (324 total)
- COVID-19 hospital admissions since Aug. 1, 2020: 1,682.0 per 100,000 (14th lowest)
- COVID-19 deaths since January 2020: 306.6 per 100,000 (16th lowest)
- Current COVID-19 test positivity rate: 9.4% (21st lowest)
29. New Hampshire
- New weekly COVID-19 hospital admissions, Jan. 28-Feb. 3, 2024: 5.4 per 100,000 (76 total)
- COVID-19 hospital admissions since Aug. 1, 2020: 1,440.6 per 100,000 (7th lowest)
- COVID-19 deaths since January 2020: 248.7 per 100,000 (7th lowest)
- Current COVID-19 test positivity rate: 8.7% (10th lowest)
28. Wisconsin

- New weekly COVID-19 hospital admissions, Jan. 28-Feb. 3, 2024: 5.5 per 100,000 (323 total)
- COVID-19 hospital admissions since Aug. 1, 2020: 2,302.7 per 100,000 (10th highest)
- COVID-19 deaths since January 2020: 301.7 per 100,000 (14th lowest)
- Current COVID-19 test positivity rate: 9.6% (20th highest)
27. Ohio

- New weekly COVID-19 hospital admissions, Jan. 28-Feb. 3, 2024: 5.6 per 100,000 (655 total)
- COVID-19 hospital admissions since Aug. 1, 2020: 2,385.4 per 100,000 (7th highest)
- COVID-19 deaths since January 2020: 436.7 per 100,000 (7th highest)
- Current COVID-19 test positivity rate: 9.6% (20th highest)
26. Rhode Island

- New weekly COVID-19 hospital admissions, Jan. 28-Feb. 3, 2024: 5.7 per 100,000 (62 total)
- COVID-19 hospital admissions since Aug. 1, 2020: 1,335.5 per 100,000 (5th lowest)
- COVID-19 deaths since January 2020: 374.7 per 100,000 (21st highest)
- Current COVID-19 test positivity rate: 8.7% (10th lowest)
25. California

- New weekly COVID-19 hospital admissions, Jan. 28-Feb. 3, 2024: 5.8 per 100,000 (2,281 total)
- COVID-19 hospital admissions since Aug. 1, 2020: 1,694.3 per 100,000 (16th lowest)
- COVID-19 deaths since January 2020: 286.7 per 100,000 (12th lowest)
- Current COVID-19 test positivity rate: 9.5% (25th lowest)
24. Nebraska

- New weekly COVID-19 hospital admissions, Jan. 28-Feb. 3, 2024: 5.9 per 100,000 (117 total)
- COVID-19 hospital admissions since Aug. 1, 2020: 1,753.1 per 100,000 (17th lowest)
- COVID-19 deaths since January 2020: 304.1 per 100,000 (15th lowest)
- Current COVID-19 test positivity rate: 8.6% (4th lowest)
23. Oklahoma

- New weekly COVID-19 hospital admissions, Jan. 28-Feb. 3, 2024: 6.0 per 100,000 (240 total)
- COVID-19 hospital admissions since Aug. 1, 2020: 2,870.0 per 100,000 (2nd highest)
- COVID-19 deaths since January 2020: 501.0 per 100,000 (3rd highest)
- Current COVID-19 test positivity rate: 11.4% (11th highest)
22. Kentucky

- New weekly COVID-19 hospital admissions, Jan. 28-Feb. 3, 2024: 6.0 per 100,000 (271 total)
- COVID-19 hospital admissions since Aug. 1, 2020: 3,623.3 per 100,000 (the highest)
- COVID-19 deaths since January 2020: 462.7 per 100,000 (4th highest)
- Current COVID-19 test positivity rate: 11.6% (3rd highest)
21. Arkansas

- New weekly COVID-19 hospital admissions, Jan. 28-Feb. 3, 2024: 6.0 per 100,000 (183 total)
- COVID-19 hospital admissions since Aug. 1, 2020: 2,356.7 per 100,000 (8th highest)
- COVID-19 deaths since January 2020: 424.0 per 100,000 (9th highest)
- Current COVID-19 test positivity rate: 11.4% (11th highest)
20. Pennsylvania
- New weekly COVID-19 hospital admissions, Jan. 28-Feb. 3, 2024: 6.2 per 100,000 (802 total)
- COVID-19 hospital admissions since Aug. 1, 2020: 2,042.4 per 100,000 (24th highest)
- COVID-19 deaths since January 2020: 421.0 per 100,000 (10th highest)
- Current COVID-19 test positivity rate: 9.4% (21st lowest)
19. Michigan

- New weekly COVID-19 hospital admissions, Jan. 28-Feb. 3, 2024: 6.3 per 100,000 (629 total)
- COVID-19 hospital admissions since Aug. 1, 2020: 2,075.6 per 100,000 (23rd highest)
- COVID-19 deaths since January 2020: 389.2 per 100,000 (17th highest)
- Current COVID-19 test positivity rate: 9.6% (20th highest)
18. North Carolina

- New weekly COVID-19 hospital admissions, Jan. 28-Feb. 3, 2024: 6.3 per 100,000 (671 total)
- COVID-19 hospital admissions since Aug. 1, 2020: 1,685.3 per 100,000 (15th lowest)
- COVID-19 deaths since January 2020: 329.0 per 100,000 (18th lowest)
- Current COVID-19 test positivity rate: 11.6% (3rd highest)
17. Vermont

- New weekly COVID-19 hospital admissions, Jan. 28-Feb. 3, 2024: 6.3 per 100,000 (41 total)
- COVID-19 hospital admissions since Aug. 1, 2020: 1,108.9 per 100,000 (2nd lowest)
- COVID-19 deaths since January 2020: 174.5 per 100,000 (3rd lowest)
- Current COVID-19 test positivity rate: 8.7% (10th lowest)
16. Missouri

- New weekly COVID-19 hospital admissions, Jan. 28-Feb. 3, 2024: 6.4 per 100,000 (395 total)
- COVID-19 hospital admissions since Aug. 1, 2020: 2,288.1 per 100,000 (12th highest)
- COVID-19 deaths since January 2020: 376.8 per 100,000 (20th highest)
- Current COVID-19 test positivity rate: 8.6% (4th lowest)
15. Hawaii

- New weekly COVID-19 hospital admissions, Jan. 28-Feb. 3, 2024: 6.5 per 100,000 (93 total)
- COVID-19 hospital admissions since Aug. 1, 2020: 1,498.3 per 100,000 (9th lowest)
- COVID-19 deaths since January 2020: 142.9 per 100,000 (the lowest)
- Current COVID-19 test positivity rate: 9.5% (25th lowest)
14. Texas

- New weekly COVID-19 hospital admissions, Jan. 28-Feb. 3, 2024: 6.5 per 100,000 (1,962 total)
- COVID-19 hospital admissions since Aug. 1, 2020: 2,131.4 per 100,000 (16th highest)
- COVID-19 deaths since January 2020: 346.7 per 100,000 (21st lowest)
- Current COVID-19 test positivity rate: 11.4% (11th highest)
13. Alaska
- New weekly COVID-19 hospital admissions, Jan. 28-Feb. 3, 2024: 6.5 per 100,000 (48 total)
- COVID-19 hospital admissions since Aug. 1, 2020: 1,407.3 per 100,000 (6th lowest)
- COVID-19 deaths since January 2020: 212.1 per 100,000 (5th lowest)
- Current COVID-19 test positivity rate: 9.8% (16th highest)
12. Alabama
- New weekly COVID-19 hospital admissions, Jan. 28-Feb. 3, 2024: 6.7 per 100,000 (338 total)
- COVID-19 hospital admissions since Aug. 1, 2020: 2,481.3 per 100,000 (6th highest)
- COVID-19 deaths since January 2020: 451.7 per 100,000 (6th highest)
- Current COVID-19 test positivity rate: 11.6% (3rd highest)
11. Louisiana

- New weekly COVID-19 hospital admissions, Jan. 28-Feb. 3, 2024: 6.7 per 100,000 (306 total)
- COVID-19 hospital admissions since Aug. 1, 2020: 2,197.8 per 100,000 (14th highest)
- COVID-19 deaths since January 2020: 393.2 per 100,000 (15th highest)
- Current COVID-19 test positivity rate: 11.4% (11th highest)
10. West Virginia

- New weekly COVID-19 hospital admissions, Jan. 28-Feb. 3, 2024: 6.7 per 100,000 (119 total)
- COVID-19 hospital admissions since Aug. 1, 2020: 2,638.0 per 100,000 (5th highest)
- COVID-19 deaths since January 2020: 506.9 per 100,000 (2nd highest)
- Current COVID-19 test positivity rate: 9.4% (21st lowest)
9. Virginia

- New weekly COVID-19 hospital admissions, Jan. 28-Feb. 3, 2024: 6.8 per 100,000 (588 total)
- COVID-19 hospital admissions since Aug. 1, 2020: 1,540.4 per 100,000 (11th lowest)
- COVID-19 deaths since January 2020: 283.4 per 100,000 (10th lowest)
- Current COVID-19 test positivity rate: 9.4% (21st lowest)
8. Georgia

- New weekly COVID-19 hospital admissions, Jan. 28-Feb. 3, 2024: 6.8 per 100,000 (740 total)
- COVID-19 hospital admissions since Aug. 1, 2020: 2,302.5 per 100,000 (11th highest)
- COVID-19 deaths since January 2020: 339.3 per 100,000 (20th lowest)
- Current COVID-19 test positivity rate: 11.6% (3rd highest)
7. Connecticut

- New weekly COVID-19 hospital admissions, Jan. 28-Feb. 3, 2024: 7.3 per 100,000 (264 total)
- COVID-19 hospital admissions since Aug. 1, 2020: 1,958.5 per 100,000 (22nd lowest)
- COVID-19 deaths since January 2020: 351.1 per 100,000 (23rd lowest)
- Current COVID-19 test positivity rate: 8.7% (10th lowest)
6. South Carolina

- New weekly COVID-19 hospital admissions, Jan. 28-Feb. 3, 2024: 7.4 per 100,000 (392 total)
- COVID-19 hospital admissions since Aug. 1, 2020: 1,924.2 per 100,000 (20th lowest)
- COVID-19 deaths since January 2020: 414.3 per 100,000 (12th highest)
- Current COVID-19 test positivity rate: 11.6% (3rd highest)
5. Massachusetts

- New weekly COVID-19 hospital admissions, Jan. 28-Feb. 3, 2024: 7.6 per 100,000 (534 total)
- COVID-19 hospital admissions since Aug. 1, 2020: 1,670.0 per 100,000 (13th lowest)
- COVID-19 deaths since January 2020: 312.3 per 100,000 (17th lowest)
- Current COVID-19 test positivity rate: 8.7% (10th lowest)
4. New York

- New weekly COVID-19 hospital admissions, Jan. 28-Feb. 3, 2024: 7.9 per 100,000 (1,555 total)
- COVID-19 hospital admissions since Aug. 1, 2020: 2,097.2 per 100,000 (19th highest)
- COVID-19 deaths since January 2020: 424.6 per 100,000 (8th highest)
- Current COVID-19 test positivity rate: 15.6% (the highest)
3. South Dakota

- New weekly COVID-19 hospital admissions, Jan. 28-Feb. 3, 2024: 7.9 per 100,000 (72 total)
- COVID-19 hospital admissions since Aug. 1, 2020: 2,310.0 per 100,000 (9th highest)
- COVID-19 deaths since January 2020: 372.6 per 100,000 (22nd highest)
- Current COVID-19 test positivity rate: 8.8% (16th lowest)
2. New Jersey

- New weekly COVID-19 hospital admissions, Jan. 28-Feb. 3, 2024: 8.2 per 100,000 (763 total)
- COVID-19 hospital admissions since Aug. 1, 2020: 2,029.9 per 100,000 (25th highest)
- COVID-19 deaths since January 2020: 391.9 per 100,000 (16th highest)
- Current COVID-19 test positivity rate: 15.6% (the highest)
1. Florida

- New weekly COVID-19 hospital admissions, Jan. 28-Feb. 3, 2024: 8.7 per 100,000 (1,927 total)
- COVID-19 hospital admissions since Aug. 1, 2020: 2,693.2 per 100,000 (4th highest)
- COVID-19 deaths since January 2020: 369.3 per 100,000 (24th highest)
- Current COVID-19 test positivity rate: 11.6% (3rd highest)
