
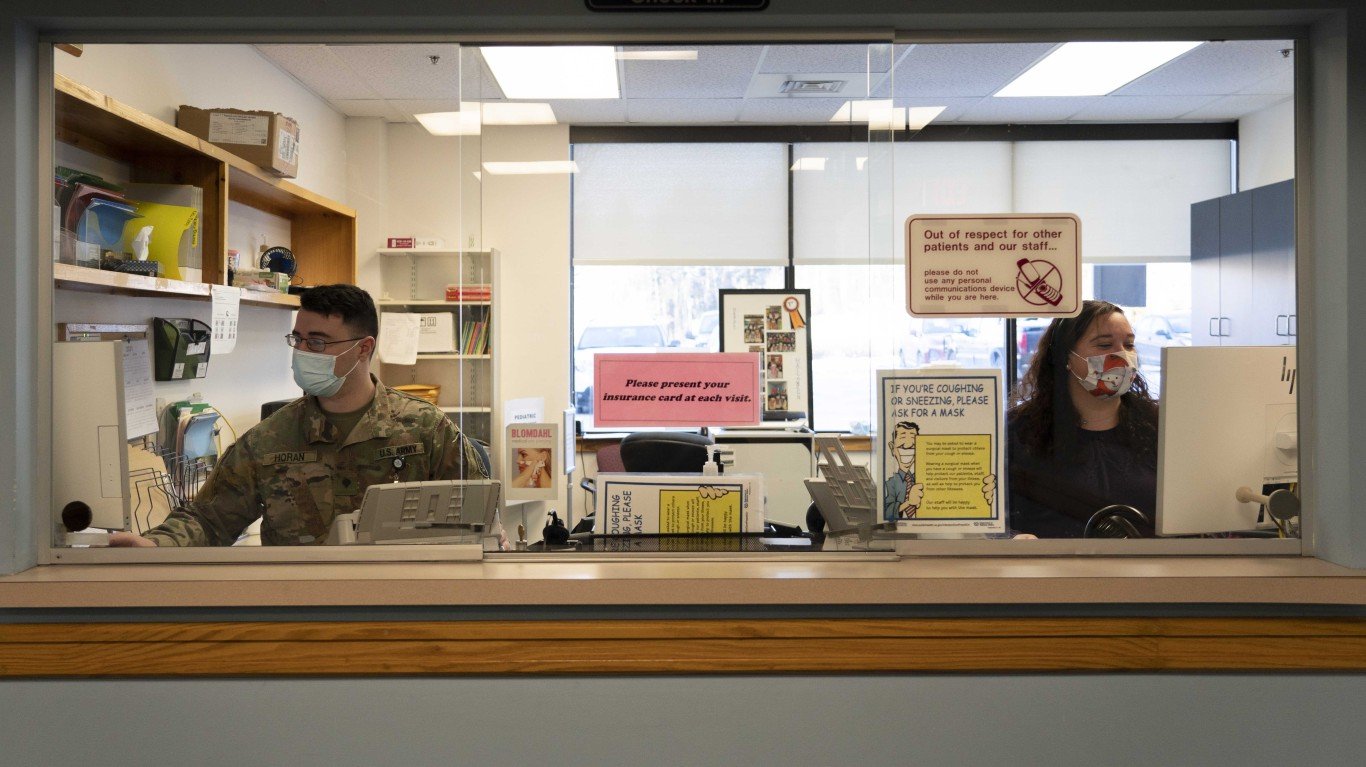
The good news for anyone who chafed under pandemic restrictions is that the few that remain are loosening all the time. Last week, the Centers for Disease Control and Prevention announced that it plans to do away with its longstanding COVID isolation guidelines, as early as April, pending White House approval. Instead of recommending that those who test positive for the coronavirus remain at home, away from work or school, for a minimum of five days after testing, the new guidelines now peg the isolation period to symptoms. If the afflicted have been free of fever for at least 24 hours without medication and their other symptoms are mild or improving, they can end isolation.
The change would not apply to hospitals, and should likely be disregarded by those who would come in contact with those who are over 65, immunocompromised, or suffering from cancer or other serious diseases.
The new protocol, which echoes advice in place for those with the flu or RSV, brings the CDC’s recommendations in line with changes already adopted in Oregon and California — though the latter state still asks anyone who tests positive to wear a mask indoors when around groups for 10 days after a positive test.
The CDC does still recommend that anyone six months of age or older get the latest COVID-19 booster shot, however — though the uptake has been very slow, with only about 20% of Americans having received the booster as of early February. Fortunately, it appears that a large segment of the population has a measure of immunity now, through inoculations or because they’ve already had COVID or both.
Nonetheless, people across the country are still being admitted to hospitals for COVID and, unfortunately, still sometimes succumbing to it. To determine the states where the COVID-19 surge is the worst right now, 24/7 Tempo consulted data from the CDC on the number of new hospital admissions due to COVID-19 per 100,000 state residents for the week of Feb. 4-Feb. 10, 2024.
As was the case last week, states with smaller populations occupy the bottom few places on this list — in this case New Mexico, Utah, and Idaho. Last week, the last three states on the list were Montana, Wyoming, and New Mexico, but this week, Montana’s hospital admissions have risen to 4.3 per 100,000 residents, from 3.0, to put it in 41st place. Wyoming has seen an even greater surge, taking 31st place with 5.5 admissions, versus last week’s 3.1. (For a comprehensive look at last week’s numbers, see our previous ranking of states where COVID-19 was the worst.)
On the high end, third place is now occupied by Arkansas, with 8.3 admissions per 100,000, a considerable increase from last week’s 6.0, when it was 21st on the list. New York, which was No. 4 last week with 7.9 admissions is now No. 1 with 8.5 — while Florida has shown a slight improvement, moving from first to second place, with 8.5 admissions compared with last week’s 8.7.
Methodology
To determine the states where the COVID-19 surge is the worst right now, 24/7 Tempo reviewed data on recent COVID-19 hospital admissions from the Centers for Disease Control and Prevention. States were ranked based on the number of new hospital admissions due to COVID-19 per 100,000 state residents for the week of Feb 4-Feb. 10, 2024. Supplemental data on the total number of recorded COVID-19 hospital admissions since Aug. 1, 2020; the total number of deaths due to COVID-19 since January 2020; and the COVID-19 test positivity rate for the week of Feb 4-Feb. 10, 2024 also came from the CDC. It should be noted that this metric is widely considered to be inaccurate today, due to the closing down of many official testing centers and the fact that the results of home tests are rarely reported. Population data used to adjust hospital admission and death counts per capita came from the U.S. Census Bureau’s Population and Housing Unit Estimates program and is for July 1, 2022.
Scroll down for the states where the COVID-19 surge is the worst now:
50. New Mexico

- New weekly COVID-19 hospital admissions, Feb 4-Feb. 10, 2024: 3.2 per 100,000 (68 total)
- COVID-19 hospital admissions since Aug. 1, 2020: 1,932.5 per 100,000 (21st lowest)
- COVID-19 deaths since January 2020: 454.9 per 100,000 (5th highest)
- Current COVID-19 test positivity rate: 10.8% (the highest)
49. Utah

- New weekly COVID-19 hospital admissions, Feb 4-Feb. 10, 2024: 3.4 per 100,000 (115 total)
- COVID-19 hospital admissions since Aug. 1, 2020: 1,498.8 per 100,000 (8th lowest)
- COVID-19 deaths since January 2020: 168.9 per 100,000 (2nd lowest)
- Current COVID-19 test positivity rate: 6.9% (6th lowest)
48. Idaho

- New weekly COVID-19 hospital admissions, Feb 4-Feb. 10, 2024: 3.8 per 100,000 (74 total)
- COVID-19 hospital admissions since Aug. 1, 2020: 1,566.7 per 100,000 (12th lowest)
- COVID-19 deaths since January 2020: 293.7 per 100,000 (13th lowest)
- Current COVID-19 test positivity rate: 8.6% (24th highest)
47. Oregon

- New weekly COVID-19 hospital admissions, Feb 4-Feb. 10, 2024: 3.8 per 100,000 (162 total)
- COVID-19 hospital admissions since Aug. 1, 2020: 1,209.3 per 100,000 (3rd lowest)
- COVID-19 deaths since January 2020: 229.9 per 100,000 (6th lowest)
- Current COVID-19 test positivity rate: 8.6% (24th highest)
46. Minnesota

- New weekly COVID-19 hospital admissions, Feb 4-Feb. 10, 2024: 3.9 per 100,000 (222 total)
- COVID-19 hospital admissions since Aug. 1, 2020: 1,514.1 per 100,000 (10th lowest)
- COVID-19 deaths since January 2020: 285.6 per 100,000 (11th lowest)
- Current COVID-19 test positivity rate: 9.3% (14th highest)
45. Colorado

- New weekly COVID-19 hospital admissions, Feb 4-Feb. 10, 2024: 3.9 per 100,000 (230 total)
- COVID-19 hospital admissions since Aug. 1, 2020: 1,806.9 per 100,000 (18th lowest)
- COVID-19 deaths since January 2020: 266.1 per 100,000 (9th lowest)
- Current COVID-19 test positivity rate: 6.9% (6th lowest)
44. Iowa

- New weekly COVID-19 hospital admissions, Feb 4-Feb. 10, 2024: 4.1 per 100,000 (132 total)
- COVID-19 hospital admissions since Aug. 1, 2020: 1,849.5 per 100,000 (19th lowest)
- COVID-19 deaths since January 2020: 362.7 per 100,000 (25th highest)
- Current COVID-19 test positivity rate: 8.5% (23rd lowest)
43. Washington

- New weekly COVID-19 hospital admissions, Feb 4-Feb. 10, 2024: 4.3 per 100,000 (332 total)
- COVID-19 hospital admissions since Aug. 1, 2020: 1,077.0 per 100,000 (the lowest)
- COVID-19 deaths since January 2020: 202.4 per 100,000 (4th lowest)
- Current COVID-19 test positivity rate: 8.6% (24th highest)
42. Montana

- New weekly COVID-19 hospital admissions, Feb 4-Feb. 10, 2024: 4.3 per 100,000 (48 total)
- COVID-19 hospital admissions since Aug. 1, 2020: 2,851.5 per 100,000 (3rd highest)
- COVID-19 deaths since January 2020: 357.6 per 100,000 (25th lowest)
- Current COVID-19 test positivity rate: 6.9% (6th lowest)
41. Nevada

- New weekly COVID-19 hospital admissions, Feb 4-Feb. 10, 2024: 4.3 per 100,000 (138 total)
- COVID-19 hospital admissions since Aug. 1, 2020: 2,134.6 per 100,000 (17th highest)
- COVID-19 deaths since January 2020: 384.3 per 100,000 (19th highest)
- Current COVID-19 test positivity rate: 8.7% (20th highest)
40. Tennessee

- New weekly COVID-19 hospital admissions, Feb 4-Feb. 10, 2024: 4.4 per 100,000 (312 total)
- COVID-19 hospital admissions since Aug. 1, 2020: 1,973.5 per 100,000 (23rd lowest)
- COVID-19 deaths since January 2020: 420.6 per 100,000 (11th highest)
- Current COVID-19 test positivity rate: 10.7% (6th highest)
39. Vermont

- New weekly COVID-19 hospital admissions, Feb 4-Feb. 10, 2024: 4.5 per 100,000 (29 total)
- COVID-19 hospital admissions since Aug. 1, 2020: 1,113.5 per 100,000 (2nd lowest)
- COVID-19 deaths since January 2020: 174.9 per 100,000 (3rd lowest)
- Current COVID-19 test positivity rate: 7.9% (14th lowest)
38. Maine

- New weekly COVID-19 hospital admissions, Feb 4-Feb. 10, 2024: 4.8 per 100,000 (66 total)
- COVID-19 hospital admissions since Aug. 1, 2020: 1,211.3 per 100,000 (4th lowest)
- COVID-19 deaths since January 2020: 255.2 per 100,000 (8th lowest)
- Current COVID-19 test positivity rate: 7.9% (14th lowest)
37. Maryland

- New weekly COVID-19 hospital admissions, Feb 4-Feb. 10, 2024: 4.8 per 100,000 (294 total)
- COVID-19 hospital admissions since Aug. 1, 2020: 1,686.8 per 100,000 (14th lowest)
- COVID-19 deaths since January 2020: 307.2 per 100,000 (16th lowest)
- Current COVID-19 test positivity rate: 8.3% (19th lowest)
36. Arizona

- New weekly COVID-19 hospital admissions, Feb 4-Feb. 10, 2024: 4.8 per 100,000 (353 total)
- COVID-19 hospital admissions since Aug. 1, 2020: 2,220.4 per 100,000 (13th highest)
- COVID-19 deaths since January 2020: 413.6 per 100,000 (13th highest)
- Current COVID-19 test positivity rate: 8.7% (20th highest)
35. Kansas

- New weekly COVID-19 hospital admissions, Feb 4-Feb. 10, 2024: 5.1 per 100,000 (151 total)
- COVID-19 hospital admissions since Aug. 1, 2020: 2,089.3 per 100,000 (21st highest)
- COVID-19 deaths since January 2020: 372.7 per 100,000 (23rd highest)
- Current COVID-19 test positivity rate: 8.5% (23rd lowest)
34. Indiana

- New weekly COVID-19 hospital admissions, Feb 4-Feb. 10, 2024: 5.3 per 100,000 (363 total)
- COVID-19 hospital admissions since Aug. 1, 2020: 2,191.0 per 100,000 (15th highest)
- COVID-19 deaths since January 2020: 394.2 per 100,000 (14th highest)
- Current COVID-19 test positivity rate: 9.3% (14th highest)
33. California

- New weekly COVID-19 hospital admissions, Feb 4-Feb. 10, 2024: 5.3 per 100,000 (2,077 total)
- COVID-19 hospital admissions since Aug. 1, 2020: 1,699.7 per 100,000 (16th lowest)
- COVID-19 deaths since January 2020: 287.1 per 100,000 (12th lowest)
- Current COVID-19 test positivity rate: 8.7% (20th highest)
32. Mississippi

- New weekly COVID-19 hospital admissions, Feb 4-Feb. 10, 2024: 5.4 per 100,000 (160 total)
- COVID-19 hospital admissions since Aug. 1, 2020: 1,992.6 per 100,000 (25th lowest)
- COVID-19 deaths since January 2020: 521.1 per 100,000 (the highest)
- Current COVID-19 test positivity rate: 10.7% (6th highest)
31. Wyoming

- New weekly COVID-19 hospital admissions, Feb 4-Feb. 10, 2024: 5.5 per 100,000 (32 total)
- COVID-19 hospital admissions since Aug. 1, 2020: 2,085.0 per 100,000 (22nd highest)
- COVID-19 deaths since January 2020: 384.6 per 100,000 (18th highest)
- Current COVID-19 test positivity rate: 6.9% (6th lowest)
30. Illinois

- New weekly COVID-19 hospital admissions, Feb 4-Feb. 10, 2024: 5.6 per 100,000 (699 total)
- COVID-19 hospital admissions since Aug. 1, 2020: 1,986.9 per 100,000 (24th lowest)
- COVID-19 deaths since January 2020: 331.3 per 100,000 (19th lowest)
- Current COVID-19 test positivity rate: 9.3% (14th highest)
29. Ohio

- New weekly COVID-19 hospital admissions, Feb 4-Feb. 10, 2024: 5.6 per 100,000 (655 total)
- COVID-19 hospital admissions since Aug. 1, 2020: 2,390.9 per 100,000 (7th highest)
- COVID-19 deaths since January 2020: 437.5 per 100,000 (7th highest)
- Current COVID-19 test positivity rate: 9.3% (14th highest)
28. New Hampshire
- New weekly COVID-19 hospital admissions, Feb 4-Feb. 10, 2024: 5.7 per 100,000 (79 total)
- COVID-19 hospital admissions since Aug. 1, 2020: 1,446.3 per 100,000 (7th lowest)
- COVID-19 deaths since January 2020: 249.1 per 100,000 (7th lowest)
- Current COVID-19 test positivity rate: 7.9% (14th lowest)
27. West Virginia

- New weekly COVID-19 hospital admissions, Feb 4-Feb. 10, 2024: 5.7 per 100,000 (101 total)
- COVID-19 hospital admissions since Aug. 1, 2020: 2,643.7 per 100,000 (5th highest)
- COVID-19 deaths since January 2020: 507.5 per 100,000 (2nd highest)
- Current COVID-19 test positivity rate: 8.3% (19th lowest)
26. Rhode Island

- New weekly COVID-19 hospital admissions, Feb 4-Feb. 10, 2024: 5.9 per 100,000 (64 total)
- COVID-19 hospital admissions since Aug. 1, 2020: 1,341.4 per 100,000 (5th lowest)
- COVID-19 deaths since January 2020: 375.2 per 100,000 (21st highest)
- Current COVID-19 test positivity rate: 7.9% (14th lowest)
25. Wisconsin

- New weekly COVID-19 hospital admissions, Feb 4-Feb. 10, 2024: 5.9 per 100,000 (348 total)
- COVID-19 hospital admissions since Aug. 1, 2020: 2,308.6 per 100,000 (11th highest)
- COVID-19 deaths since January 2020: 302.3 per 100,000 (14th lowest)
- Current COVID-19 test positivity rate: 9.3% (14th highest)
24. Michigan

- New weekly COVID-19 hospital admissions, Feb 4-Feb. 10, 2024: 5.9 per 100,000 (595 total)
- COVID-19 hospital admissions since Aug. 1, 2020: 2,081.6 per 100,000 (23rd highest)
- COVID-19 deaths since January 2020: 389.6 per 100,000 (17th highest)
- Current COVID-19 test positivity rate: 9.3% (14th highest)
23. Kentucky

- New weekly COVID-19 hospital admissions, Feb 4-Feb. 10, 2024: 5.9 per 100,000 (268 total)
- COVID-19 hospital admissions since Aug. 1, 2020: 3,629.3 per 100,000 (the highest)
- COVID-19 deaths since January 2020: 463.8 per 100,000 (4th highest)
- Current COVID-19 test positivity rate: 10.7% (6th highest)
22. North Dakota

- New weekly COVID-19 hospital admissions, Feb 4-Feb. 10, 2024: 6.2 per 100,000 (48 total)
- COVID-19 hospital admissions since Aug. 1, 2020: 2,099.8 per 100,000 (20th highest)
- COVID-19 deaths since January 2020: 348.8 per 100,000 (22nd lowest)
- Current COVID-19 test positivity rate: 6.9% (6th lowest)
21. Pennsylvania

- New weekly COVID-19 hospital admissions, Feb 4-Feb. 10, 2024: 6.2 per 100,000 (801 total)
- COVID-19 hospital admissions since Aug. 1, 2020: 2,048.8 per 100,000 (24th highest)
- COVID-19 deaths since January 2020: 421.6 per 100,000 (10th highest)
- Current COVID-19 test positivity rate: 8.3% (19th lowest)
20. North Carolina

- New weekly COVID-19 hospital admissions, Feb 4-Feb. 10, 2024: 6.5 per 100,000 (693 total)
- COVID-19 hospital admissions since Aug. 1, 2020: 1,691.8 per 100,000 (15th lowest)
- COVID-19 deaths since January 2020: 329.6 per 100,000 (18th lowest)
- Current COVID-19 test positivity rate: 10.7% (6th highest)
19. Virginia

- New weekly COVID-19 hospital admissions, Feb 4-Feb. 10, 2024: 6.5 per 100,000 (563 total)
- COVID-19 hospital admissions since Aug. 1, 2020: 1,546.9 per 100,000 (11th lowest)
- COVID-19 deaths since January 2020: 284.1 per 100,000 (10th lowest)
- Current COVID-19 test positivity rate: 8.3% (19th lowest)
18. Alaska

- New weekly COVID-19 hospital admissions, Feb 4-Feb. 10, 2024: 6.7 per 100,000 (49 total)
- COVID-19 hospital admissions since Aug. 1, 2020: 1,415.2 per 100,000 (6th lowest)
- COVID-19 deaths since January 2020: 212.1 per 100,000 (5th lowest)
- Current COVID-19 test positivity rate: 8.6% (24th highest)
17. Alabama

- New weekly COVID-19 hospital admissions, Feb 4-Feb. 10, 2024: 6.7 per 100,000 (341 total)
- COVID-19 hospital admissions since Aug. 1, 2020: 2,488.1 per 100,000 (6th highest)
- COVID-19 deaths since January 2020: 452.5 per 100,000 (6th highest)
- Current COVID-19 test positivity rate: 10.7% (6th highest)
16. Oklahoma

- New weekly COVID-19 hospital admissions, Feb 4-Feb. 10, 2024: 6.8 per 100,000 (274 total)
- COVID-19 hospital admissions since Aug. 1, 2020: 2,876.9 per 100,000 (2nd highest)
- COVID-19 deaths since January 2020: 501.9 per 100,000 (3rd highest)
- Current COVID-19 test positivity rate: 10.8% (the highest)
15. Connecticut

- New weekly COVID-19 hospital admissions, Feb 4-Feb. 10, 2024: 6.9 per 100,000 (249 total)
- COVID-19 hospital admissions since Aug. 1, 2020: 1,965.4 per 100,000 (22nd lowest)
- COVID-19 deaths since January 2020: 351.9 per 100,000 (23rd lowest)
- Current COVID-19 test positivity rate: 7.9% (14th lowest)
14. Missouri

- New weekly COVID-19 hospital admissions, Feb 4-Feb. 10, 2024: 6.9 per 100,000 (427 total)
- COVID-19 hospital admissions since Aug. 1, 2020: 2,295.4 per 100,000 (12th highest)
- COVID-19 deaths since January 2020: 377.2 per 100,000 (20th highest)
- Current COVID-19 test positivity rate: 8.5% (23rd lowest)
13. Hawaii

- New weekly COVID-19 hospital admissions, Feb 4-Feb. 10, 2024: 6.9 per 100,000 (100 total)
- COVID-19 hospital admissions since Aug. 1, 2020: 1,505.2 per 100,000 (9th lowest)
- COVID-19 deaths since January 2020: 143.1 per 100,000 (the lowest)
- Current COVID-19 test positivity rate: 8.7% (20th highest)
12. New Jersey

- New weekly COVID-19 hospital admissions, Feb 4-Feb. 10, 2024: 7.1 per 100,000 (662 total)
- COVID-19 hospital admissions since Aug. 1, 2020: 2,037.0 per 100,000 (25th highest)
- COVID-19 deaths since January 2020: 392.6 per 100,000 (16th highest)
- Current COVID-19 test positivity rate: 7.5% (8th lowest)
11. Nebraska

- New weekly COVID-19 hospital admissions, Feb 4-Feb. 10, 2024: 7.2 per 100,000 (142 total)
- COVID-19 hospital admissions since Aug. 1, 2020: 1,760.5 per 100,000 (17th lowest)
- COVID-19 deaths since January 2020: 304.5 per 100,000 (15th lowest)
- Current COVID-19 test positivity rate: 8.5% (23rd lowest)
10. South Dakota

- New weekly COVID-19 hospital admissions, Feb 4-Feb. 10, 2024: 7.3 per 100,000 (66 total)
- COVID-19 hospital admissions since Aug. 1, 2020: 2,317.4 per 100,000 (9th highest)
- COVID-19 deaths since January 2020: 373.3 per 100,000 (22nd highest)
- Current COVID-19 test positivity rate: 6.9% (6th lowest)
9. Delaware

- New weekly COVID-19 hospital admissions, Feb 4-Feb. 10, 2024: 7.3 per 100,000 (74 total)
- COVID-19 hospital admissions since Aug. 1, 2020: 2,119.9 per 100,000 (18th highest)
- COVID-19 deaths since January 2020: 354.6 per 100,000 (24th lowest)
- Current COVID-19 test positivity rate: 8.3% (19th lowest)
8. Massachusetts

- New weekly COVID-19 hospital admissions, Feb 4-Feb. 10, 2024: 7.7 per 100,000 (539 total)
- COVID-19 hospital admissions since Aug. 1, 2020: 1,677.7 per 100,000 (13th lowest)
- COVID-19 deaths since January 2020: 313.0 per 100,000 (17th lowest)
- Current COVID-19 test positivity rate: 7.9% (14th lowest)
7. South Carolina

- New weekly COVID-19 hospital admissions, Feb 4-Feb. 10, 2024: 8.0 per 100,000 (422 total)
- COVID-19 hospital admissions since Aug. 1, 2020: 1,932.3 per 100,000 (20th lowest)
- COVID-19 deaths since January 2020: 414.4 per 100,000 (12th highest)
- Current COVID-19 test positivity rate: 10.7% (6th highest)
6. Georgia

- New weekly COVID-19 hospital admissions, Feb 4-Feb. 10, 2024: 8.0 per 100,000 (873 total)
- COVID-19 hospital admissions since Aug. 1, 2020: 2,311.7 per 100,000 (10th highest)
- COVID-19 deaths since January 2020: 339.9 per 100,000 (20th lowest)
- Current COVID-19 test positivity rate: 10.7% (6th highest)
5. Texas

- New weekly COVID-19 hospital admissions, Feb 4-Feb. 10, 2024: 8.1 per 100,000 (2,433 total)
- COVID-19 hospital admissions since Aug. 1, 2020: 2,139.5 per 100,000 (16th highest)
- COVID-19 deaths since January 2020: 347.5 per 100,000 (21st lowest)
- Current COVID-19 test positivity rate: 10.8% (the highest)
4. Louisiana

- New weekly COVID-19 hospital admissions, Feb 4-Feb. 10, 2024: 8.1 per 100,000 (374 total)
- COVID-19 hospital admissions since Aug. 1, 2020: 2,206.0 per 100,000 (14th highest)
- COVID-19 deaths since January 2020: 393.9 per 100,000 (15th highest)
- Current COVID-19 test positivity rate: 10.8% (the highest)
3. Arkansas

- New weekly COVID-19 hospital admissions, Feb 4-Feb. 10, 2024: 8.3 per 100,000 (252 total)
- COVID-19 hospital admissions since Aug. 1, 2020: 2,366.0 per 100,000 (8th highest)
- COVID-19 deaths since January 2020: 424.7 per 100,000 (9th highest)
- Current COVID-19 test positivity rate: 10.8% (the highest)
2. Florida

- New weekly COVID-19 hospital admissions, Feb 4-Feb. 10, 2024: 8.5 per 100,000 (1,883 total)
- COVID-19 hospital admissions since Aug. 1, 2020: 2,702.1 per 100,000 (4th highest)
- COVID-19 deaths since January 2020: 369.9 per 100,000 (24th highest)
- Current COVID-19 test positivity rate: 10.7% (6th highest)
1. New York

- New weekly COVID-19 hospital admissions, Feb 4-Feb. 10, 2024: 8.5 per 100,000 (1,679 total)
- COVID-19 hospital admissions since Aug. 1, 2020: 2,109.8 per 100,000 (19th highest)
- COVID-19 deaths since January 2020: 425.1 per 100,000 (8th highest)
- Current COVID-19 test positivity rate: 7.5% (8th lowest)