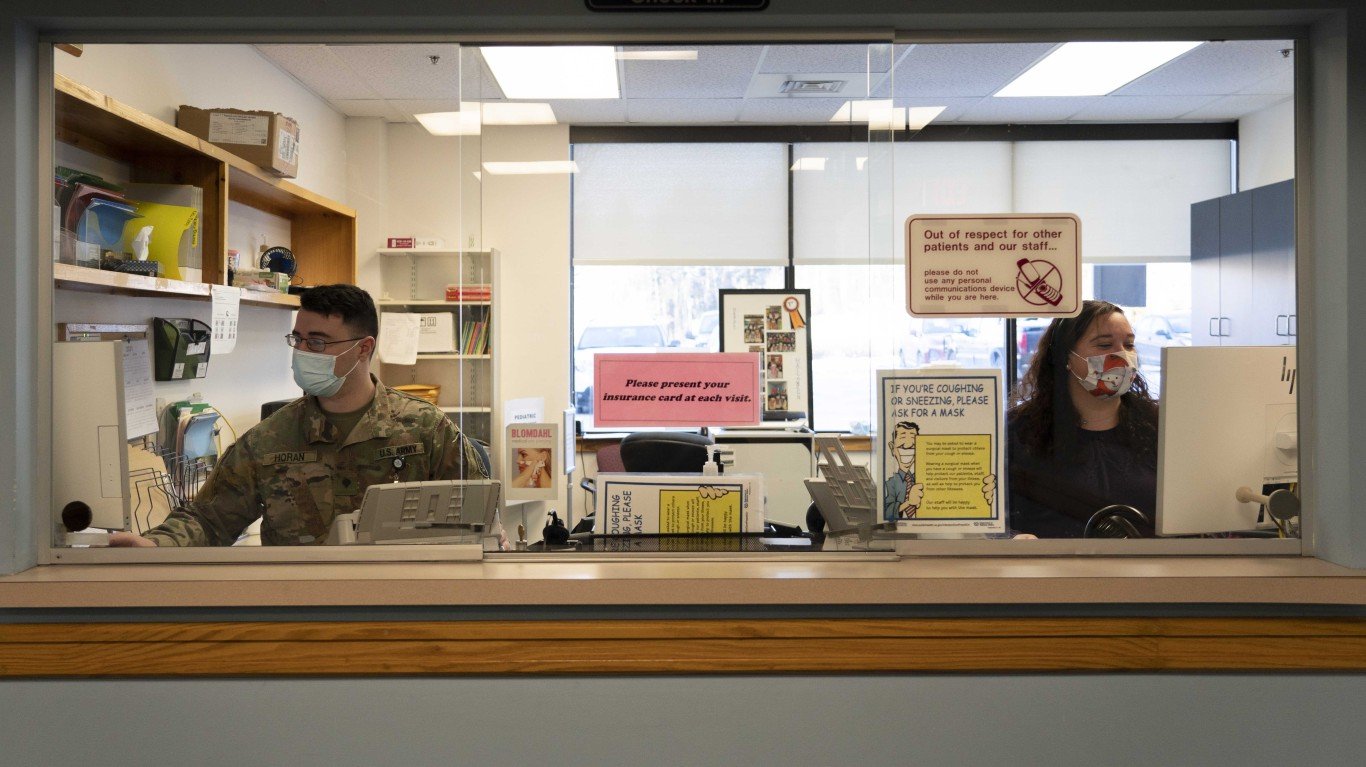
The federal COVID-19 public health emergency declaration ended on May 11 of last year, and since then, the nation has largely moved on to considering the disease just another occasional bothersome interruption of daily life, along with the flu and the common cold. Mask-wearing – contentious in some quarters even at the height of COVID’s rampage – has become a curiosity (“I saw someone wearing a mask at the grocery store today, dear”), and restaurants have long since abandoned their pandemic-era practices of vaccine checks and extended table spacing (though lean-tos for outdoor dining are still around).
What we may not want to acknowledge, however, is that COVID-related hospital admissions and even deaths from the virus still occur in significant numbers, and will likely continue to do so at least until warmer weather sets in across the country. And as before, those of advanced age or with compromised immune status or serious health conditions like diabetes and heart or lung disease, remain particularly at risk. (Heart disease still tops the list of the 15 leading causes of death in America.)
To determine the states where the COVID-19 surge is the worst, 24/7 Tempo consulted data from the Centers for Disease Control and Prevention on the number of new hospital admissions due to COVID-19 per 100,000 state residents for the week of Jan. 14-Jan.20, 2024.
The good news is that, while the rates considered are still high, they have dropped from mid-December in most cases. New York State still records the highest number of COVID-19 hospital admissions, but now at a rate of 12.4 per 100,000 residents, compared to 15.6 for the week of Dec. 17-22, 2023. West Virginia, which was in second place in that data from December, has dropped to fourth place, with a rate descending from 15.4 to 10.9 admissions per 100,000.
On the other hand, the state with the lowest rate of admissions in December, New Mexico, with 2.4 per 100,000, has edged up very slightly to 2.9 – a further reminder, if one be needed, that COVID is still around.
Here are the states where the COVID-19 surge is the worst:
Methodology
To determine the states where the COVID-19 surge is the worst right now, 24/7 Tempo reviewed data on recent COVID-19 hospital admissions from the Centers for Disease Control and Prevention. States were ranked based on the number of new hospital admissions due to COVID-19 per 100,000 state residents for the week of Jan. 14-Jan. 20, 2024. Supplemental data on the total number of recorded COVID-19 hospital admissions since Aug. 1, 2020; the total number of deaths due to COVID-19 since January 2020; and the COVID-19 test positivity rate for the week of Jan. 14-Jan. 20, 2024 also came from the CDC. It should be noted that this metric is widely considered to be inaccurate today, due to the closing down of many official testing centers and the fact that the results of home tests are rarely reported. Population data used to adjust hospital admission and death counts per capita came from the U.S. Census Bureau’s Population and Housing Unit Estimates program and is for July 1, 2022.
50. New Mexico

- New weekly COVID-19 hospital admissions, Jan. 14-Jan. 20, 2024: 2.9 per 100,000 (62 total)
- COVID-19 hospital admissions since Aug. 1, 2020: 1,923.0 per 100,000 (21st lowest)
- COVID-19 deaths since January 2020: 452.8 per 100,000 (5th highest)
- Current COVID-19 test positivity rate: 10.2% (15th lowest)
49. Utah

- New weekly COVID-19 hospital admissions, Jan. 14-Jan. 20, 2024: 4.7 per 100,000 (158 total)
- COVID-19 hospital admissions since Aug. 1, 2020: 1,486.9 per 100,000 (9th lowest)
- COVID-19 deaths since January 2020: 168.4 per 100,000 (2nd lowest)
- Current COVID-19 test positivity rate: 8.5% (10th lowest)
48. Wyoming

- New weekly COVID-19 hospital admissions, Jan. 14-Jan. 20, 2024: 4.8 per 100,000 (28 total)
- COVID-19 hospital admissions since Aug. 1, 2020: 2,074.4 per 100,000 (22nd highest)
- COVID-19 deaths since January 2020: 381.8 per 100,000 (19th highest)
- Current COVID-19 test positivity rate: 8.5% (10th lowest)
47. Washington

- New weekly COVID-19 hospital admissions, Jan. 14-Jan. 20, 2024: 5.0 per 100,000 (389 total)
- COVID-19 hospital admissions since Aug. 1, 2020: 1,063.5 per 100,000 (the lowest)
- COVID-19 deaths since January 2020: 200.9 per 100,000 (4th lowest)
- Current COVID-19 test positivity rate: 10.4% (19th lowest)
46. Idaho

- New weekly COVID-19 hospital admissions, Jan. 14-Jan. 20, 2024: 5.4 per 100,000 (105 total)
- COVID-19 hospital admissions since Aug. 1, 2020: 1,553.4 per 100,000 (12th lowest)
- COVID-19 deaths since January 2020: 291.7 per 100,000 (13th lowest)
- Current COVID-19 test positivity rate: 10.4% (19th lowest)
45. Tennessee

- New weekly COVID-19 hospital admissions, Jan. 14-Jan. 20, 2024: 5.5 per 100,000 (387 total)
- COVID-19 hospital admissions since Aug. 1, 2020: 1,958.3 per 100,000 (23rd lowest)
- COVID-19 deaths since January 2020: 418.1 per 100,000 (11th highest)
- Current COVID-19 test positivity rate: 10.7% (15th highest)
44. Maine
- New weekly COVID-19 hospital admissions, Jan. 14-Jan. 20, 2024: 5.6 per 100,000 (77 total)
- COVID-19 hospital admissions since Aug. 1, 2020: 1,198.3 per 100,000 (4th lowest)
- COVID-19 deaths since January 2020: 253.1 per 100,000 (8th lowest)
- Current COVID-19 test positivity rate: 12.0% (3rd highest)
43. Alaska
- New weekly COVID-19 hospital admissions, Jan. 14-Jan. 20, 2024: 5.6 per 100,000 (41 total)
- COVID-19 hospital admissions since Aug. 1, 2020: 1,395.1 per 100,000 (6th lowest)
- COVID-19 deaths since January 2020: 211.7 per 100,000 (5th lowest)
- Current COVID-19 test positivity rate: 10.4% (19th lowest)
42. Oregon

- New weekly COVID-19 hospital admissions, Jan. 14-Jan. 20, 2024: 5.6 per 100,000 (237 total)
- COVID-19 hospital admissions since Aug. 1, 2020: 1,197.1 per 100,000 (3rd lowest)
- COVID-19 deaths since January 2020: 228.6 per 100,000 (6th lowest)
- Current COVID-19 test positivity rate: 10.4% (19th lowest)
41. Mississippi
- New weekly COVID-19 hospital admissions, Jan. 14-Jan. 20, 2024: 5.6 per 100,000 (166 total)
- COVID-19 hospital admissions since Aug. 1, 2020: 1,978.0 per 100,000 (25th lowest)
- COVID-19 deaths since January 2020: 518.1 per 100,000 (the highest)
- Current COVID-19 test positivity rate: 10.7% (15th highest)
40. Montana

- New weekly COVID-19 hospital admissions, Jan. 14-Jan. 20, 2024: 5.7 per 100,000 (64 total)
- COVID-19 hospital admissions since Aug. 1, 2020: 2,838.8 per 100,000 (3rd highest)
- COVID-19 deaths since January 2020: 355.3 per 100,000 (25th lowest)
- Current COVID-19 test positivity rate: 8.5% (10th lowest)
39. North Dakota
- New weekly COVID-19 hospital admissions, Jan. 14-Jan. 20, 2024: 5.8 per 100,000 (45 total)
- COVID-19 hospital admissions since Aug. 1, 2020: 2,081.8 per 100,000 (19th highest)
- COVID-19 deaths since January 2020: 347.3 per 100,000 (22nd lowest)
- Current COVID-19 test positivity rate: 8.5% (10th lowest)
38. Colorado
- New weekly COVID-19 hospital admissions, Jan. 14-Jan. 20, 2024: 5.9 per 100,000 (342 total)
- COVID-19 hospital admissions since Aug. 1, 2020: 1,794.1 per 100,000 (18th lowest)
- COVID-19 deaths since January 2020: 264.9 per 100,000 (9th lowest)
- Current COVID-19 test positivity rate: 8.5% (10th lowest)
37. Vermont

- New weekly COVID-19 hospital admissions, Jan. 14-Jan. 20, 2024: 6.0 per 100,000 (39 total)
- COVID-19 hospital admissions since Aug. 1, 2020: 1,095.4 per 100,000 (2nd lowest)
- COVID-19 deaths since January 2020: 172.3 per 100,000 (3rd lowest)
- Current COVID-19 test positivity rate: 12.0% (3rd highest)
36. Minnesota

- New weekly COVID-19 hospital admissions, Jan. 14-Jan. 20, 2024: 6.1 per 100,000 (346 total)
- COVID-19 hospital admissions since Aug. 1, 2020: 1,500.2 per 100,000 (10th lowest)
- COVID-19 deaths since January 2020: 283.7 per 100,000 (11th lowest)
- Current COVID-19 test positivity rate: 11.4% (9th highest)
35. Nebraska
- New weekly COVID-19 hospital admissions, Jan. 14-Jan. 20, 2024: 6.1 per 100,000 (121 total)
- COVID-19 hospital admissions since Aug. 1, 2020: 1,743.9 per 100,000 (17th lowest)
- COVID-19 deaths since January 2020: 302.2 per 100,000 (15th lowest)
- Current COVID-19 test positivity rate: 10.6% (23rd highest)
34. New Hampshire
- New weekly COVID-19 hospital admissions, Jan. 14-Jan. 20, 2024: 6.2 per 100,000 (86 total)
- COVID-19 hospital admissions since Aug. 1, 2020: 1,429.9 per 100,000 (7th lowest)
- COVID-19 deaths since January 2020: 247.0 per 100,000 (7th lowest)
- Current COVID-19 test positivity rate: 12.0% (3rd highest)
33. Kansas
- New weekly COVID-19 hospital admissions, Jan. 14-Jan. 20, 2024: 6.3 per 100,000 (184 total)
- COVID-19 hospital admissions since Aug. 1, 2020: 2,076.9 per 100,000 (21st highest)
- COVID-19 deaths since January 2020: 371.1 per 100,000 (22nd highest)
- Current COVID-19 test positivity rate: 10.6% (23rd highest)
32. Nevada

- New weekly COVID-19 hospital admissions, Jan. 14-Jan. 20, 2024: 6.3 per 100,000 (200 total)
- COVID-19 hospital admissions since Aug. 1, 2020: 2,120.6 per 100,000 (16th highest)
- COVID-19 deaths since January 2020: 382.5 per 100,000 (18th highest)
- Current COVID-19 test positivity rate: 7.4% (4th lowest)
31. North Carolina
- New weekly COVID-19 hospital admissions, Jan. 14-Jan. 20, 2024: 6.6 per 100,000 (708 total)
- COVID-19 hospital admissions since Aug. 1, 2020: 1,672.8 per 100,000 (15th lowest)
- COVID-19 deaths since January 2020: 327.6 per 100,000 (18th lowest)
- Current COVID-19 test positivity rate: 10.7% (15th highest)
30. Arizona

- New weekly COVID-19 hospital admissions, Jan. 14-Jan. 20, 2024: 6.6 per 100,000 (487 total)
- COVID-19 hospital admissions since Aug. 1, 2020: 2,204.4 per 100,000 (13th highest)
- COVID-19 deaths since January 2020: 411.9 per 100,000 (13th highest)
- Current COVID-19 test positivity rate: 7.4% (4th lowest)
29. Oklahoma
- New weekly COVID-19 hospital admissions, Jan. 14-Jan. 20, 2024: 6.8 per 100,000 (275 total)
- COVID-19 hospital admissions since Aug. 1, 2020: 2,858.1 per 100,000 (2nd highest)
- COVID-19 deaths since January 2020: 498.9 per 100,000 (3rd highest)
- Current COVID-19 test positivity rate: 10.2% (15th lowest)
28. Maryland

- New weekly COVID-19 hospital admissions, Jan. 14-Jan. 20, 2024: 6.9 per 100,000 (424 total)
- COVID-19 hospital admissions since Aug. 1, 2020: 1,670.5 per 100,000 (14th lowest)
- COVID-19 deaths since January 2020: 304.8 per 100,000 (16th lowest)
- Current COVID-19 test positivity rate: 10.6% (23rd highest)
27. Texas

- New weekly COVID-19 hospital admissions, Jan. 14-Jan. 20, 2024: 7.1 per 100,000 (2,121 total)
- COVID-19 hospital admissions since Aug. 1, 2020: 2,119.6 per 100,000 (17th highest)
- COVID-19 deaths since January 2020: 346.2 per 100,000 (21st lowest)
- Current COVID-19 test positivity rate: 10.2% (15th lowest)
26. Wisconsin

- New weekly COVID-19 hospital admissions, Jan. 14-Jan. 20, 2024: 7.1 per 100,000 (418 total)
- COVID-19 hospital admissions since Aug. 1, 2020: 2,292.2 per 100,000 (10th highest)
- COVID-19 deaths since January 2020: 300.5 per 100,000 (14th lowest)
- Current COVID-19 test positivity rate: 11.4% (9th highest)
25. Michigan

- New weekly COVID-19 hospital admissions, Jan. 14-Jan. 20, 2024: 7.1 per 100,000 (715 total)
- COVID-19 hospital admissions since Aug. 1, 2020: 2,062.8 per 100,000 (23rd highest)
- COVID-19 deaths since January 2020: 387.5 per 100,000 (17th highest)
- Current COVID-19 test positivity rate: 11.4% (9th highest)
24. Iowa
- New weekly COVID-19 hospital admissions, Jan. 14-Jan. 20, 2024: 7.2 per 100,000 (232 total)
- COVID-19 hospital admissions since Aug. 1, 2020: 1,836.3 per 100,000 (19th lowest)
- COVID-19 deaths since January 2020: 360.0 per 100,000 (25th highest)
- Current COVID-19 test positivity rate: 10.6% (23rd highest)
23. Georgia

- New weekly COVID-19 hospital admissions, Jan. 14-Jan. 20, 2024: 7.4 per 100,000 (804 total)
- COVID-19 hospital admissions since Aug. 1, 2020: 2,287.5 per 100,000 (11th highest)
- COVID-19 deaths since January 2020: 338.1 per 100,000 (20th lowest)
- Current COVID-19 test positivity rate: 10.7% (15th highest)
22. Louisiana

- New weekly COVID-19 hospital admissions, Jan. 14-Jan. 20, 2024: 7.5 per 100,000 (345 total)
- COVID-19 hospital admissions since Aug. 1, 2020: 2,183.9 per 100,000 (14th highest)
- COVID-19 deaths since January 2020: 391.8 per 100,000 (15th highest)
- Current COVID-19 test positivity rate: 10.2% (15th lowest)
21. California

- New weekly COVID-19 hospital admissions, Jan. 14-Jan. 20, 2024: 7.6 per 100,000 (2,975 total)
- COVID-19 hospital admissions since Aug. 1, 2020: 1,681.4 per 100,000 (16th lowest)
- COVID-19 deaths since January 2020: 285.8 per 100,000 (12th lowest)
- Current COVID-19 test positivity rate: 7.4% (4th lowest)
20. Delaware
- New weekly COVID-19 hospital admissions, Jan. 14-Jan. 20, 2024: 7.8 per 100,000 (79 total)
- COVID-19 hospital admissions since Aug. 1, 2020: 2,101.5 per 100,000 (18th highest)
- COVID-19 deaths since January 2020: 350.7 per 100,000 (24th lowest)
- Current COVID-19 test positivity rate: 10.6% (23rd highest)
19. South Carolina

- New weekly COVID-19 hospital admissions, Jan. 14-Jan. 20, 2024: 7.8 per 100,000 (410 total)
- COVID-19 hospital admissions since Aug. 1, 2020: 1,908.8 per 100,000 (20th lowest)
- COVID-19 deaths since January 2020: 413.1 per 100,000 (12th highest)
- Current COVID-19 test positivity rate: 10.7% (15th highest)
18. Rhode Island

- New weekly COVID-19 hospital admissions, Jan. 14-Jan. 20, 2024: 7.9 per 100,000 (86 total)
- COVID-19 hospital admissions since Aug. 1, 2020: 1,322.2 per 100,000 (5th lowest)
- COVID-19 deaths since January 2020: 373.2 per 100,000 (21st highest)
- Current COVID-19 test positivity rate: 12.0% (3rd highest)
17. Virginia

- New weekly COVID-19 hospital admissions, Jan. 14-Jan. 20, 2024: 7.9 per 100,000 (686 total)
- COVID-19 hospital admissions since Aug. 1, 2020: 1,526.5 per 100,000 (11th lowest)
- COVID-19 deaths since January 2020: 281.7 per 100,000 (10th lowest)
- Current COVID-19 test positivity rate: 10.6% (23rd highest)
16. Alabama

- New weekly COVID-19 hospital admissions, Jan. 14-Jan. 20, 2024: 7.9 per 100,000 (402 total)
- COVID-19 hospital admissions since Aug. 1, 2020: 2,467.2 per 100,000 (6th highest)
- COVID-19 deaths since January 2020: 449.9 per 100,000 (6th highest)
- Current COVID-19 test positivity rate: 10.7% (15th highest)
15. Kentucky

- New weekly COVID-19 hospital admissions, Jan. 14-Jan. 20, 2024: 8.0 per 100,000 (360 total)
- COVID-19 hospital admissions since Aug. 1, 2020: 3,610.1 per 100,000 (the highest)
- COVID-19 deaths since January 2020: 459.9 per 100,000 (4th highest)
- Current COVID-19 test positivity rate: 10.7% (15th highest)
14. Indiana

- New weekly COVID-19 hospital admissions, Jan. 14-Jan. 20, 2024: 8.3 per 100,000 (566 total)
- COVID-19 hospital admissions since Aug. 1, 2020: 2,176.4 per 100,000 (15th highest)
- COVID-19 deaths since January 2020: 392.1 per 100,000 (14th highest)
- Current COVID-19 test positivity rate: 11.4% (9th highest)
13. Pennsylvania
- New weekly COVID-19 hospital admissions, Jan. 14-Jan. 20, 2024: 8.5 per 100,000 (1,104 total)
- COVID-19 hospital admissions since Aug. 1, 2020: 2,029.2 per 100,000 (24th highest)
- COVID-19 deaths since January 2020: 419.2 per 100,000 (10th highest)
- Current COVID-19 test positivity rate: 10.6% (23rd highest)
12. Illinois
- New weekly COVID-19 hospital admissions, Jan. 14-Jan. 20, 2024: 8.5 per 100,000 (1,075 total)
- COVID-19 hospital admissions since Aug. 1, 2020: 1,969.7 per 100,000 (24th lowest)
- COVID-19 deaths since January 2020: 329.8 per 100,000 (19th lowest)
- Current COVID-19 test positivity rate: 11.4% (9th highest)
11. Missouri

- New weekly COVID-19 hospital admissions, Jan. 14-Jan. 20, 2024: 8.5 per 100,000 (528 total)
- COVID-19 hospital admissions since Aug. 1, 2020: 2,274.1 per 100,000 (12th highest)
- COVID-19 deaths since January 2020: 375.3 per 100,000 (20th highest)
- Current COVID-19 test positivity rate: 10.6% (23rd highest)
10. Hawaii
- New weekly COVID-19 hospital admissions, Jan. 14-Jan. 20, 2024: 8.6 per 100,000 (124 total)
- COVID-19 hospital admissions since Aug. 1, 2020: 1,484.5 per 100,000 (8th lowest)
- COVID-19 deaths since January 2020: 142.3 per 100,000 (the lowest)
- Current COVID-19 test positivity rate: 7.4% (4th lowest)
9. Ohio

- New weekly COVID-19 hospital admissions, Jan. 14-Jan. 20, 2024: 8.7 per 100,000 (1,018 total)
- COVID-19 hospital admissions since Aug. 1, 2020: 2,373.3 per 100,000 (7th highest)
- COVID-19 deaths since January 2020: 434.9 per 100,000 (7th highest)
- Current COVID-19 test positivity rate: 11.4% (9th highest)
8. South Dakota

- New weekly COVID-19 hospital admissions, Jan. 14-Jan. 20, 2024: 9.0 per 100,000 (82 total)
- COVID-19 hospital admissions since Aug. 1, 2020: 2,294.9 per 100,000 (9th highest)
- COVID-19 deaths since January 2020: 370.8 per 100,000 (23rd highest)
- Current COVID-19 test positivity rate: 8.5% (10th lowest)
7. Florida

- New weekly COVID-19 hospital admissions, Jan. 14-Jan. 20, 2024: 9.1 per 100,000 (2,026 total)
- COVID-19 hospital admissions since Aug. 1, 2020: 2,675.7 per 100,000 (4th highest)
- COVID-19 deaths since January 2020: 368.1 per 100,000 (24th highest)
- Current COVID-19 test positivity rate: 10.7% (15th highest)
6. Arkansas

- New weekly COVID-19 hospital admissions, Jan. 14-Jan. 20, 2024: 10.3 per 100,000 (313 total)
- COVID-19 hospital admissions since Aug. 1, 2020: 2,345.5 per 100,000 (8th highest)
- COVID-19 deaths since January 2020: 421.8 per 100,000 (9th highest)
- Current COVID-19 test positivity rate: 10.2% (15th lowest)
5. Connecticut

- New weekly COVID-19 hospital admissions, Jan. 14-Jan. 20, 2024: 10.5 per 100,000 (381 total)
- COVID-19 hospital admissions since Aug. 1, 2020: 1,941.7 per 100,000 (22nd lowest)
- COVID-19 deaths since January 2020: 349.5 per 100,000 (23rd lowest)
- Current COVID-19 test positivity rate: 12.0% (3rd highest)
4. West Virginia

- New weekly COVID-19 hospital admissions, Jan. 14-Jan. 20, 2024: 10.9 per 100,000 (193 total)
- COVID-19 hospital admissions since Aug. 1, 2020: 2,622.9 per 100,000 (5th highest)
- COVID-19 deaths since January 2020: 504.4 per 100,000 (2nd highest)
- Current COVID-19 test positivity rate: 10.6% (23rd highest)
3. New Jersey

- New weekly COVID-19 hospital admissions, Jan. 14-Jan. 20, 2024: 11.1 per 100,000 (1,027 total)
- COVID-19 hospital admissions since Aug. 1, 2020: 2,011.4 per 100,000 (25th highest)
- COVID-19 deaths since January 2020: 390.7 per 100,000 (16th highest)
- Current COVID-19 test positivity rate: 14.0% (the highest)
2. Massachusetts

- New weekly COVID-19 hospital admissions, Jan. 14-Jan. 20, 2024: 11.4 per 100,000 (799 total)
- COVID-19 hospital admissions since Aug. 1, 2020: 1,654.0 per 100,000 (13th lowest)
- COVID-19 deaths since January 2020: 311.1 per 100,000 (17th lowest)
- Current COVID-19 test positivity rate: 12.0% (3rd highest)
1. New York
- New weekly COVID-19 hospital admissions, Jan. 14-Jan. 20, 2024: 12.4 per 100,000 (2,437 total)
- COVID-19 hospital admissions since Aug. 1, 2020: 2,081.1 per 100,000 (20th highest)
- COVID-19 deaths since January 2020: 423.1 per 100,000 (8th highest)
- Current COVID-19 test positivity rate: 14.0% (the highest)

