
Cities in every region of the U.S. have to deal with drunk-driving deaths, but the issue in many metropolitan areas in the Midwest and western states is more problematic than other areas.
To determine the cities where drunk driving causes the most accidents, 24/7 Tempo reviewed data on alcohol-impaired driving fatalities reported in each state from the 2023 County Health Rankings report. It used data from the Fatality Analysis Reporting System for the 2016-2020 period for this measure. Cities were ranked by the percent of alcohol-impaired driving fatalities of all driving deaths.
Of the 40 metro areas with the highest percentage of drunk-driving related deaths in the United States, 17 of them are in the Midwest or share a border with a Plains state and 15 are in western states. All of the states had a percentage of alcohol-impaired driving fatalities exceeding 37%.
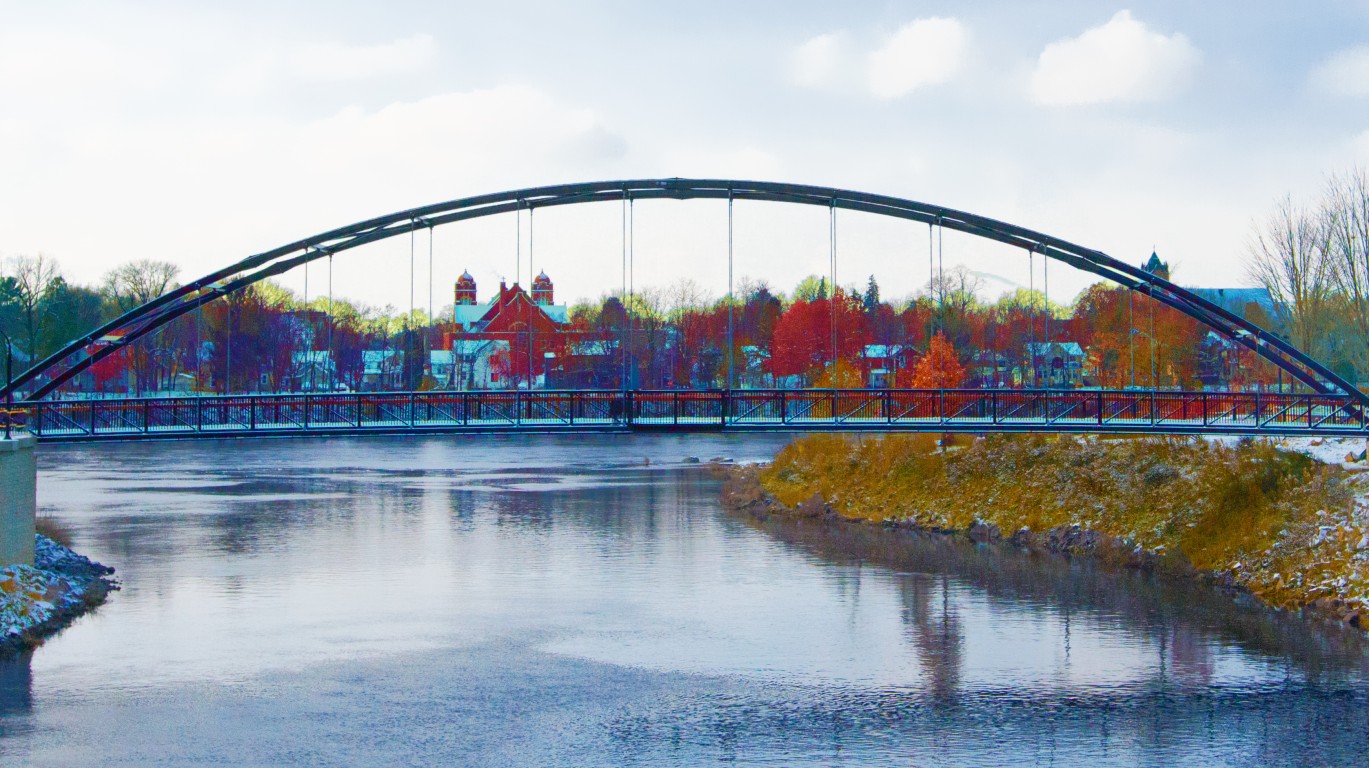
Montana, ranked 43rd in population and with the third-fewest people per square mile, had two cities in the top five of the cities with the highest percentage of drunk-driving related deaths. Great Falls, Montana, with a metro-area population of almost 85,000 — third-lowest on our list — had the highest percentage of drunk-driving related fatalities at 51.9%.
Wisconsin had the most metro areas on the list with five. The Badger State also had the five cities that drank the most. Alcohol consumption is high in Wisconsin because it is sold in more places than other states; the price of liquor is low in comparison with other states; and liquor is heavily advertised, particularly on public transit.
Drunk-driving fatalities occur more frequently in the western states because of the greater distances motorists drive and weather conditions, particularly in the winter, can be more hazardous in that part of the country than other areas.
Cleveland-Elyria in Ohio and Columbia, South Carolina, the two biggest metropolitan areas on the list, also had the most total deaths, with 298 and 277, respectively. (This is the drunkest city in the U.S.: Ranking America’s Top 50.)
Here are the cities with the most drunk driving related deaths in the US.
40. Odessa, Texas
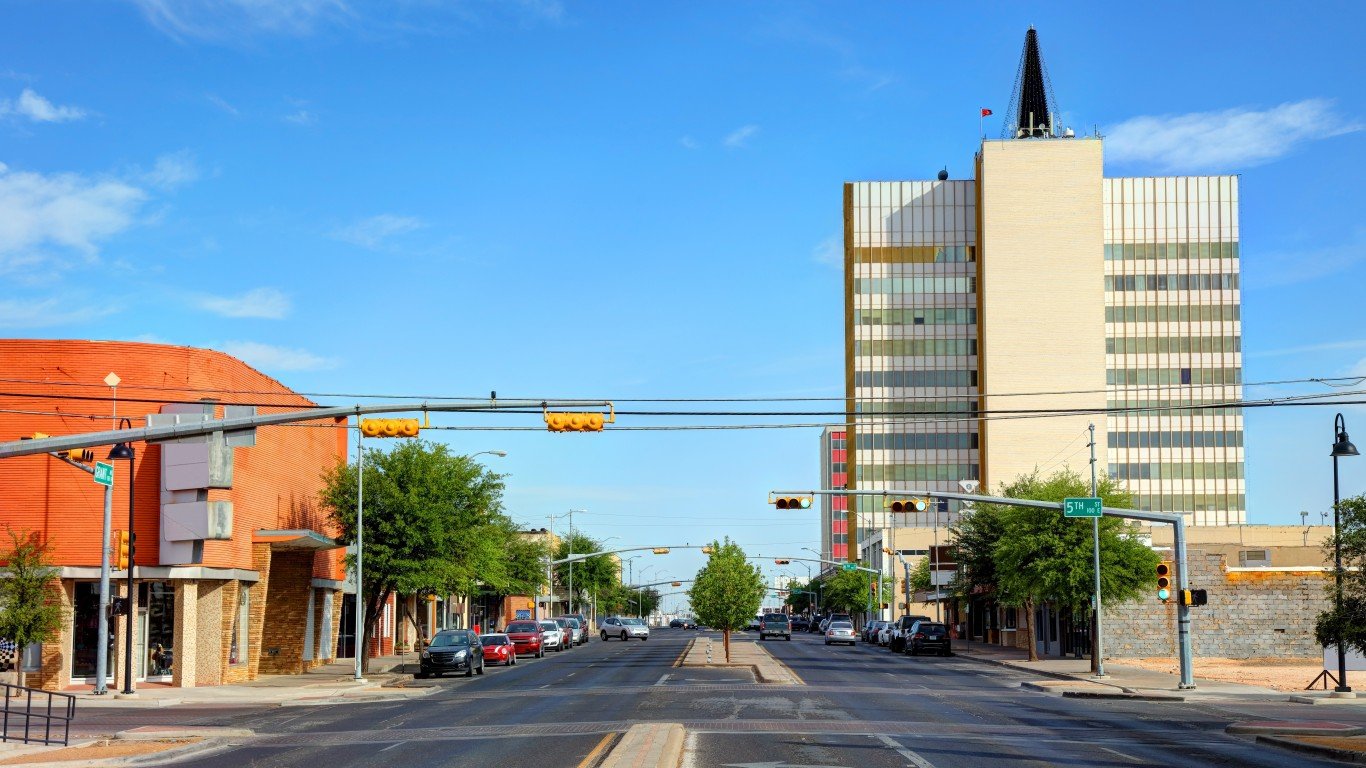
- Alcohol-impaired driving fatalities: 37.1%
- Total driving fatalities: 92 — No. 98 out of 384 metros
- Adults drinking excessively: 19.5% — No.167 out of 384 metros
- Population: 160,869 — No. 266 out of 384
39. Reno, Nevada
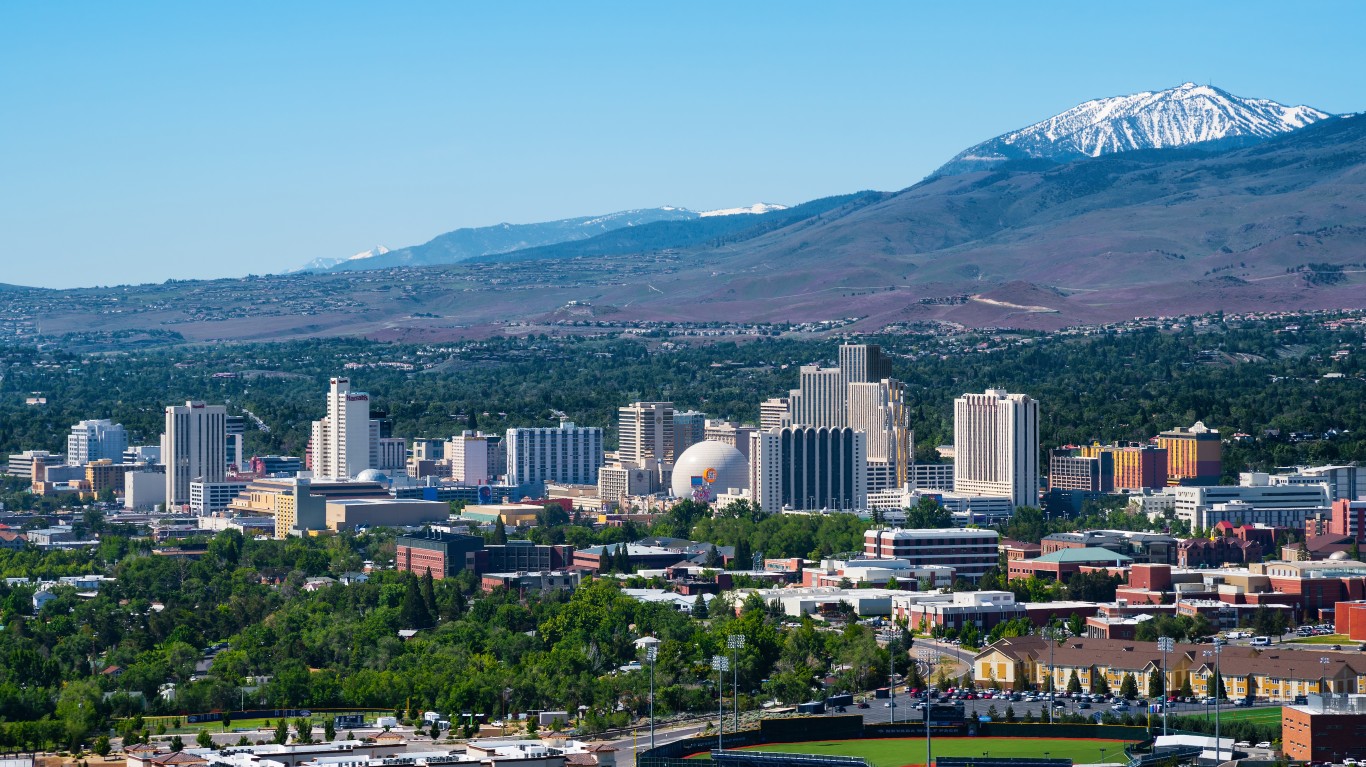
- Alcohol-impaired driving fatalities: 37.1%
- Total driving fatalities: 85 — No. 106 out of 384 metros
- Adults drinking excessively: 22.6% — No.33 out of 384 metros
- Population: 501,206 — No. 114 out of 384
38. San Luis Obispo-Paso Robles, California

- Alcohol-impaired driving fatalities: 37.3%
- Total driving fatalities: 60 — No. 154 out of 384 metros
- Adults drinking excessively: 22.9% — No.28 out of 384 metros
- Population: 282,013 — No. 177 out of 384
37. Bloomington, Illinois
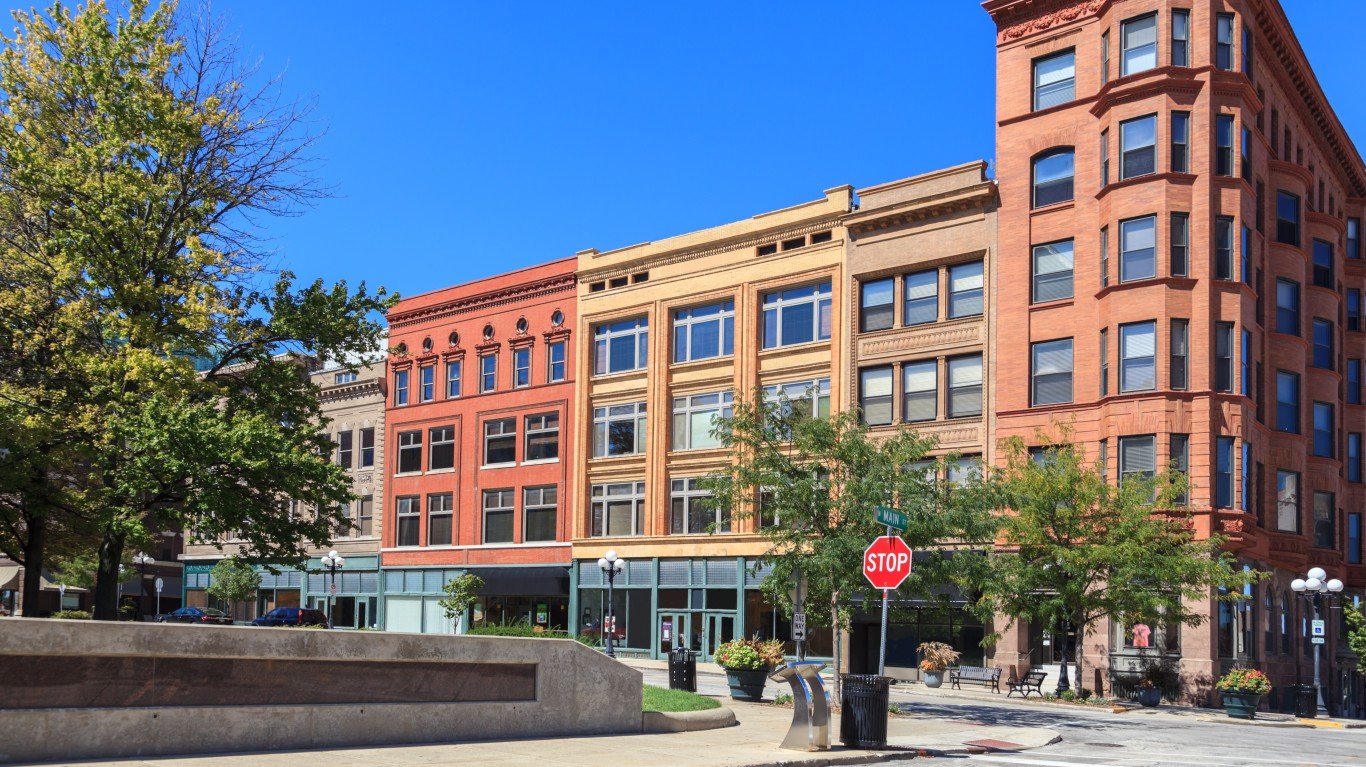
- Alcohol-impaired driving fatalities: 37.3%
- Total driving fatalities: 22 — No. 300 out of 384 metros
- Adults drinking excessively: 16.7% — No.312 out of 384 metros
- Population: 171,141 — No. 253 out of 384
36. Florence, South Carolina
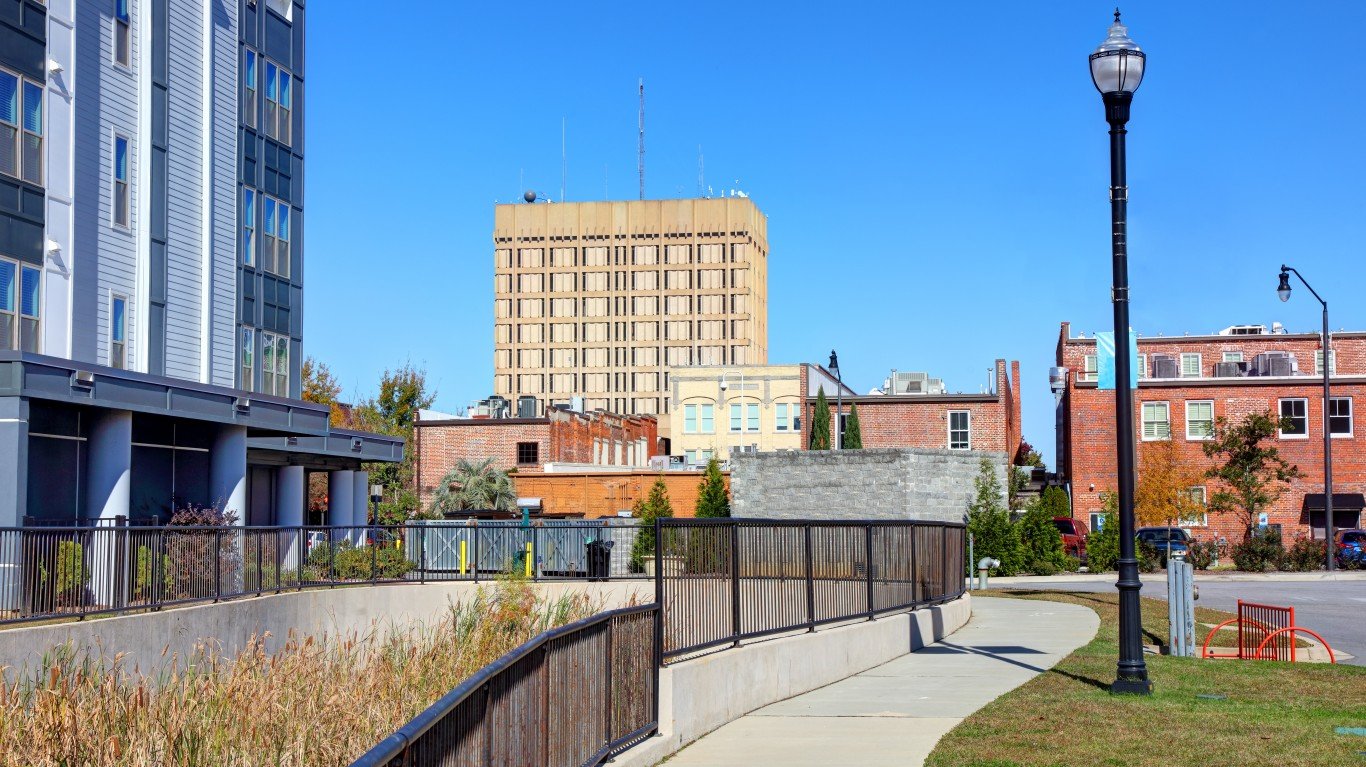
- Alcohol-impaired driving fatalities: 37.4%
- Total driving fatalities: 101 — No. 91 out of 384 metros
- Adults drinking excessively: 16.5% — No.323 out of 384 metros
- Population: 199,119 — No. 227 out of 384
34. Lima, Ohio

- Alcohol-impaired driving fatalities: 37.5%
- Total driving fatalities: 21 — No. 309 out of 384 metros
- Adults drinking excessively: 19.6% — No.160 out of 384 metros
- Population: 101,115 — No. 356 out of 384
34. Appleton, Wisconsin

- Alcohol-impaired driving fatalities: 37.5%
- Total driving fatalities: 33 — No. 230 out of 384 metros
- Adults drinking excessively: 26.0% — No.9 out of 384 metros
- Population: 244,845 — No. 197 out of 384
33. Green Bay, Wisconsin
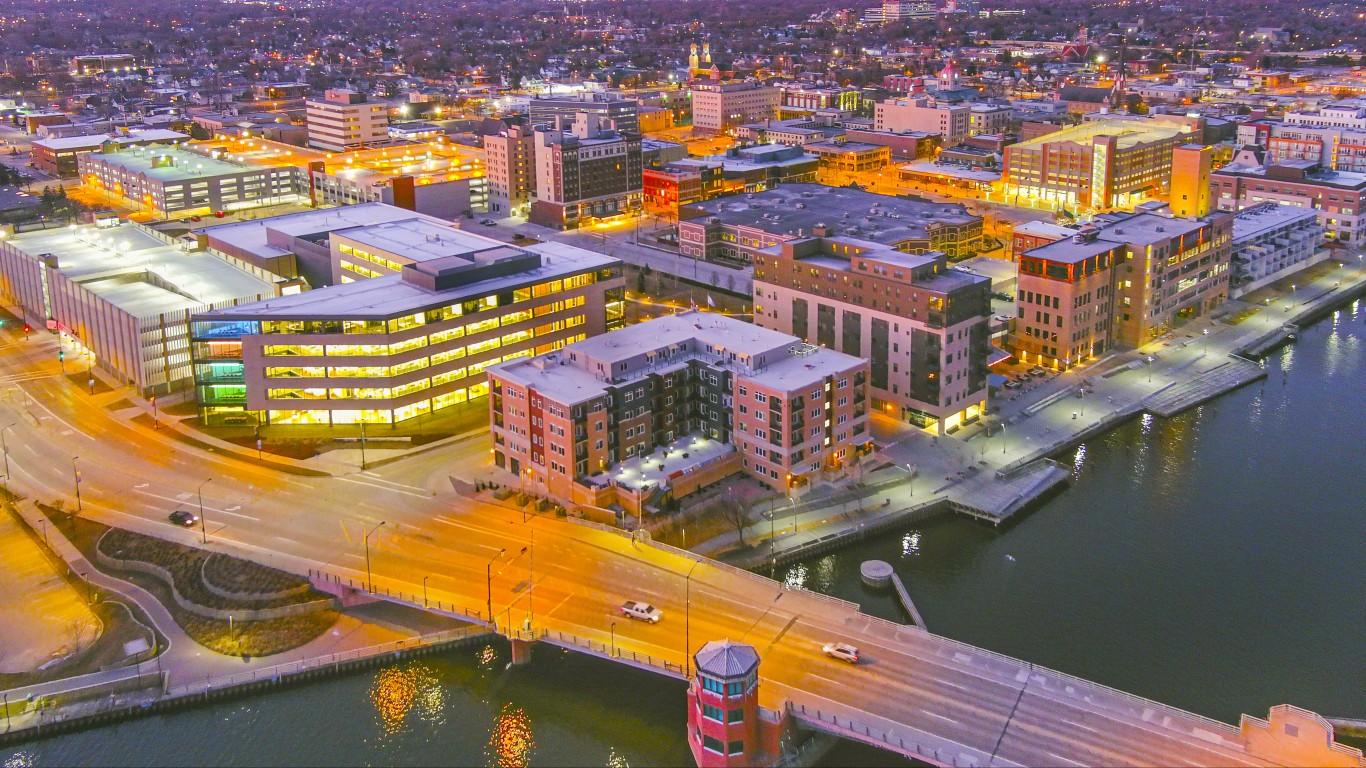
- Alcohol-impaired driving fatalities: 37.6%
- Total driving fatalities: 53 — No. 172 out of 384 metros
- Adults drinking excessively: 26.8% — No.5 out of 384 metros
- Population: 330,292 — No. 158 out of 384
32. Salinas, California
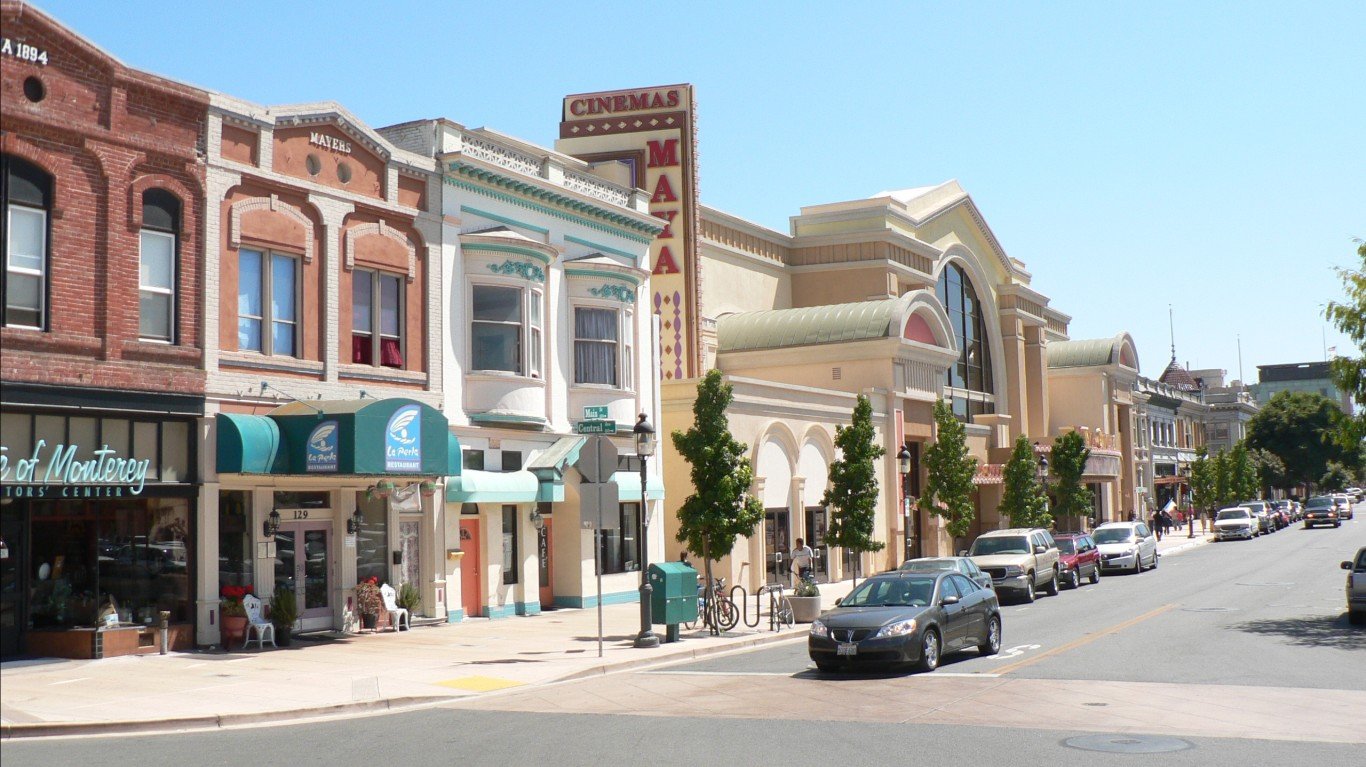
- Alcohol-impaired driving fatalities: 37.6%
- Total driving fatalities: 91 — No. 100 out of 384 metros
- Adults drinking excessively: 19.9% — No.144 out of 384 metros
- Population: 432,858 — No. 126 out of 384
31. Fargo, North Dakota-Minnesota
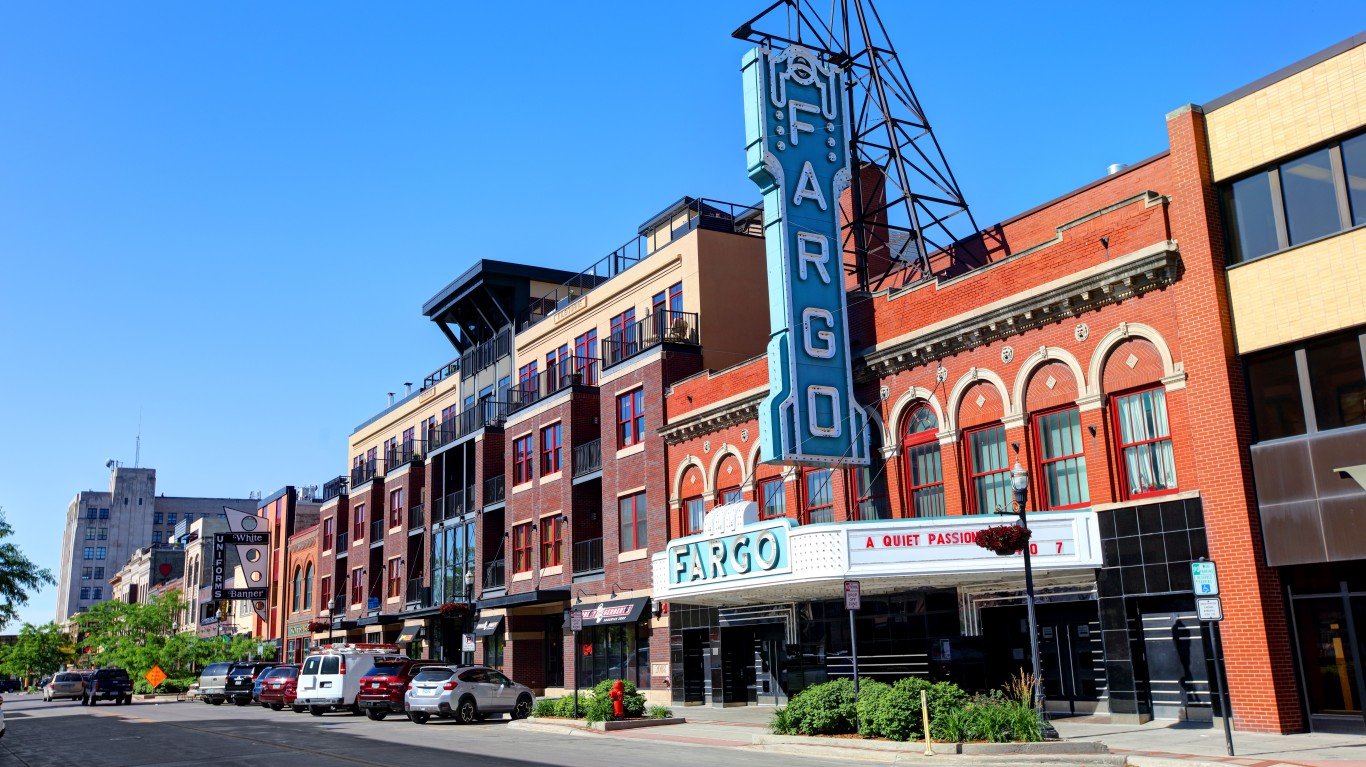
- Alcohol-impaired driving fatalities: 37.7%
- Total driving fatalities: 23 — No. 295 out of 384 metros
- Adults drinking excessively: 22.8% — No.31 out of 384 metros
- Population: 258,663 — No. 190 out of 384
30. Eau Claire, Wisconsin
- Alcohol-impaired driving fatalities: 37.8%
- Total driving fatalities: 28 — No. 255 out of 384 metros
- Adults drinking excessively: 26.8% — No.4 out of 384 metros
- Population: 173,644 — No. 250 out of 384
29. Columbia, South Carolina
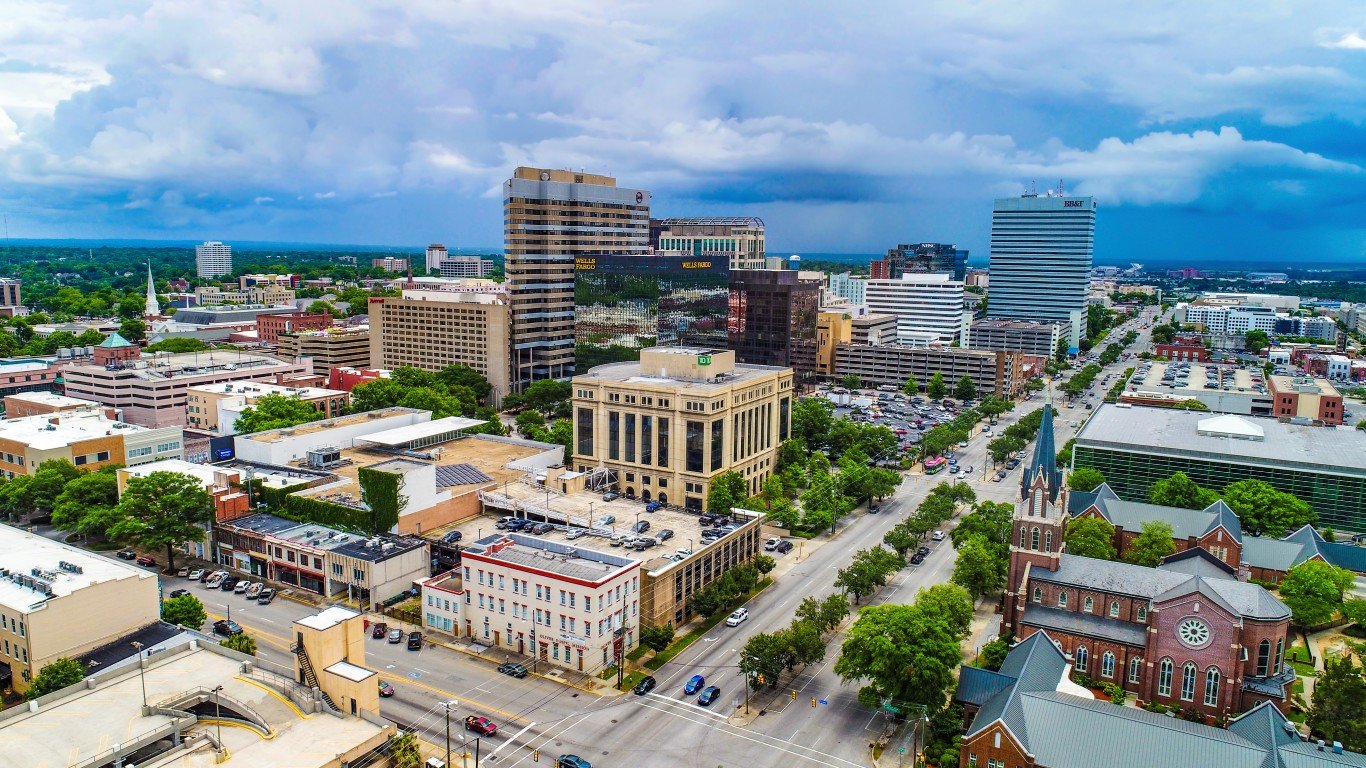
- Alcohol-impaired driving fatalities: 38.1%
- Total driving fatalities: 277 — No. 34 out of 384 metros
- Adults drinking excessively: 19.0% — No.202 out of 384 metros
- Population: 847,804 — No. 71 out of 384
28. Duluth, Minnesota-Wisconsin
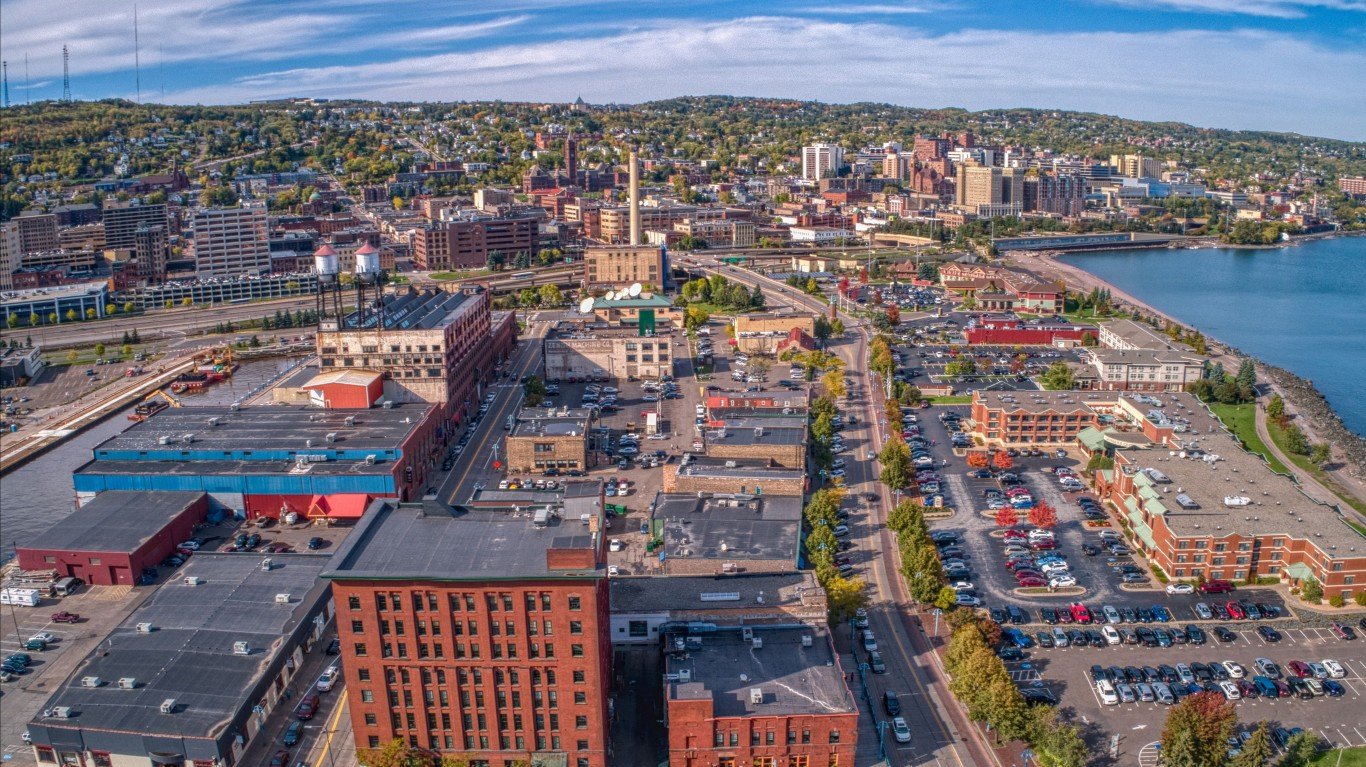
- Alcohol-impaired driving fatalities: 38.2%
- Total driving fatalities: 47 — No. 182 out of 384 metros
- Adults drinking excessively: 24.2% — No.17 out of 384 metros
- Population: 291,931 — No. 171 out of 384
27. Weirton-Steubenville, West Virginia-Ohio

- Alcohol-impaired driving fatalities: 38.2%
- Total driving fatalities: 13 — No. 357 out of 384 metros
- Adults drinking excessively: 16.3% — No.334 out of 384 metros
- Population: 114,066 — No. 338 out of 384
25. Cumberland, Maryland-West Virginia
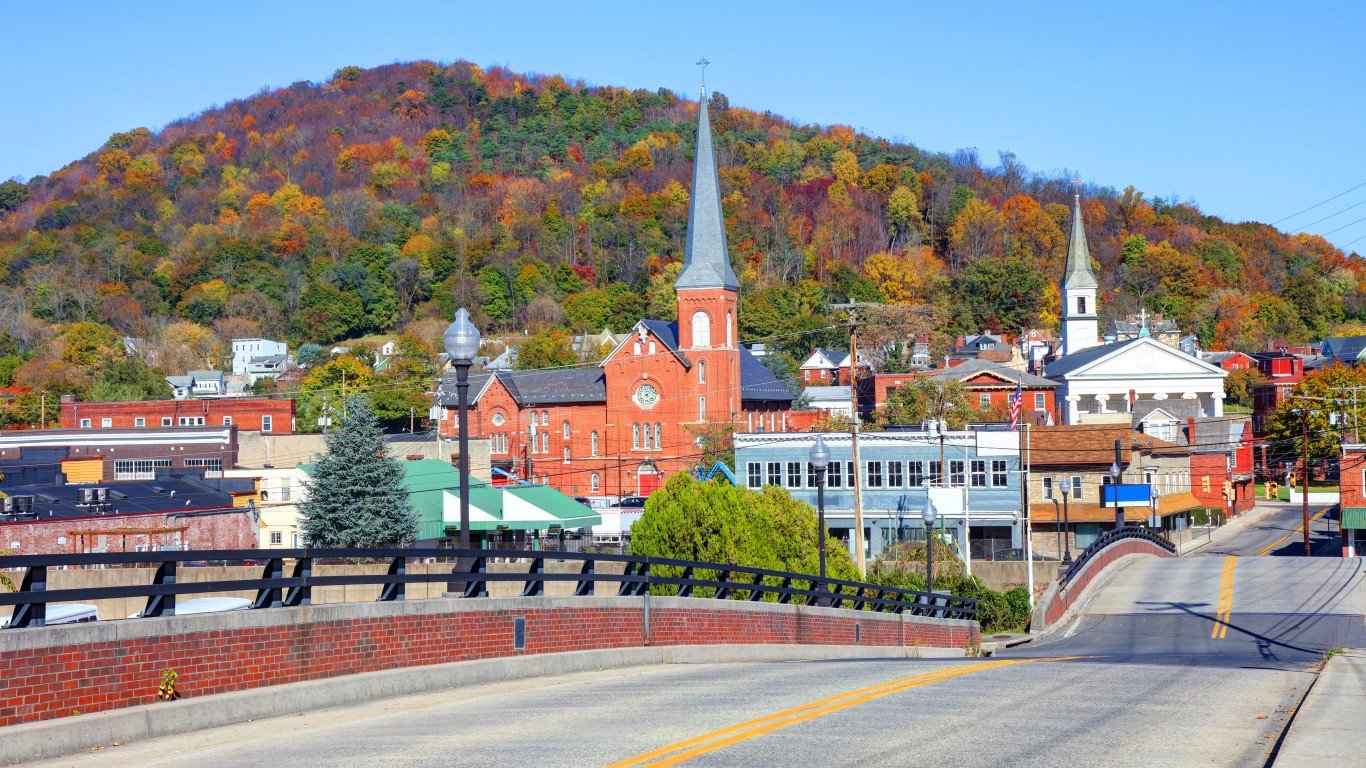
- Alcohol-impaired driving fatalities: 38.3%
- Total driving fatalities: 18 — No. 328 out of 384 metros
- Adults drinking excessively: 15.8% — No.349 out of 384 metros
- Population: 94,122 — No. 367 out of 384
25. Midland, Michigan
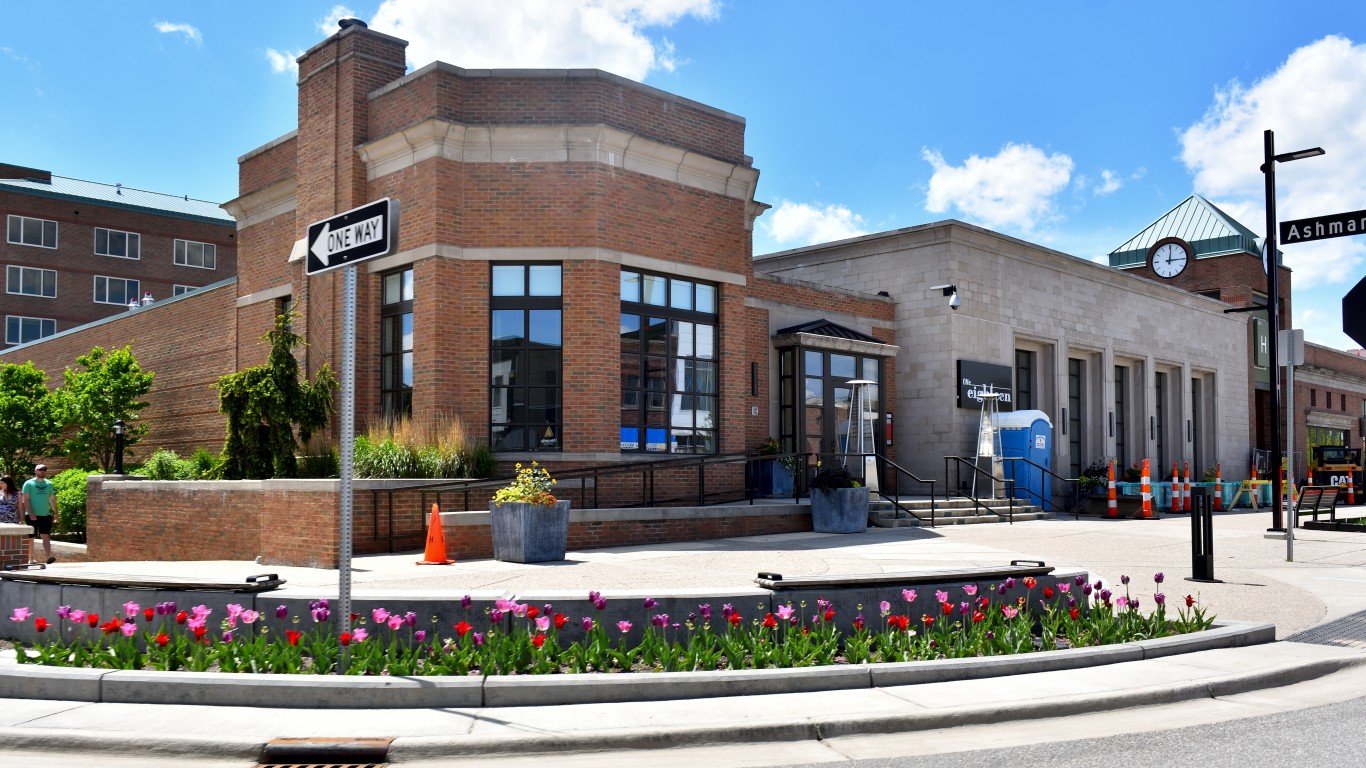
- Alcohol-impaired driving fatalities: 38.3%
- Total driving fatalities: 18 — No. 328 out of 384 metros
- Adults drinking excessively: 21.6% — No.62 out of 384 metros
- Population: 83,674 — No. 373 out of 384
24. Akron, Ohio
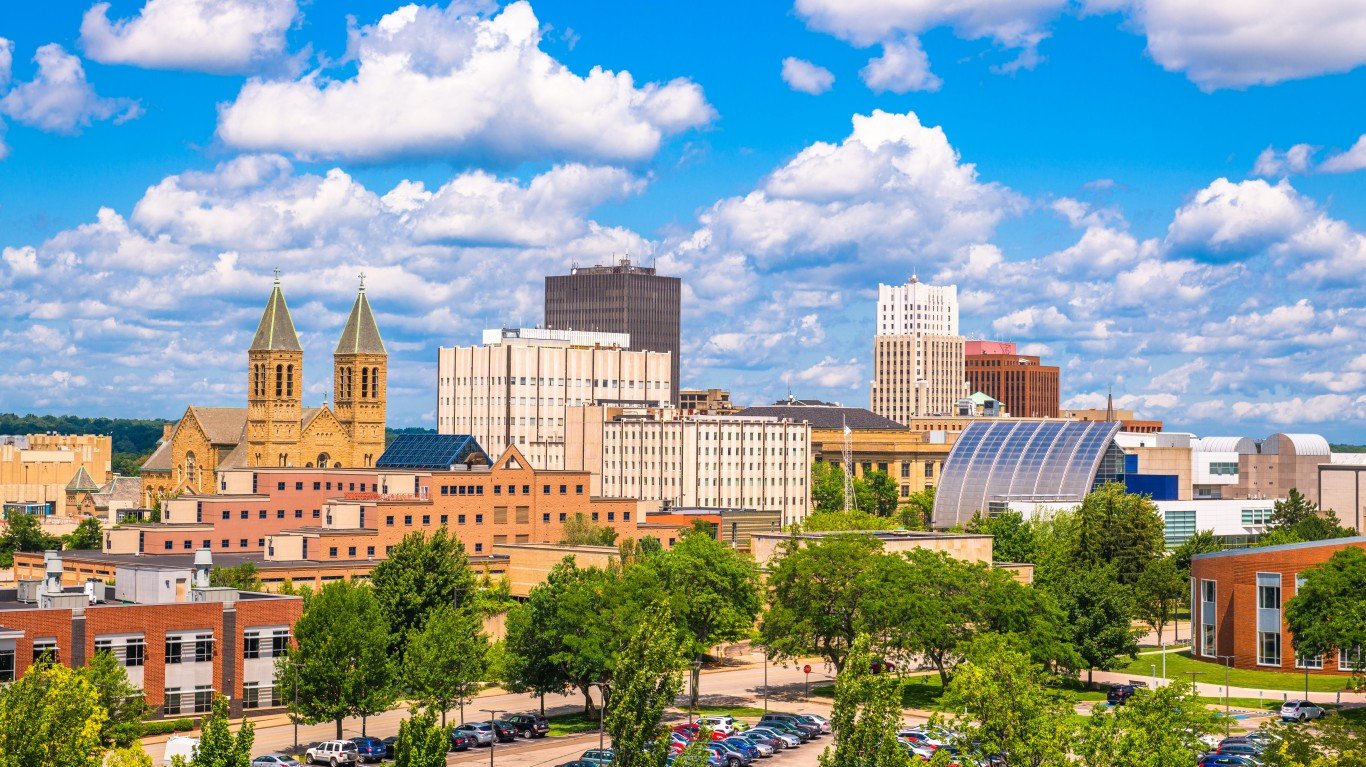
- Alcohol-impaired driving fatalities: 38.3%
- Total driving fatalities: 102 — No. 88 out of 384 metros
- Adults drinking excessively: 17.6% — No.265 out of 384 metros
- Population: 697,627 — No. 87 out of 384
23. Yakima, Washington
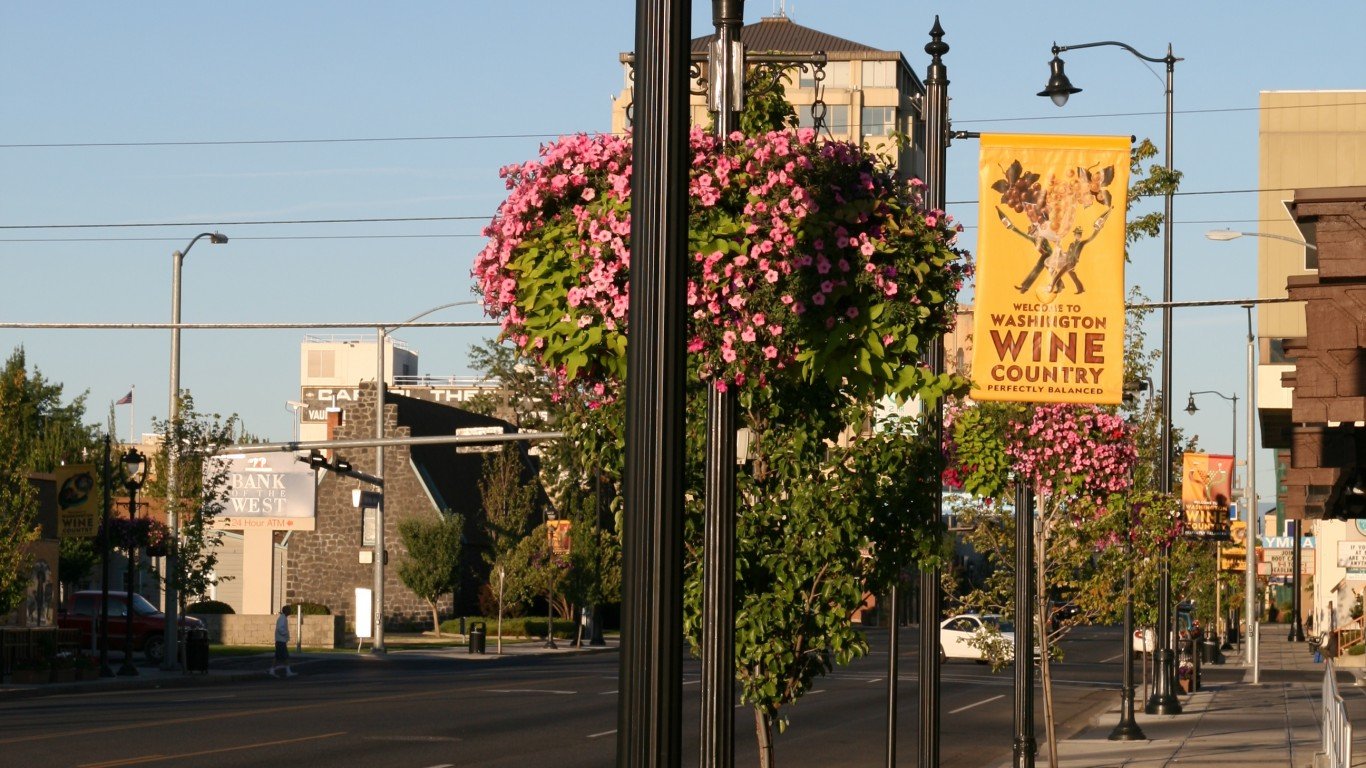
- Alcohol-impaired driving fatalities: 38.4%
- Total driving fatalities: 66 — No. 137 out of 384 metros
- Adults drinking excessively: 15.3% — No.356 out of 384 metros
- Population: 257,001 — No. 191 out of 384
22. Barnstable Town, Massachusetts
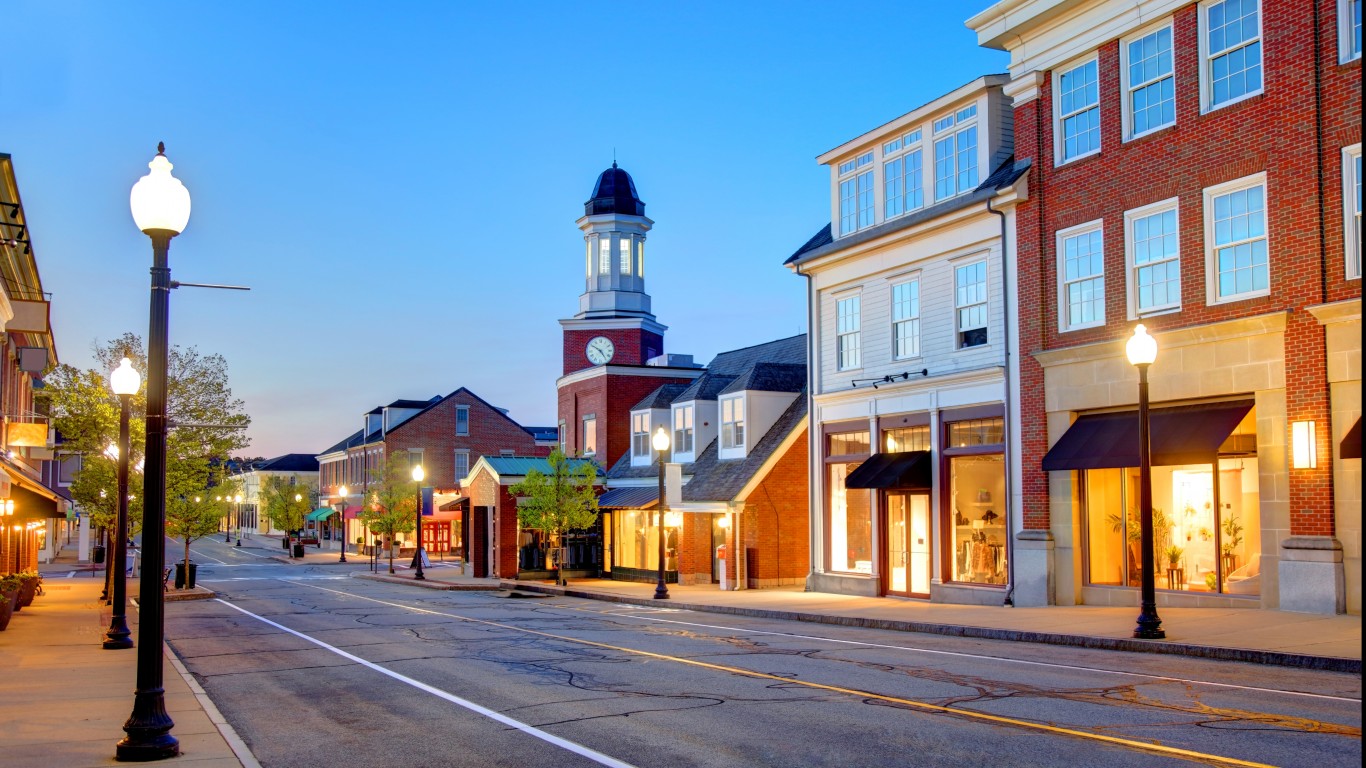
- Alcohol-impaired driving fatalities: 38.8%
- Total driving fatalities: 26 — No. 269 out of 384 metros
- Adults drinking excessively: 24.2% — No.16 out of 384 metros
- Population: 232,457 — No. 200 out of 384
21. Oxnard-Thousand Oaks-Ventura, California
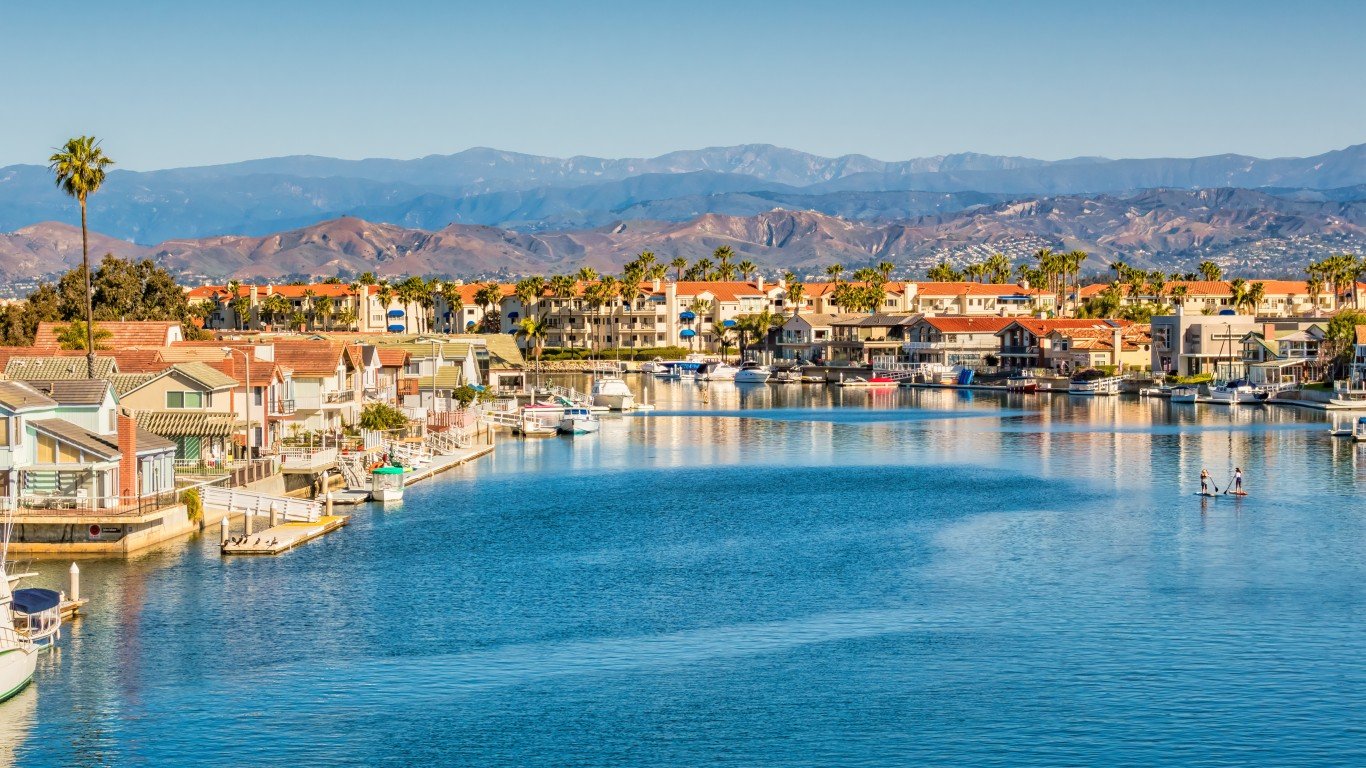
- Alcohol-impaired driving fatalities: 38.9%
- Total driving fatalities: 102 — No. 88 out of 384 metros
- Adults drinking excessively: 19.2% — No.184 out of 384 metros
- Population: 832,605 — No. 72 out of 384
20. Rapid City, South Dakota
- Alcohol-impaired driving fatalities: 39.0%
- Total driving fatalities: 30 — No. 249 out of 384 metros
- Adults drinking excessively: 21.1% — No.82 out of 384 metros
- Population: 144,890 — No. 292 out of 384
19. San Angelo, Texas
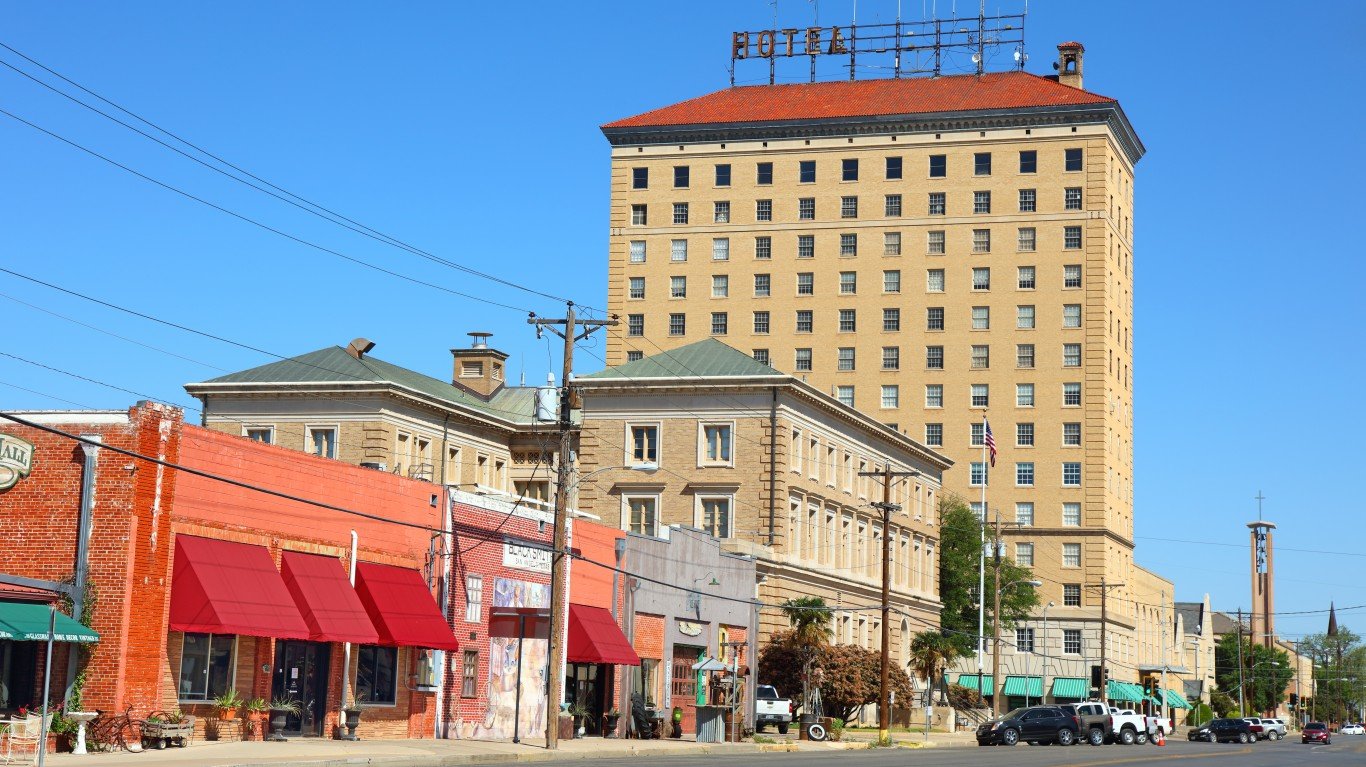
- Alcohol-impaired driving fatalities: 39.7%
- Total driving fatalities: 25 — No. 276 out of 384 metros
- Adults drinking excessively: 20.7% — No.106 out of 384 metros
- Population: 121,834 — No. 324 out of 384
18. Spokane-Spokane Valley, Washington

- Alcohol-impaired driving fatalities: 39.7%
- Total driving fatalities: 83 — No. 109 out of 384 metros
- Adults drinking excessively: 19.1% — No.193 out of 384 metros
- Population: 597,919 — No. 98 out of 384
17. Kankakee, Illinois

- Alcohol-impaired driving fatalities: 40.0%
- Total driving fatalities: 34 — No. 222 out of 384 metros
- Adults drinking excessively: 17.2% — No.280 out of 384 metros
- Population: 106,074 — No. 346 out of 384
16. Bismarck, North Dakota
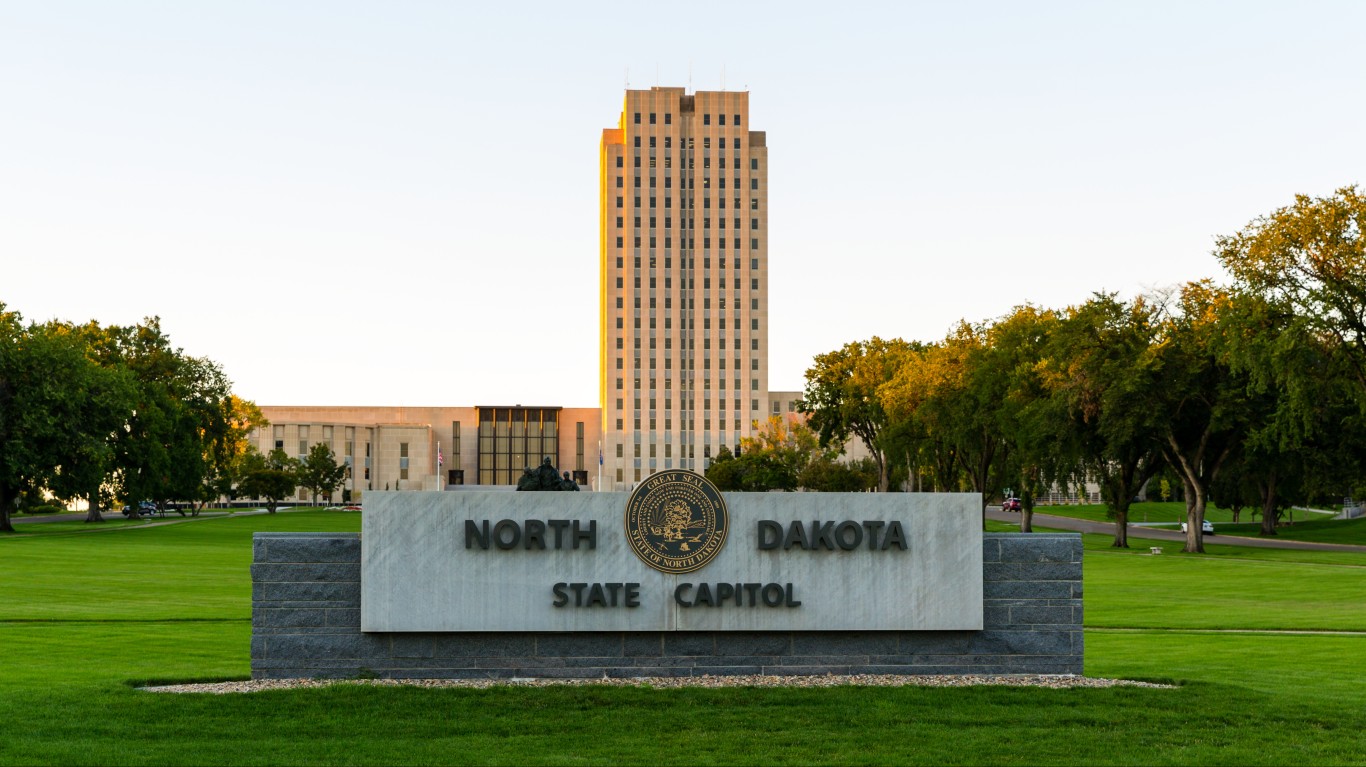
- Alcohol-impaired driving fatalities: 40.4%
- Total driving fatalities: 21 — No. 309 out of 384 metros
- Adults drinking excessively: 23.1% — No.24 out of 384 metros
- Population: 134,427 — No. 307 out of 384
15. Cleveland-Elyria, Ohio

- Alcohol-impaired driving fatalities: 40.4%
- Total driving fatalities: 298 — No. 29 out of 384 metros
- Adults drinking excessively: 20.0% — No.137 out of 384 metros
- Population: 2,063,132 — No. 34 out of 384
14. Grand Junction, Colorado

- Alcohol-impaired driving fatalities: 40.5%
- Total driving fatalities: 32 — No. 235 out of 384 metros
- Adults drinking excessively: 21.3% — No.76 out of 384 metros
- Population: 158,636 — No. 269 out of 384
13. Battle Creek, Michigan
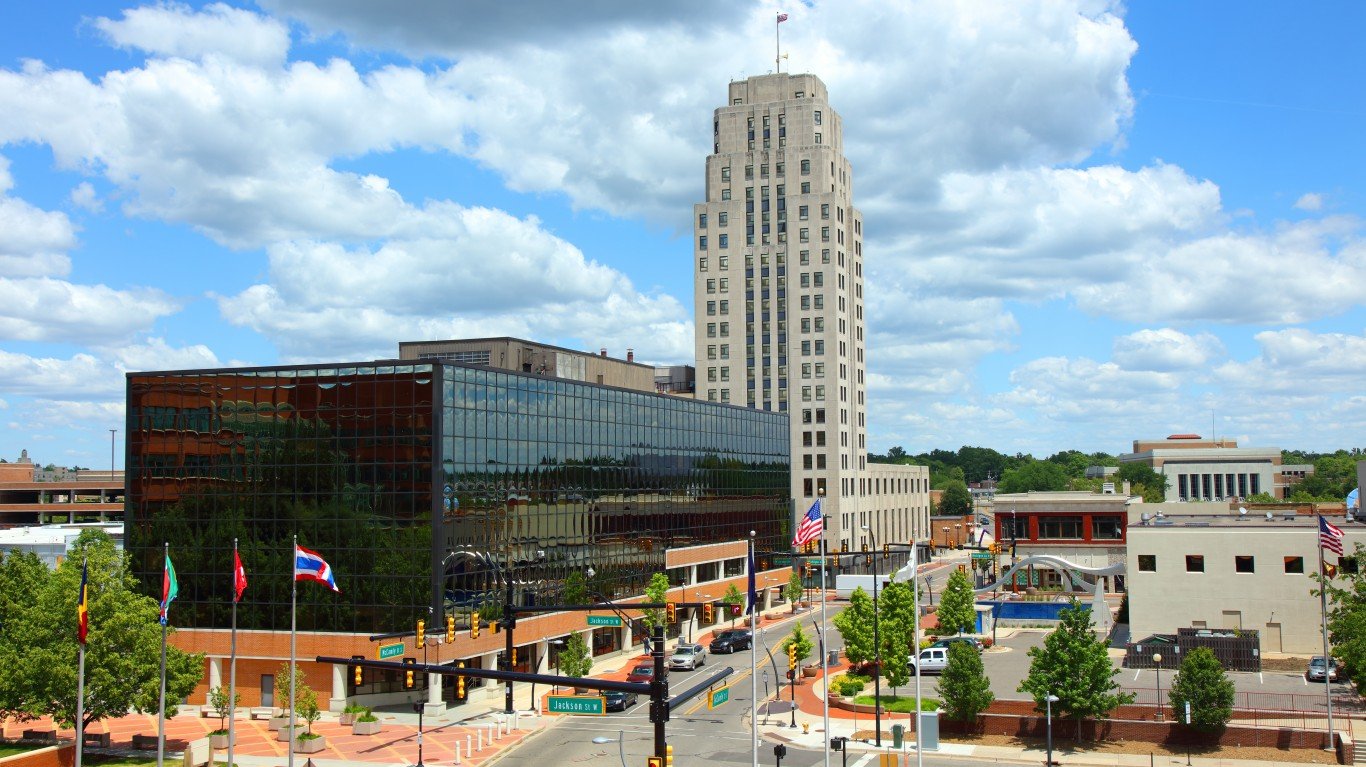
- Alcohol-impaired driving fatalities: 40.8%
- Total driving fatalities: 42 — No. 200 out of 384 metros
- Adults drinking excessively: 19.3% — No.178 out of 384 metros
- Population: 133,289 — No. 309 out of 384
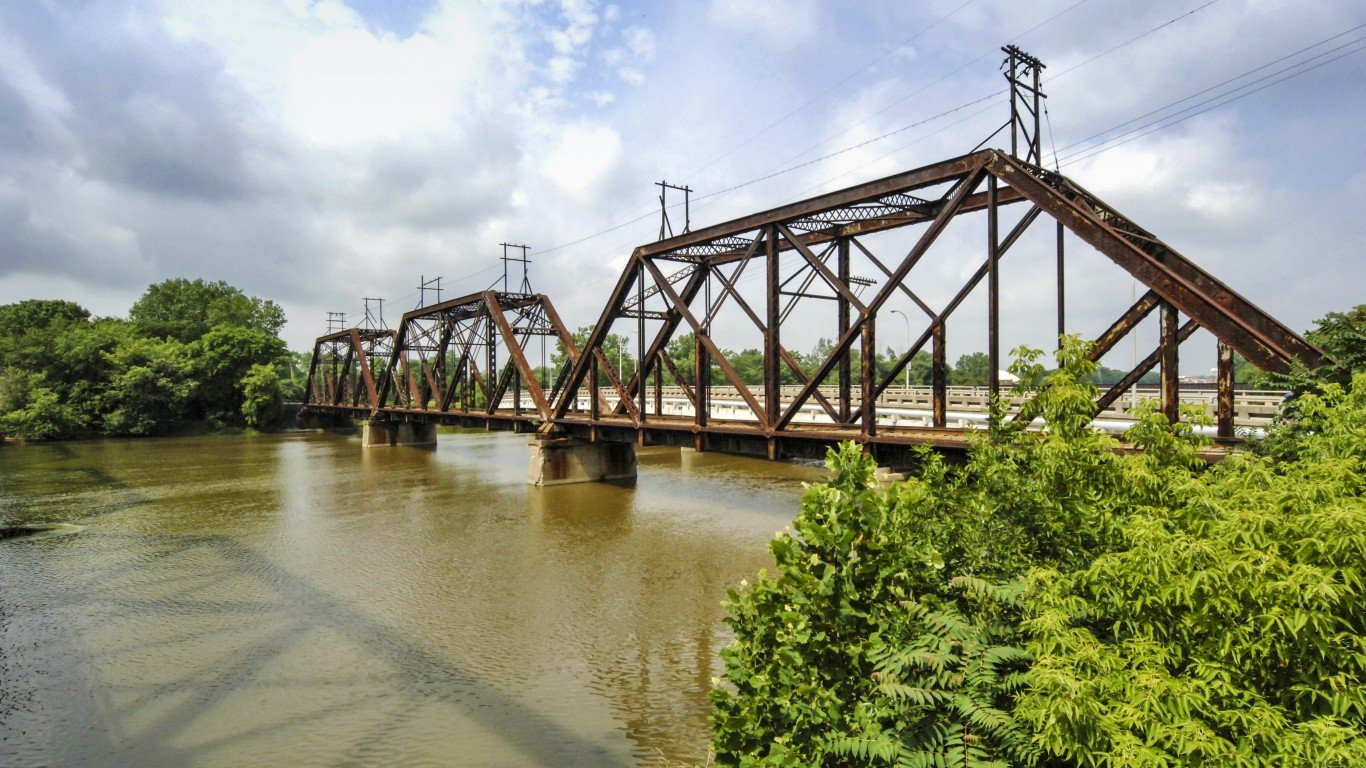
12. Danville, Illinois
- Alcohol-impaired driving fatalities: 41.8%
- Total driving fatalities: 23 — No. 295 out of 384 metros
- Adults drinking excessively: 16.0% — No.347 out of 384 metros
- Population: 72,337 — No. 380 out of 384
11. California-Lexington Park, Maryland

- Alcohol-impaired driving fatalities: 41.9%
- Total driving fatalities: 31 — No. 242 out of 384 metros
- Adults drinking excessively: 16.3% — No.335 out of 384 metros
- Population: 114,877 — No. 337 out of 384
10. Colorado Springs, Colorado

- Alcohol-impaired driving fatalities: 42.0%
- Total driving fatalities: 157 — No. 61 out of 384 metros
- Adults drinking excessively: 16.9% — No.301 out of 384 metros
- Population: 765,424 — No. 80 out of 384
9. Watertown-Fort Drum, New York
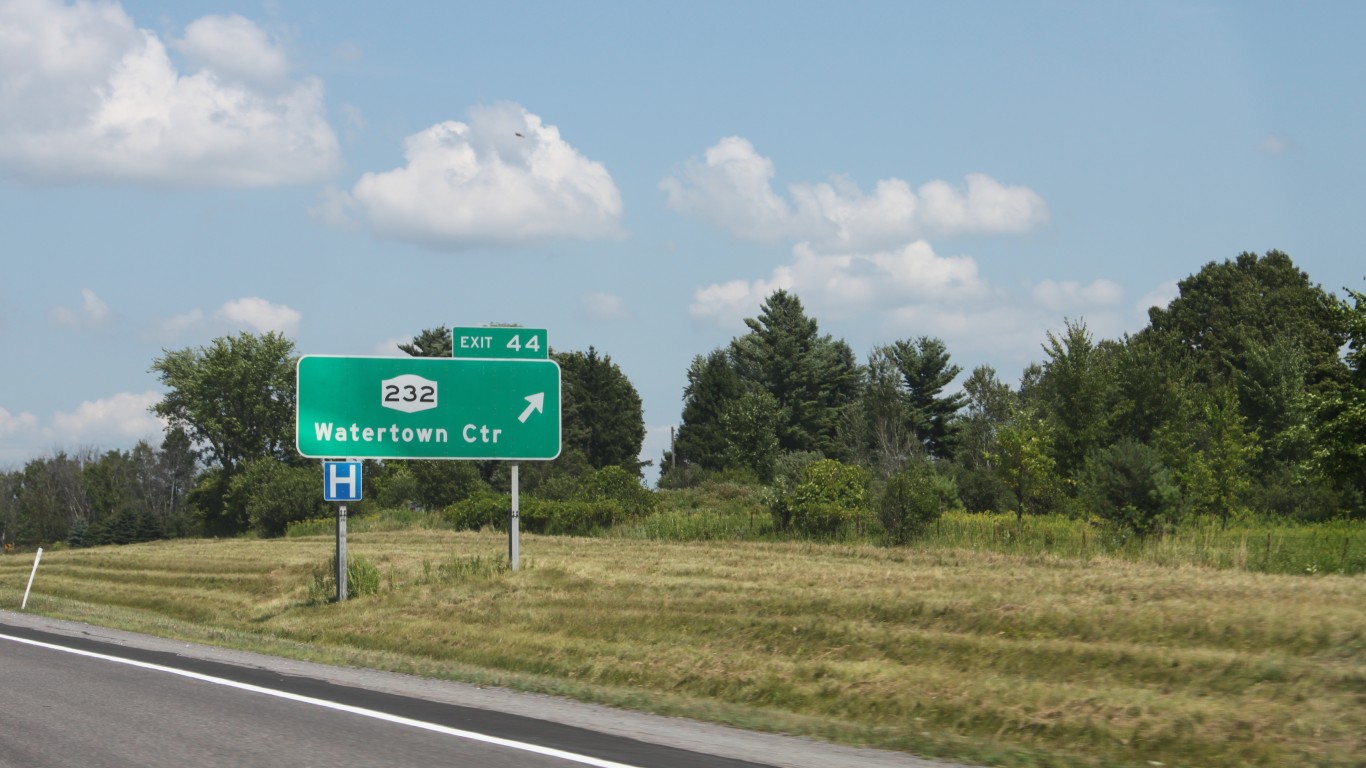
- Alcohol-impaired driving fatalities: 42.2%
- Total driving fatalities: 19 — No. 318 out of 384 metros
- Adults drinking excessively: 21.0% — No.89 out of 384 metros
- Population: 116,637 — No. 335 out of 384
8. Farmington, New Mexico
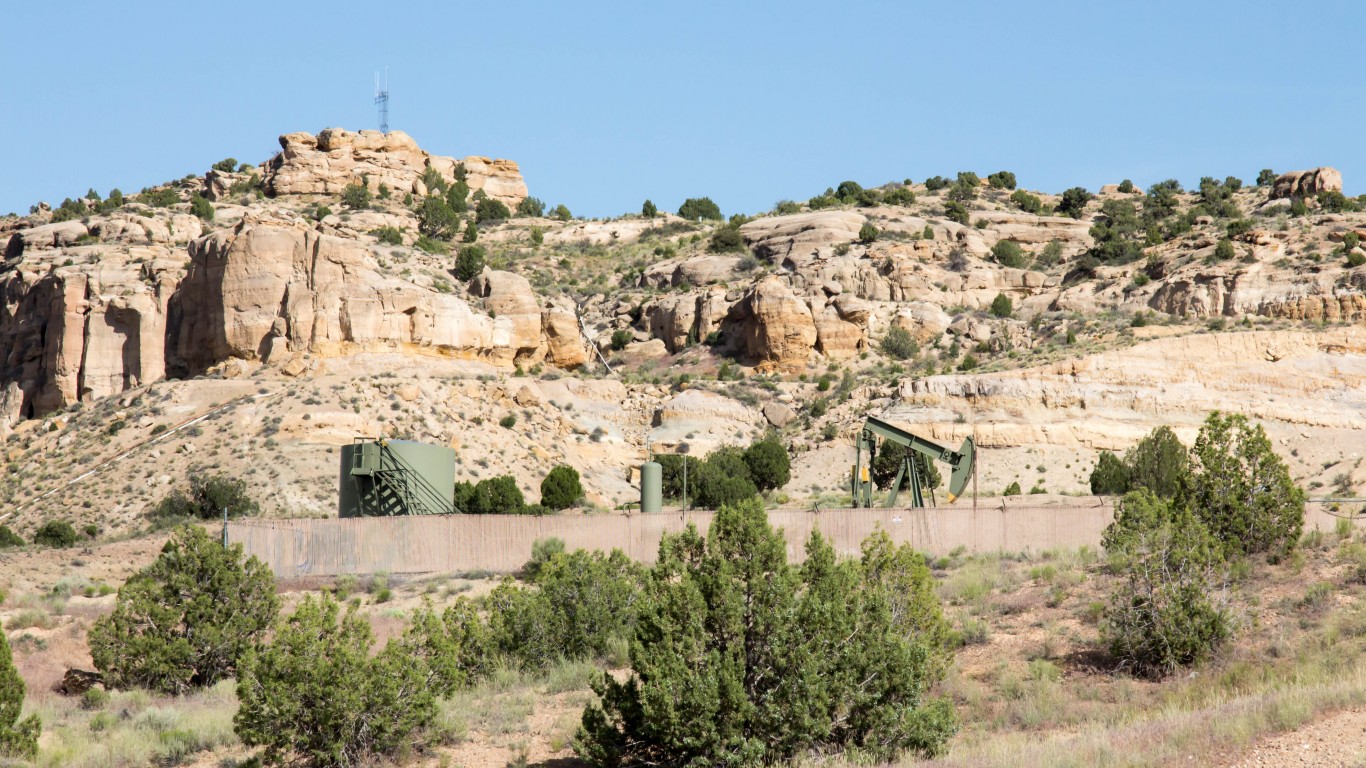
- Alcohol-impaired driving fatalities: 42.2%
- Total driving fatalities: 68 — No. 133 out of 384 metros
- Adults drinking excessively: 13.9% — No.376 out of 384 metros
- Population: 120,418 — No. 328 out of 384
7. Monroe, Michigan
- Alcohol-impaired driving fatalities: 42.6%
- Total driving fatalities: 46 — No. 187 out of 384 metros
- Adults drinking excessively: 20.9% — No.91 out of 384 metros
- Population: 155,609 — No. 275 out of 384
6. Janesville-Beloit, Wisconsin
- Alcohol-impaired driving fatalities: 43.0%
- Total driving fatalities: 49 — No. 180 out of 384 metros
- Adults drinking excessively: 25.1% — No.13 out of 384 metros
- Population: 164,060 — No. 263 out of 384
5. Billings, Montana
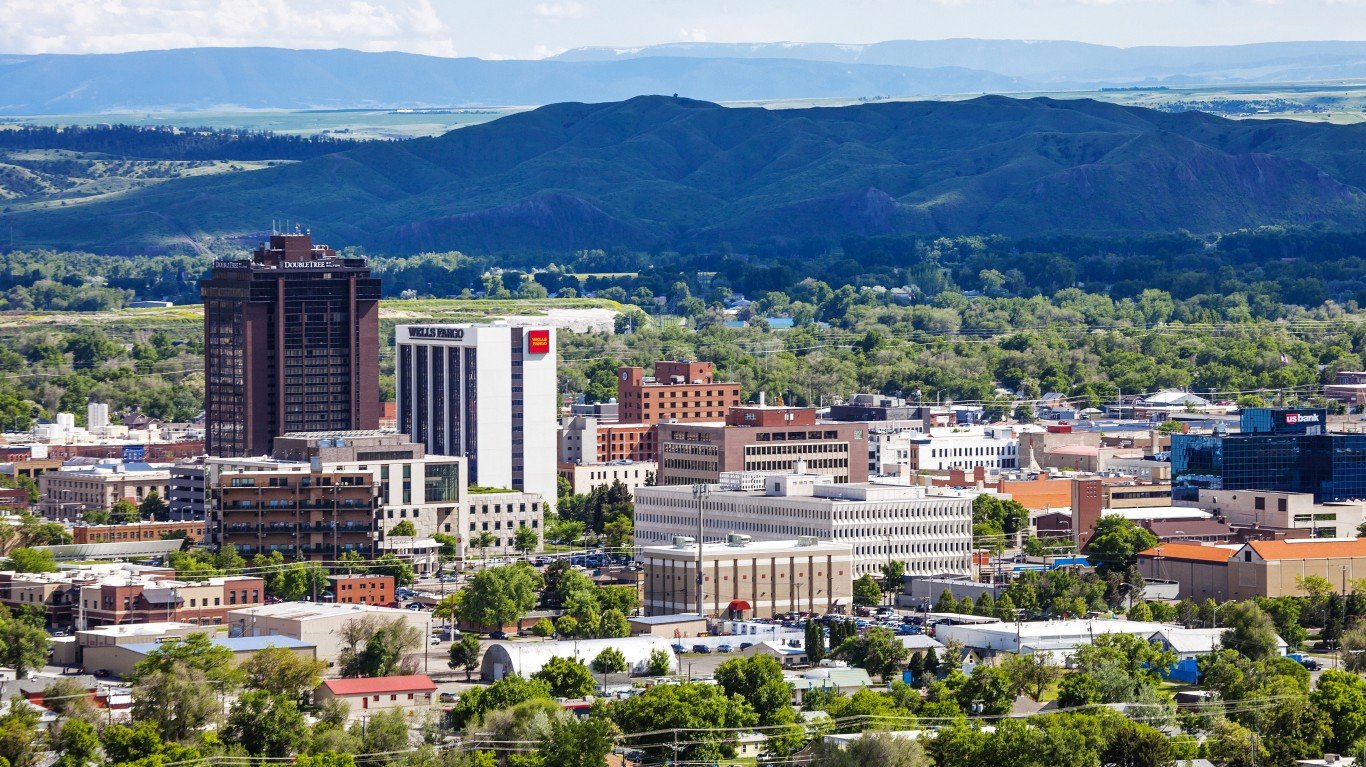
- Alcohol-impaired driving fatalities: 44.2%
- Total driving fatalities: 53 — No. 172 out of 384 metros
- Adults drinking excessively: 23.2% — No.22 out of 384 metros
- Population: 190,208 — No. 231 out of 384
4. Kahului-Wailuku-Lahaina, Hawaii

- Alcohol-impaired driving fatalities: 44.8%
- Total driving fatalities: 39 — No. 209 out of 384 metros
- Adults drinking excessively: 21.5% — No.69 out of 384 metros
- Population: 164,365 — No. 262 out of 384
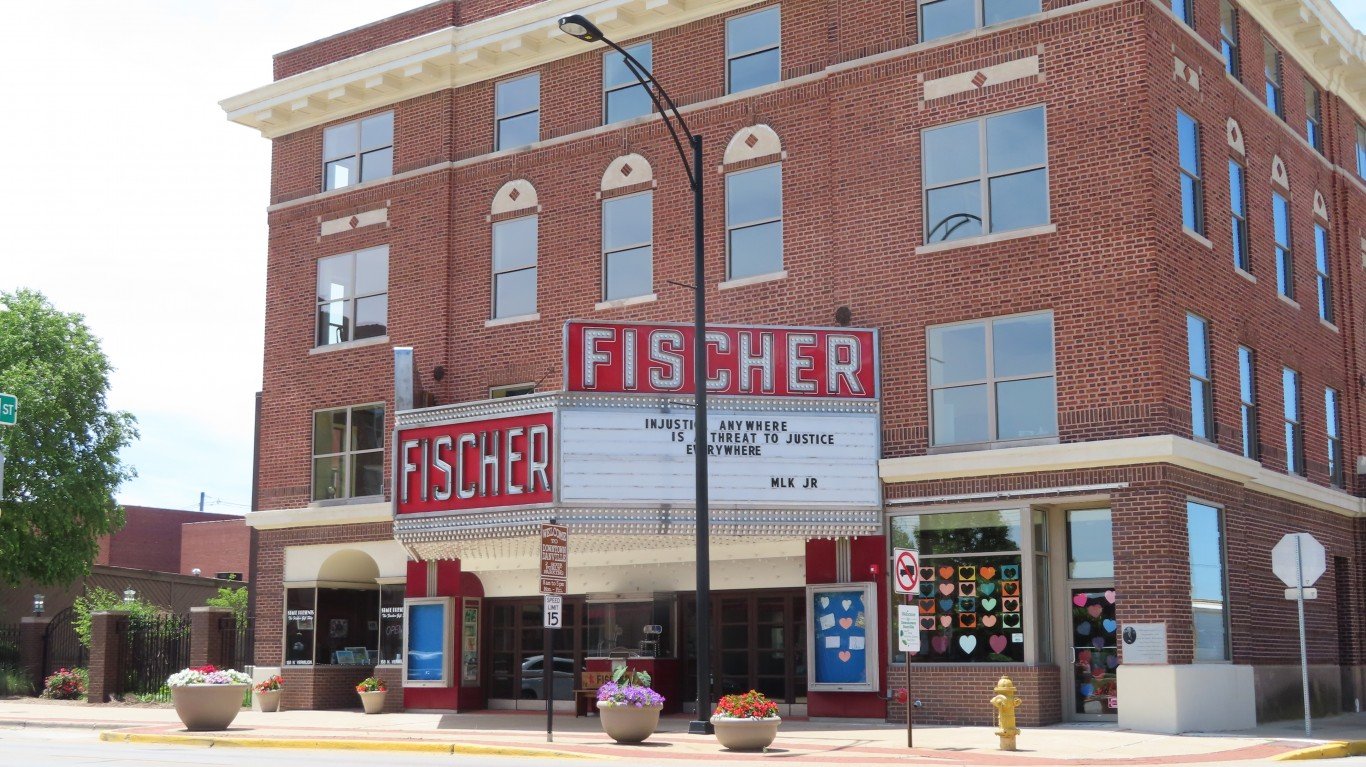
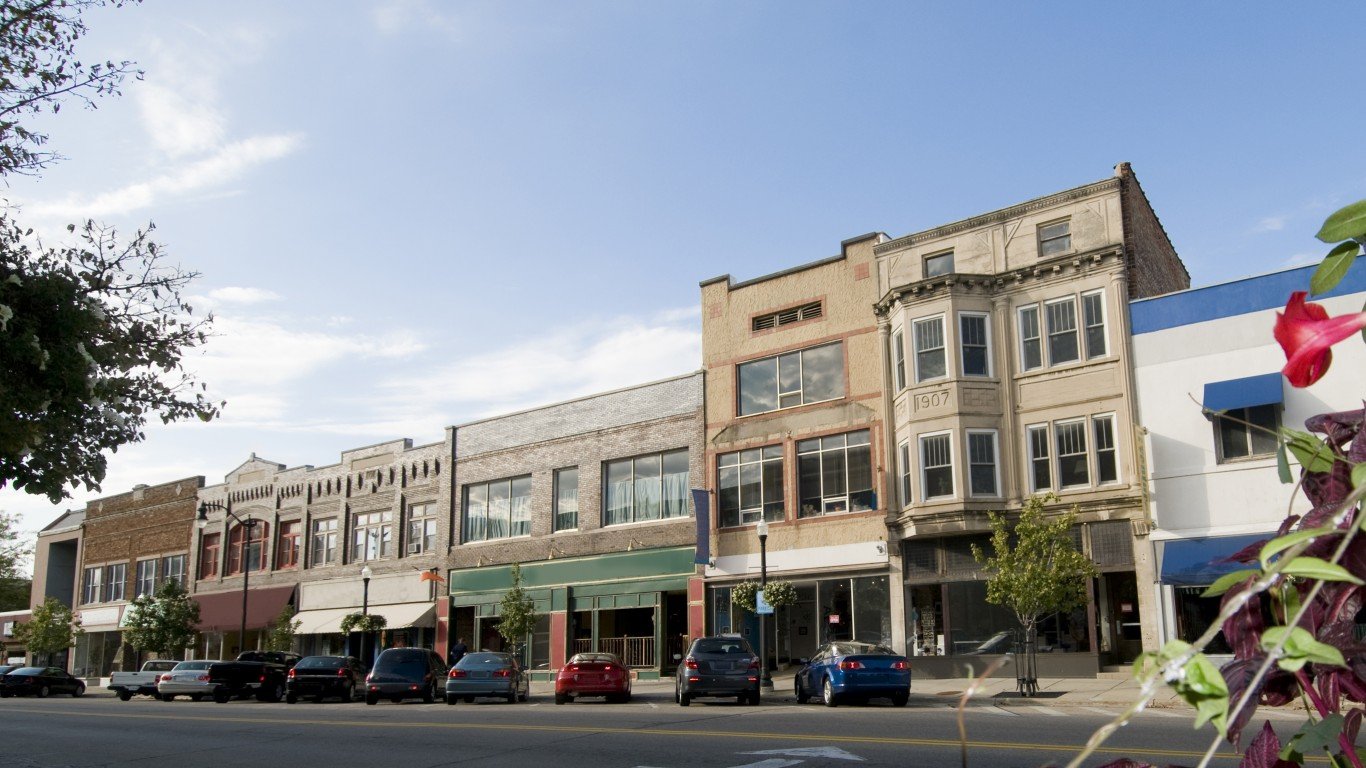
3. Decatur, Illinois

- Alcohol-impaired driving fatalities: 46.0%
- Total driving fatalities: 29 — No. 253 out of 384 metros
- Adults drinking excessively: 16.7% — No.311 out of 384 metros
- Population: 101,483 — No. 355 out of 384
2. Grants Pass, Oregon
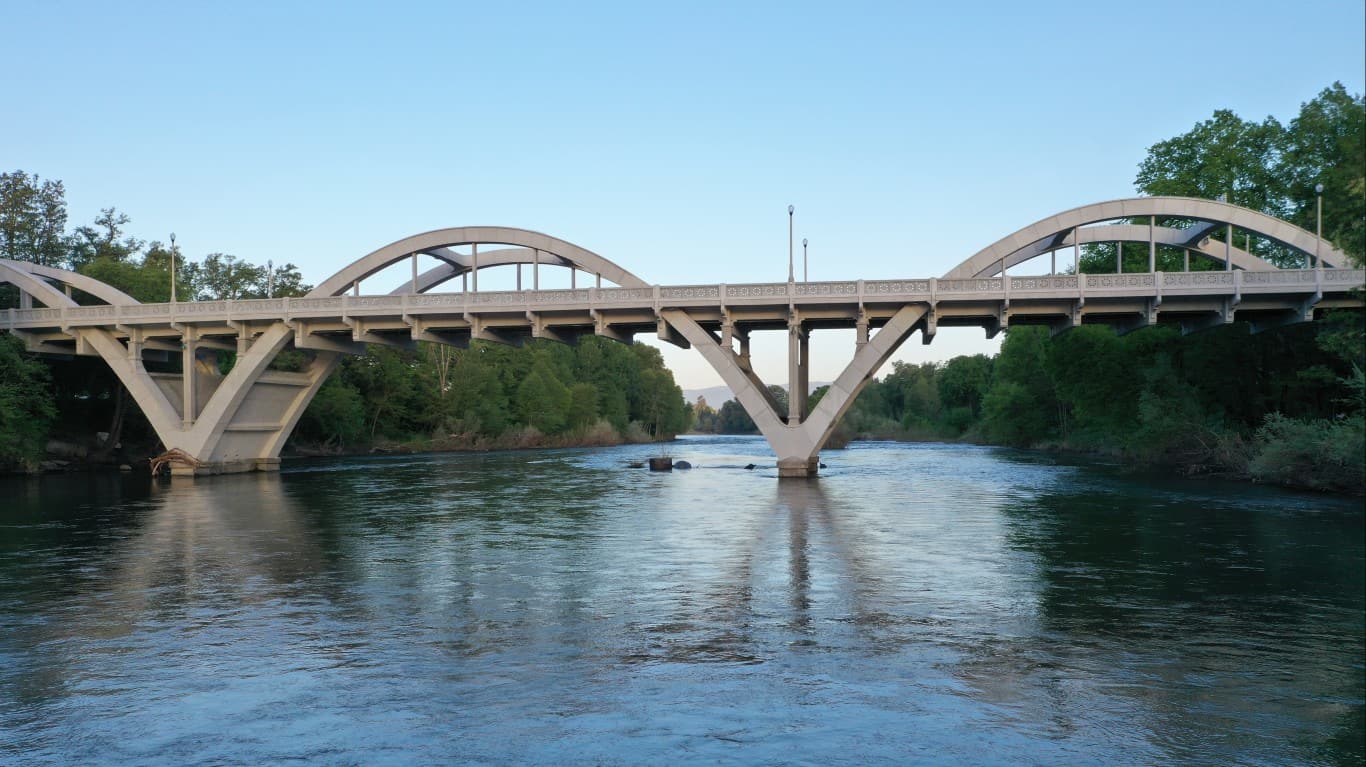
- Alcohol-impaired driving fatalities: 47.4%
- Total driving fatalities: 46 — No. 187 out of 384 metros
- Adults drinking excessively: 19.0% — No.197 out of 384 metros
- Population: 87,730 — No. 369 out of 384
1. Great Falls, Montana

- Alcohol-impaired driving fatalities: 51.9%
- Total driving fatalities: 27 — No. 264 out of 384 metros
- Adults drinking excessively: 20.5% — No.120 out of 384 metros
- Population: 84,864 — No. 371 out of 384