
Obesity has long plagued American adults as a public health crisis. From 2017-2020, close to 42% of the adult population was classified as obese – a steep uptick from the 30% rate just two decades earlier between 1999-2000. Though genetics play a role for some, personal lifestyle decisions around nutrition and fitness remain key factors driving this epidemic.
Statistics from the CDC reveal only 1 in 4 adults currently meets the recommended federal guidelines for weekly aerobic and muscle-strengthening activity. The Department of Health advises 150-300 minutes of moderate to vigorous exercise per week, equaling around 20-40 minutes daily. While establishing a regular fitness routine can prove difficult, research shows just 15 minutes of daily physical activity can yield sizable health improvements.
To determine the laziest city or metro area in every state — the city whose residents are getting the least exercise — 24/7 Tempo reviewed data from the 2023 County Health Rankings, a collaboration between the Robert Wood Johnson Foundation and University of Wisconsin Population Health Institute. The data reflects the self-reported share of adults in a city or metro area who do not exercise during their leisure time.
Physical activity participation differs substantially between cities and their encompassing states. Out of 50 metropolitan areas analyzed, 45 have higher rates of exercise inactivity than their corresponding state overall, with only 5 cities proving exceptions. In these outliers – Fairbanks, Providence, Rapid City, Hattiesburg and Grand Fork, Burlington – the margin between city and statewide inactivity rates is quite small at 0.1-1.9 percentage points.
Additionally, when comparing obesity rates rather than exercise alone, just 9 out of 50 metro areas best the obesity rate of their state population at large. (Here’s a look at the most obese city in every state.)
Alabama: Dothan
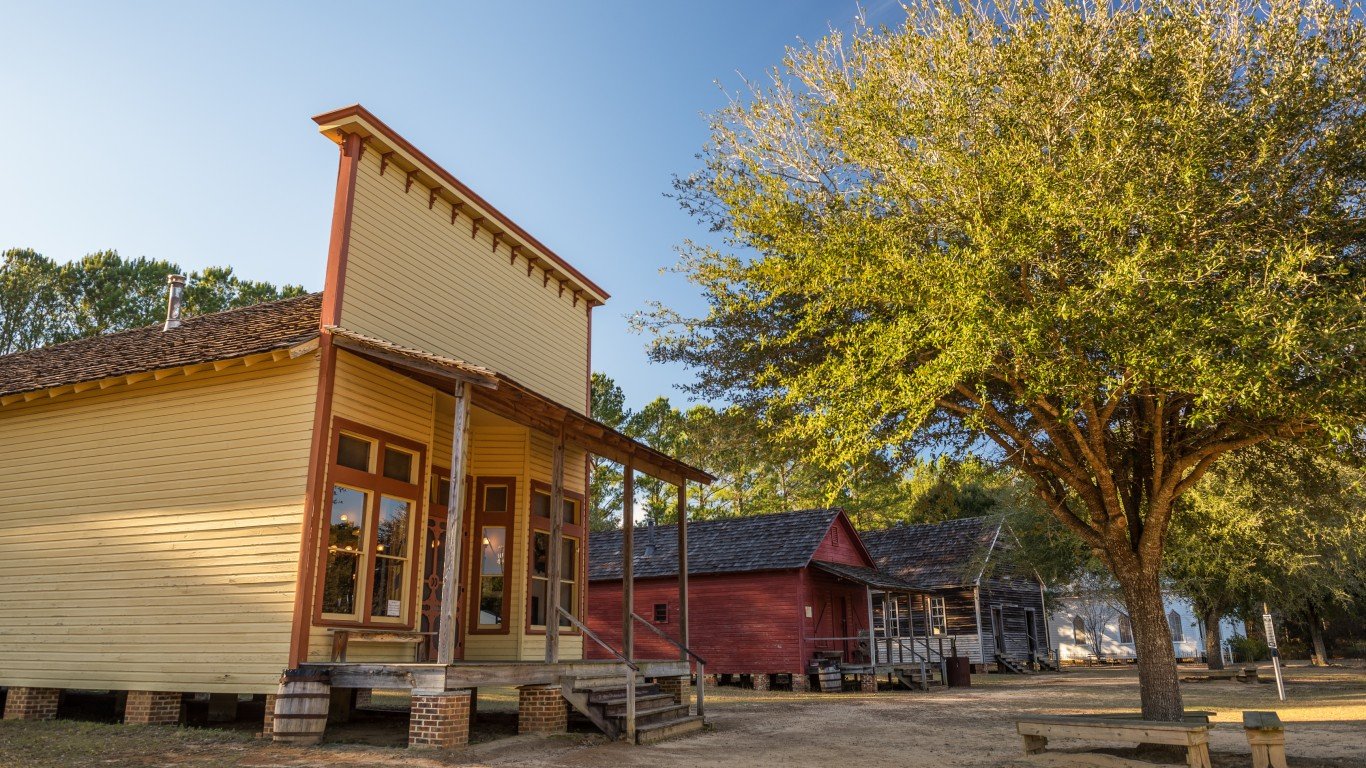
- Adults who report not exercising: 31.70% (state: 27.8%)
- Population with no access to places for exercise: 61.60% (state: 60.9%)
- Adult obesity rate: 39.30% (state: 39.3%)
- Adults who report fair/poor health: 20.20% (state: 18.9%)
- Average days people reported feeling unhealthy: 3.8 a month (state: 3.5 a month)
Alaska: Fairbanks
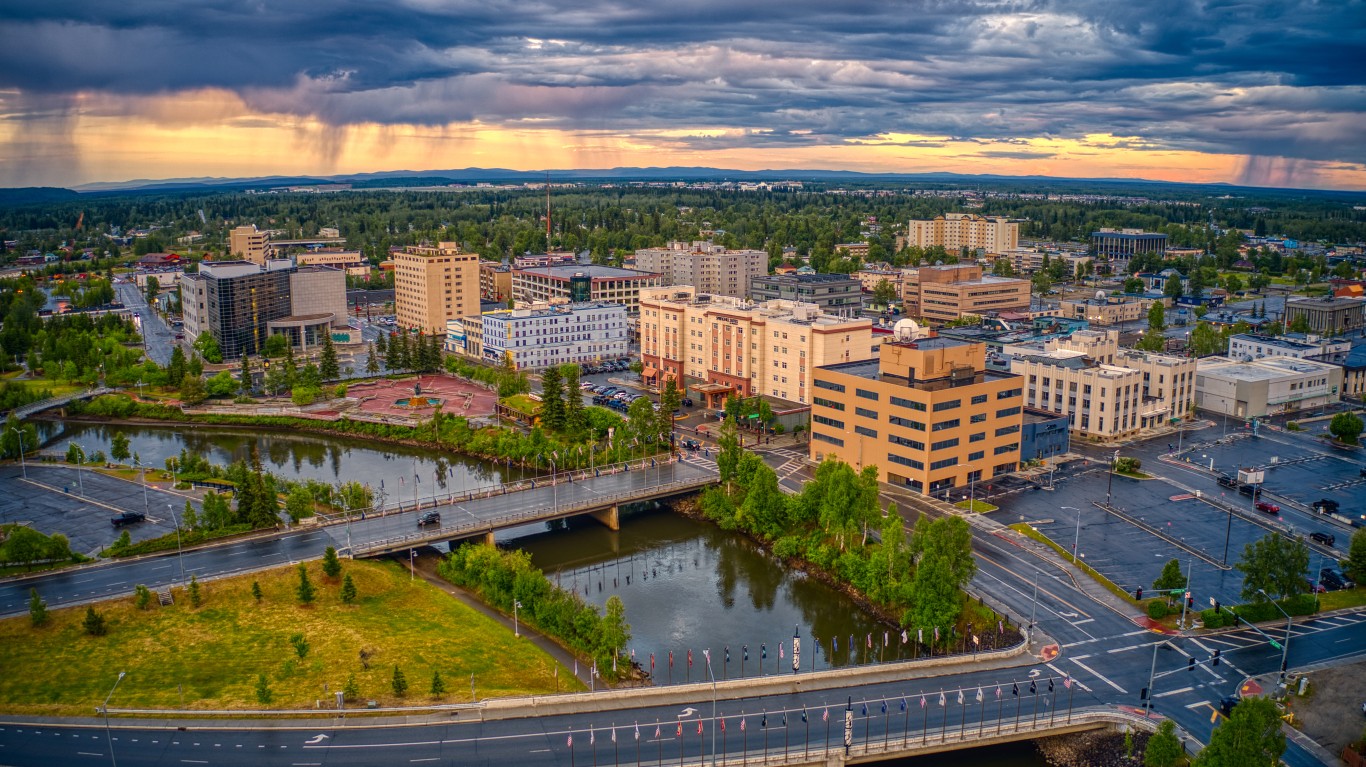
- Adults who report not exercising: 21.00% (state: 21.1%)
- Population with no access to places for exercise: 76.40% (state: 75.7%)
- Adult obesity rate: 31.20% (state: 31.8%)
- Adults who report fair/poor health: 11.90% (state: 12.2%)
- Average days people reported feeling unhealthy: 3.1 a month (state: 3.0 a month)
Arizona: Yuma
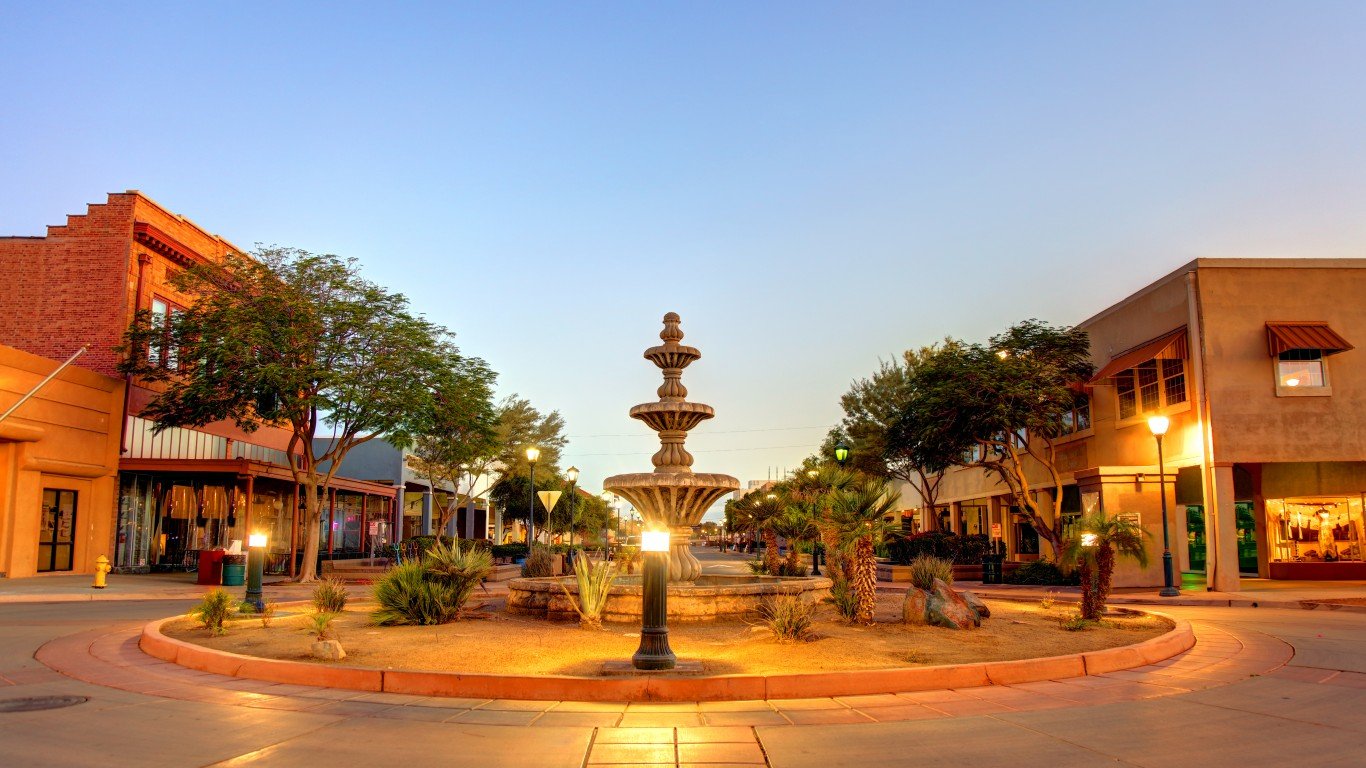
- Adults who report not exercising: 29.40% (state: 21.6%)
- Population with no access to places for exercise: 80.80% (state: 86.2%)
- Adult obesity rate: 40.50% (state: 31.5%)
- Adults who report fair/poor health: 21.10% (state: 14.5%)
- Average days people reported feeling unhealthy: 3.8 a month (state: 3.1 a month)
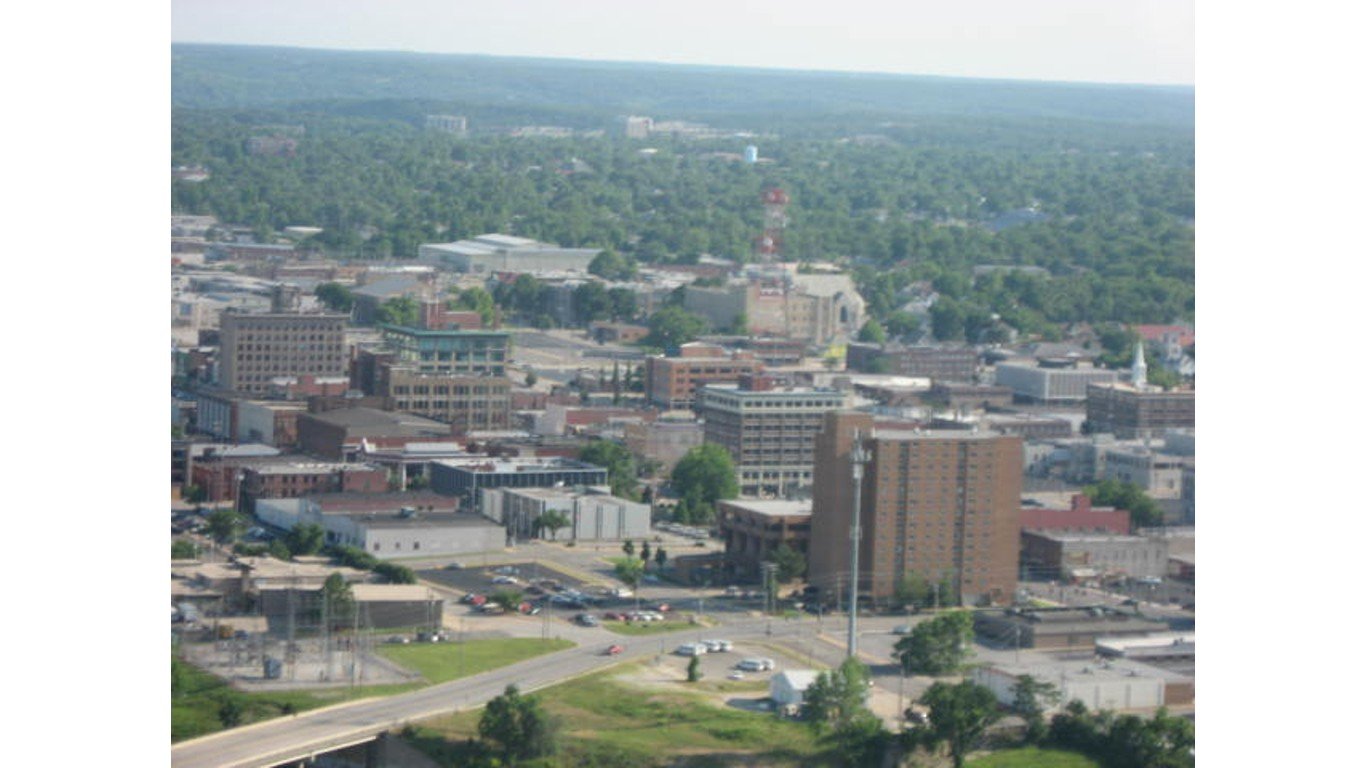
Arkansas: Pine Bluff
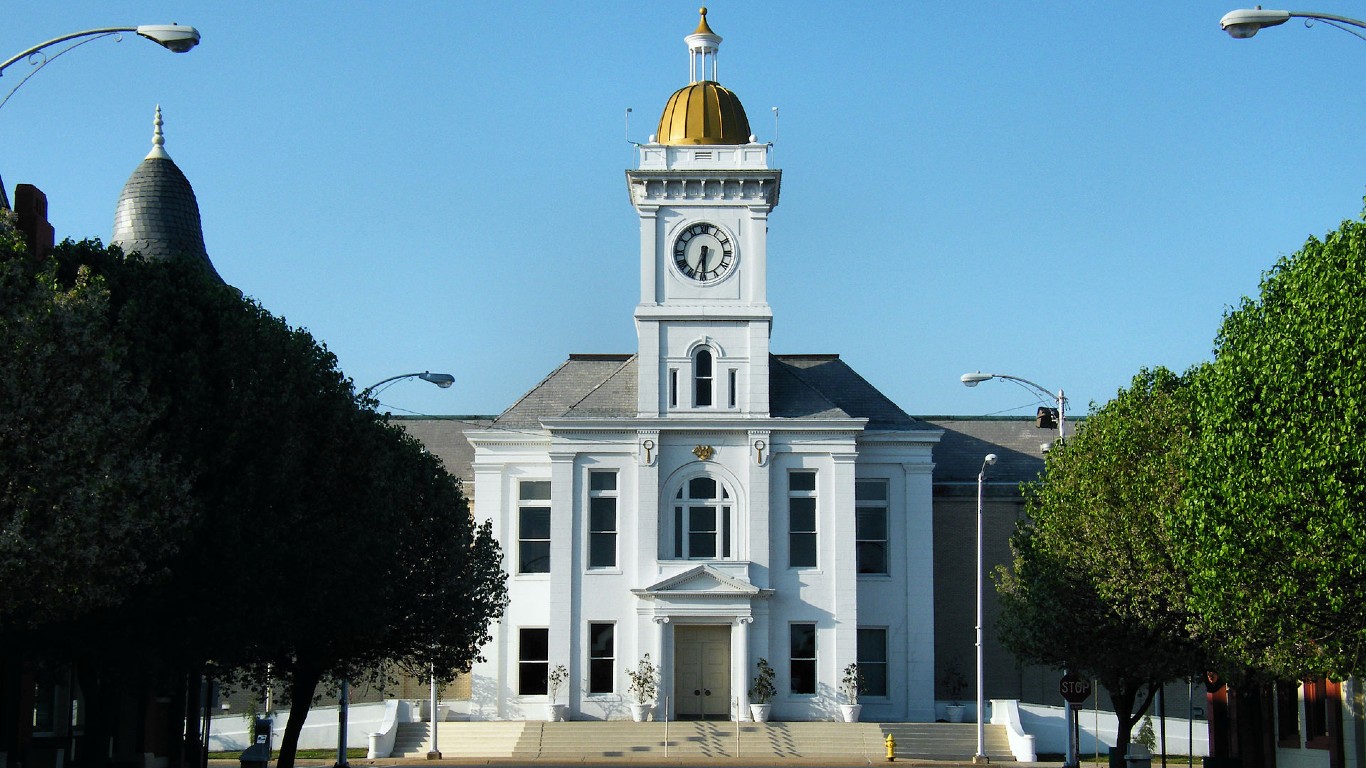
- Adults who report not exercising: 33.70% (state: 28.8%)
- Population with no access to places for exercise: 54.10% (state: 63.0%)
- Adult obesity rate: 42.90% (state: 37.2%)
- Adults who report fair/poor health: 22.80% (state: 19.4%)
- Average days people reported feeling unhealthy: 4.2 a month (state: 4.1 a month)
California: El Centro
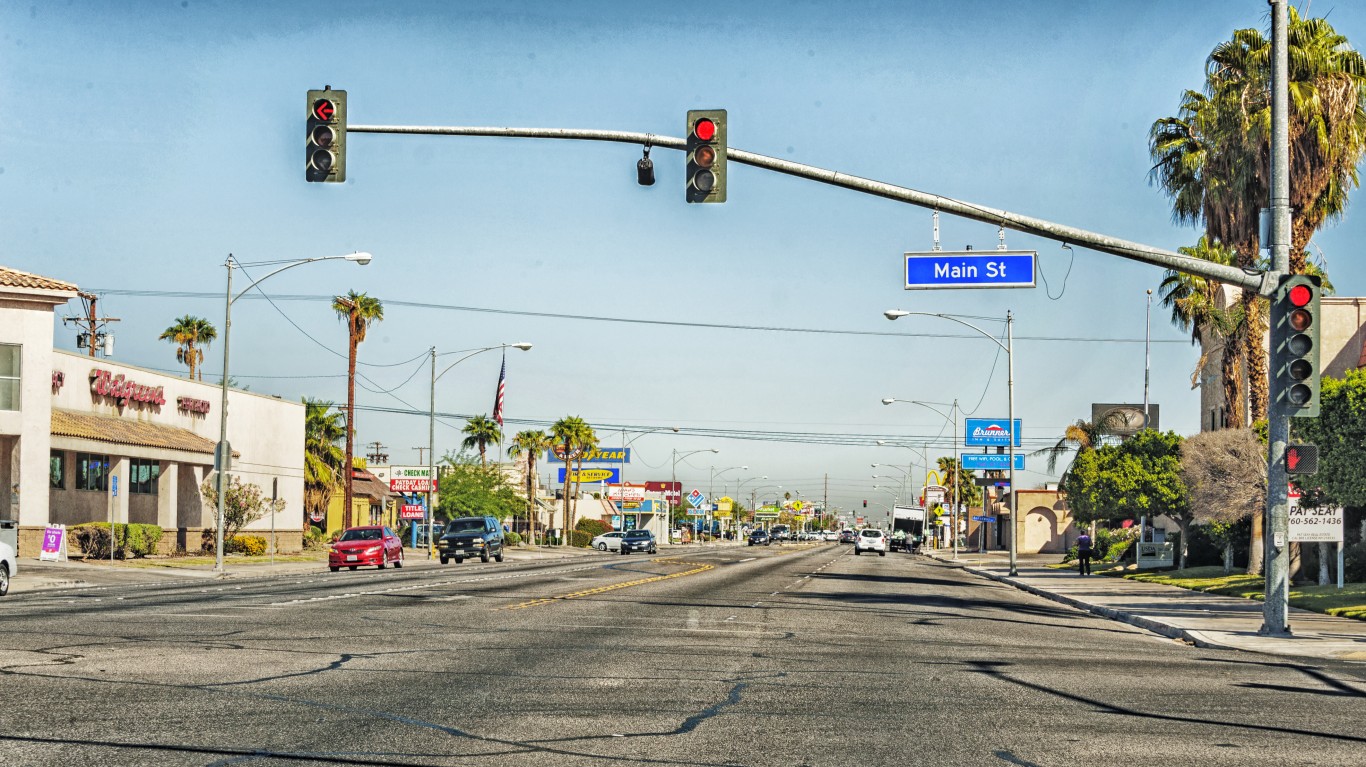
- Adults who report not exercising: 31.70% (state: 21.1%)
- Population with no access to places for exercise: 80.20% (state: 94.6%)
- Adult obesity rate: 36.20% (state: 30.2%)
- Adults who report fair/poor health: 24.00% (state: 14.4%)
- Average days people reported feeling unhealthy: 4.2 a month (state: 3.0 a month)
Colorado: Pueblo
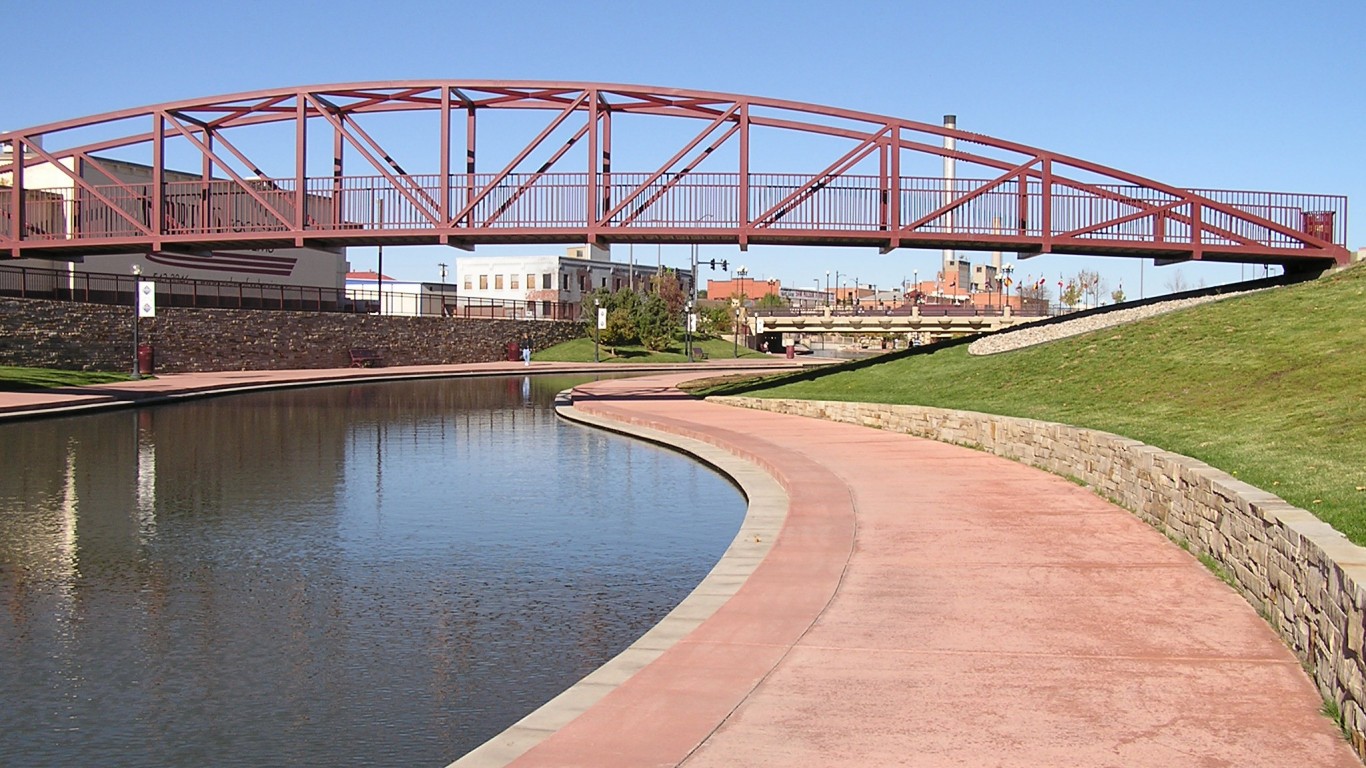
- Adults who report not exercising: 24.40% (state: 16.5%)
- Population with no access to places for exercise: 77.50% (state: 90.4%)
- Adult obesity rate: 29.60% (state: 24.2%)
- Adults who report fair/poor health: 15.50% (state: 10.2%)
- Average days people reported feeling unhealthy: 3.8 a month (state: 2.7 a month)
Connecticut: New Haven-Milford
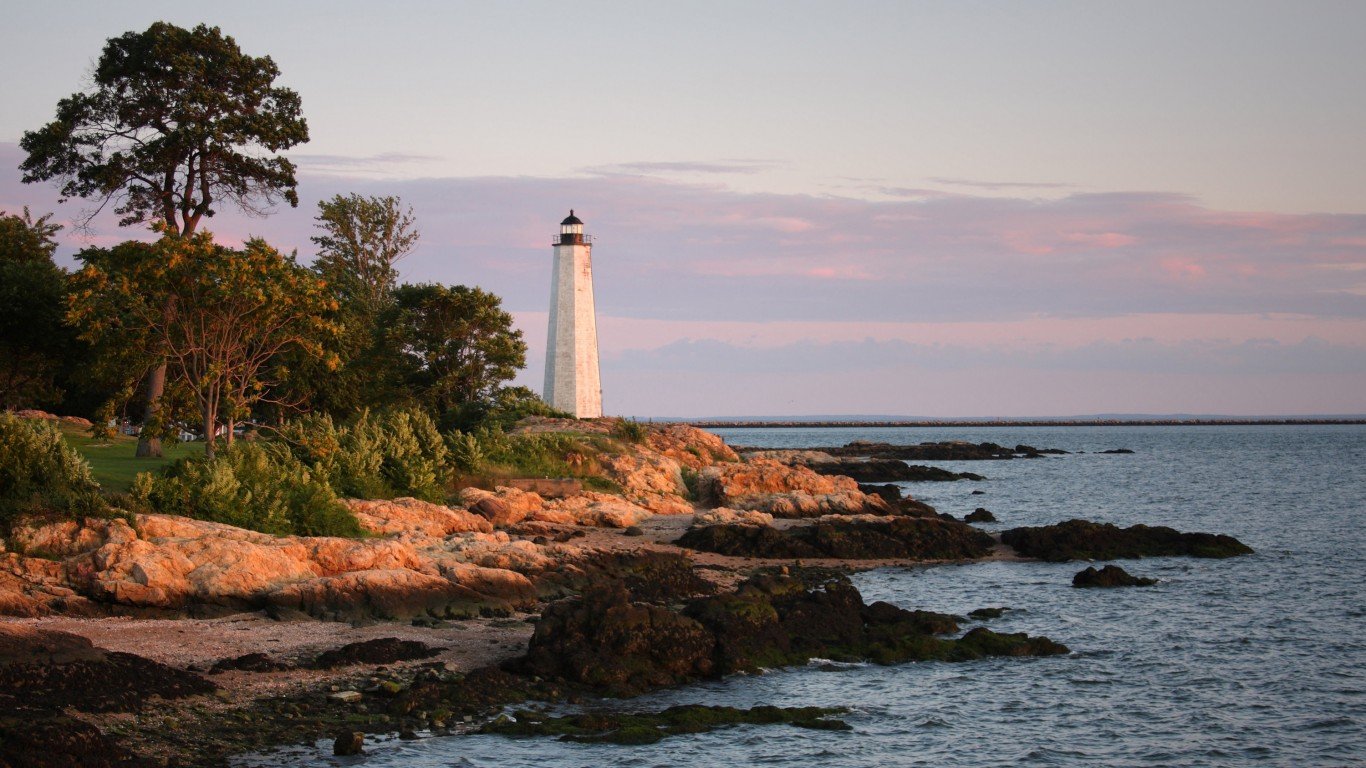
- Adults who report not exercising: 21.80% (state: 20.2%)
- Population with no access to places for exercise: 95.70% (state: 93.5%)
- Adult obesity rate: 33.30% (state: 29.5%)
- Adults who report fair/poor health: 11.60% (state: 11.0%)
- Average days people reported feeling unhealthy: 2.9 a month (state: 2.6 a month)
Delaware: Dover

- Adults who report not exercising: 27.60% (state: 23.6%)
- Population with no access to places for exercise: 64.10% (state: 81.3%)
- Adult obesity rate: 39.10% (state: 36.2%)
- Adults who report fair/poor health: 14.60% (state: 12.8%)
- Average days people reported feeling unhealthy: 3.3 a month (state: 3.1 a month)
Florida: Sebring-Avon Park
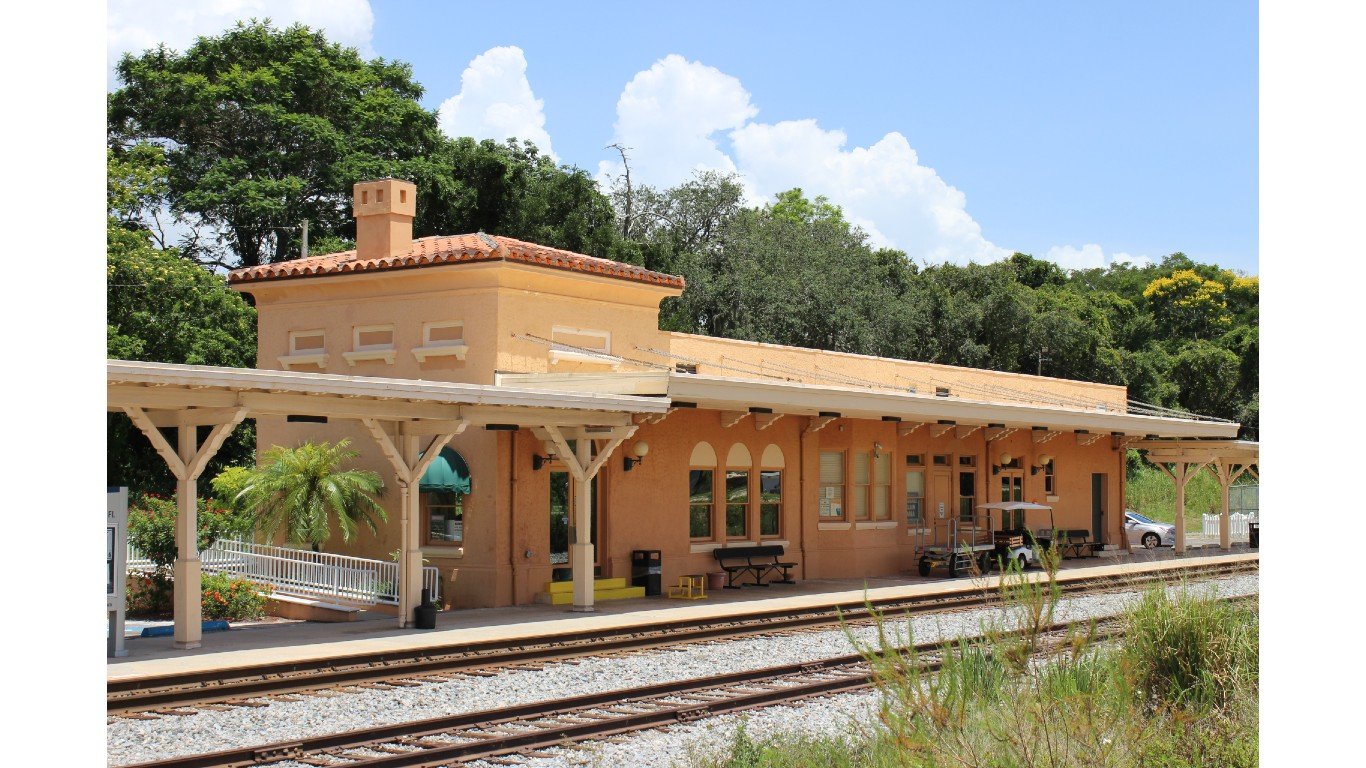
- Adults who report not exercising: 29.60% (state: 25.8%)
- Population with no access to places for exercise: 76.60% (state: 88.2%)
- Adult obesity rate: 39.10% (state: 28.3%)
- Adults who report fair/poor health: 19.20% (state: 13.3%)
- Average days people reported feeling unhealthy: 4.1 a month (state: 3.0 a month)
Georgia: Dalton
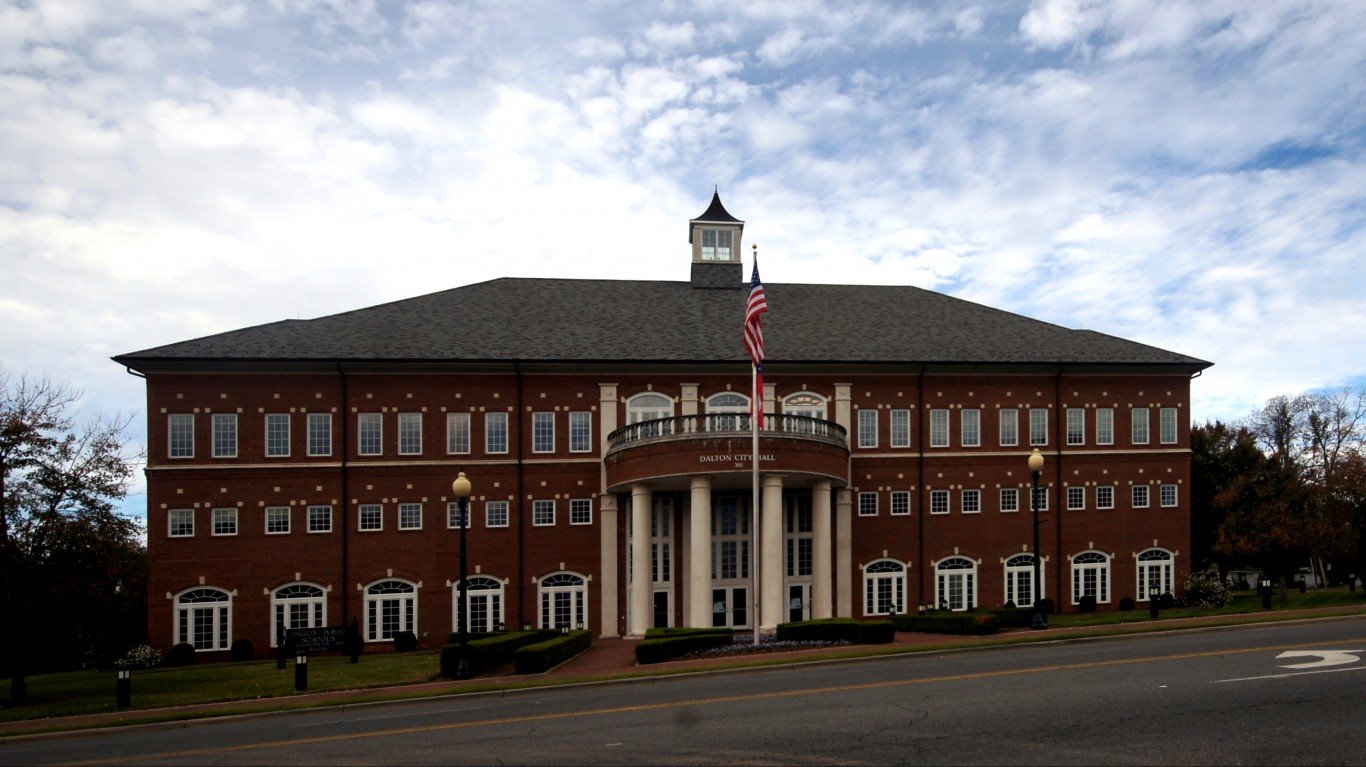
- Adults who report not exercising: 32.00% (state: 24.5%)
- Population with no access to places for exercise: 72.30% (state: 74.6%)
- Adult obesity rate: 39.00% (state: 34.3%)
- Adults who report fair/poor health: 19.90% (state: 15.1%)
- Average days people reported feeling unhealthy: 4.1 a month (state: 3.2 a month)
Hawaii: Urban Honolulu

- Adults who report not exercising: 19.80% (state: 18.4%)
- Population with no access to places for exercise: 97.30% (state: 93.7%)
- Adult obesity rate: 24.30% (state: 25.0%)
- Adults who report fair/poor health: 11.40% (state: 10.3%)
- Average days people reported feeling unhealthy: 2.4 a month (state: 2.3 a month)
Idaho: Twin Falls
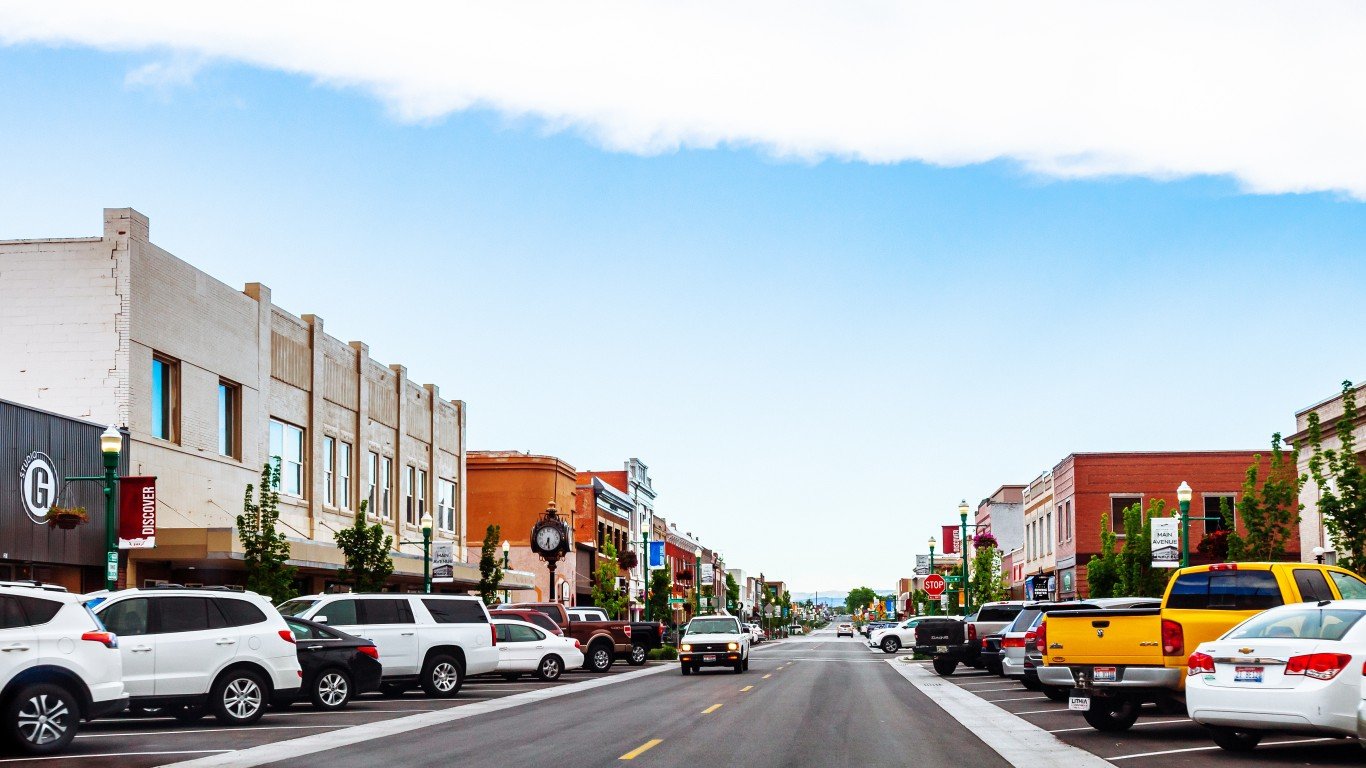
- Adults who report not exercising: 23.20% (state: 19.7%)
- Population with no access to places for exercise: 65.20% (state: 74.7%)
- Adult obesity rate: 34.00% (state: 31.3%)
- Adults who report fair/poor health: 14.70% (state: 11.8%)
- Average days people reported feeling unhealthy: 3.5 a month (state: 3.0 a month)
Illinois: Danville
- Adults who report not exercising: 28.10% (state: 24.4%)
- Population with no access to places for exercise: 69.40% (state: 90.4%)
- Adult obesity rate: 38.20% (state: 32.5%)
- Adults who report fair/poor health: 16.70% (state: 12.3%)
- Average days people reported feeling unhealthy: 3.4 a month (state: 2.7 a month)
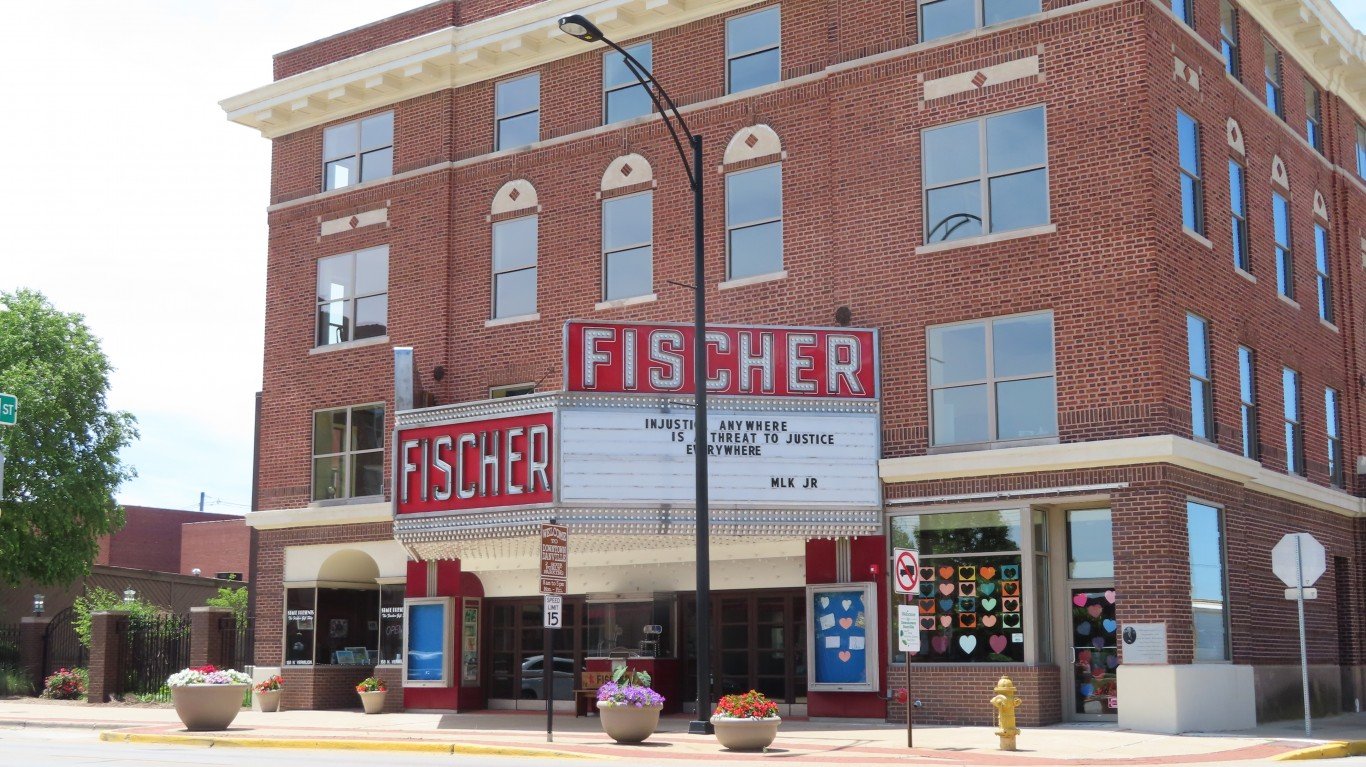
Indiana: Muncie
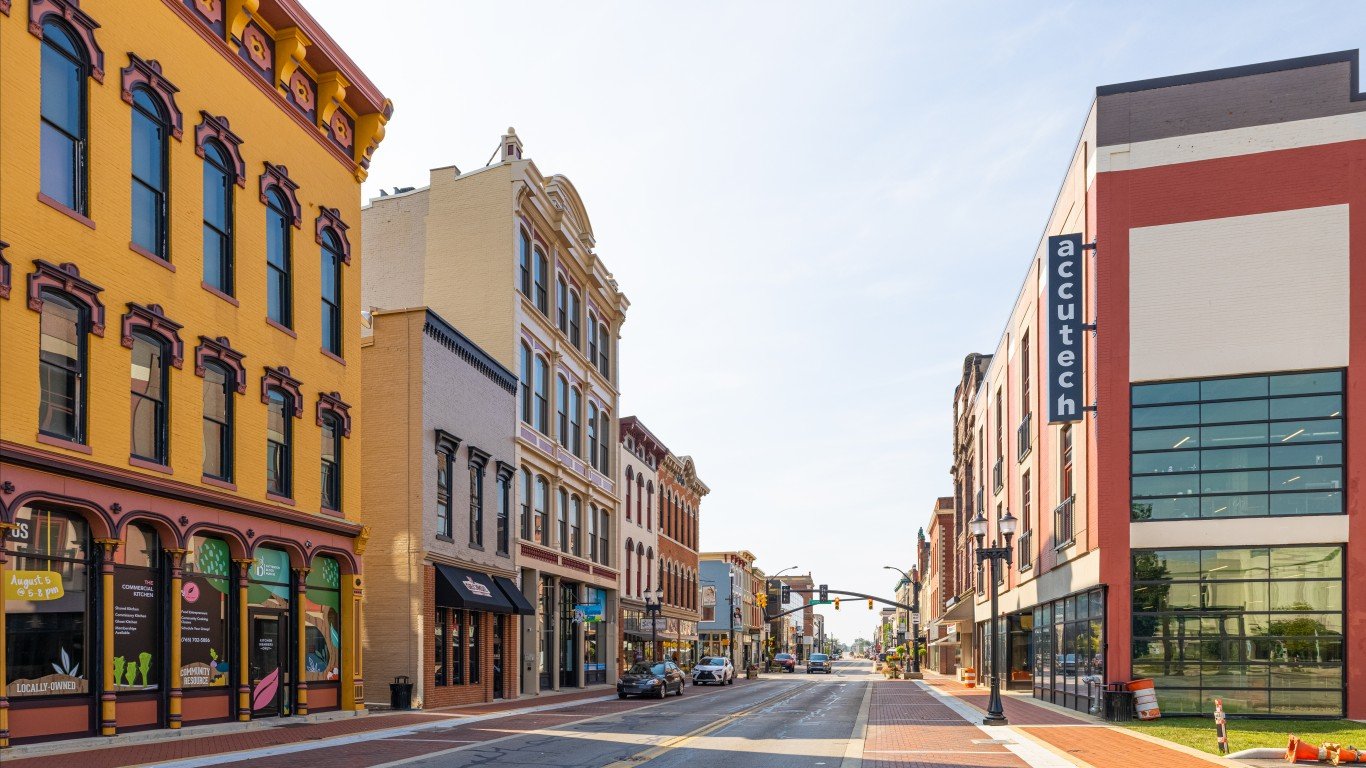
- Adults who report not exercising: 29.20% (state: 25.6%)
- Population with no access to places for exercise: 76.40% (state: 76.8%)
- Adult obesity rate: 40.10% (state: 37.2%)
- Adults who report fair/poor health: 17.30% (state: 15.1%)
- Average days people reported feeling unhealthy: 3.7 a month (state: 3.3 a month)
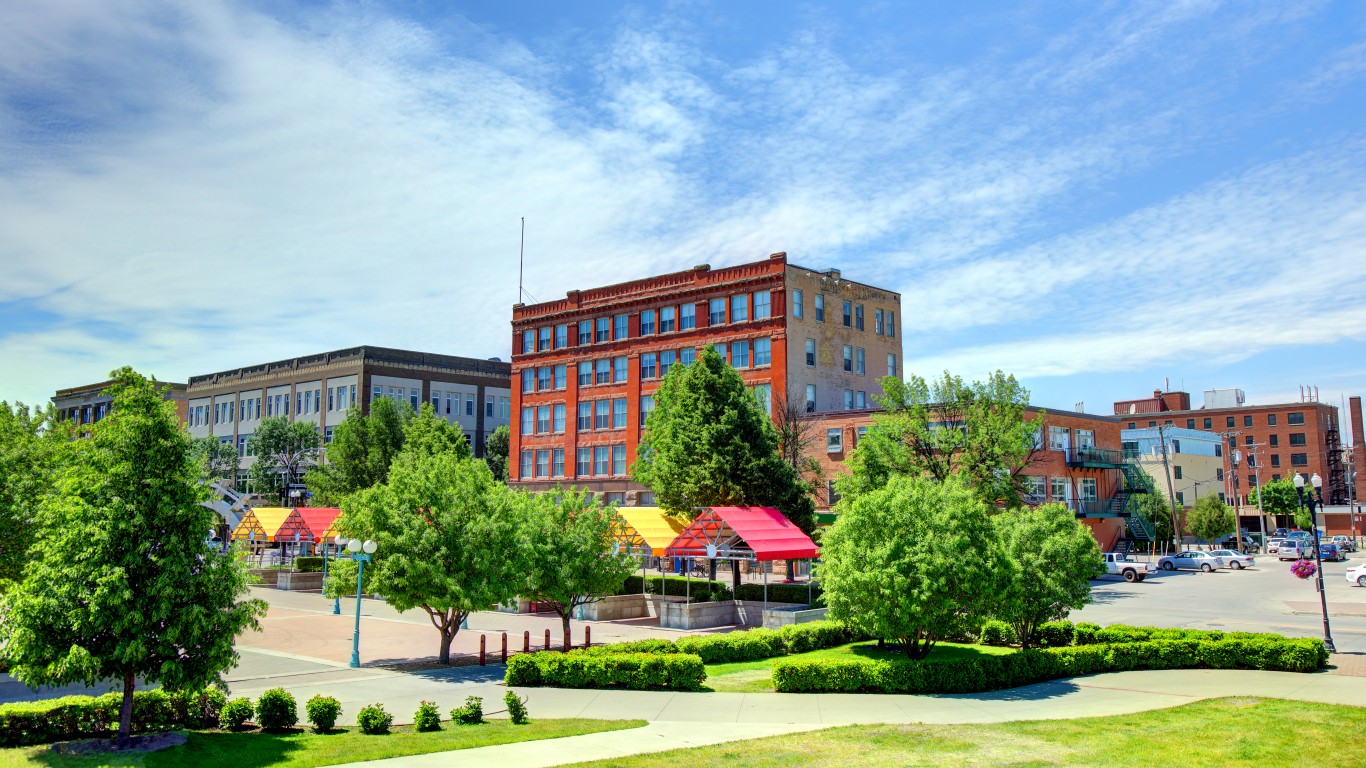
Iowa: Sioux City
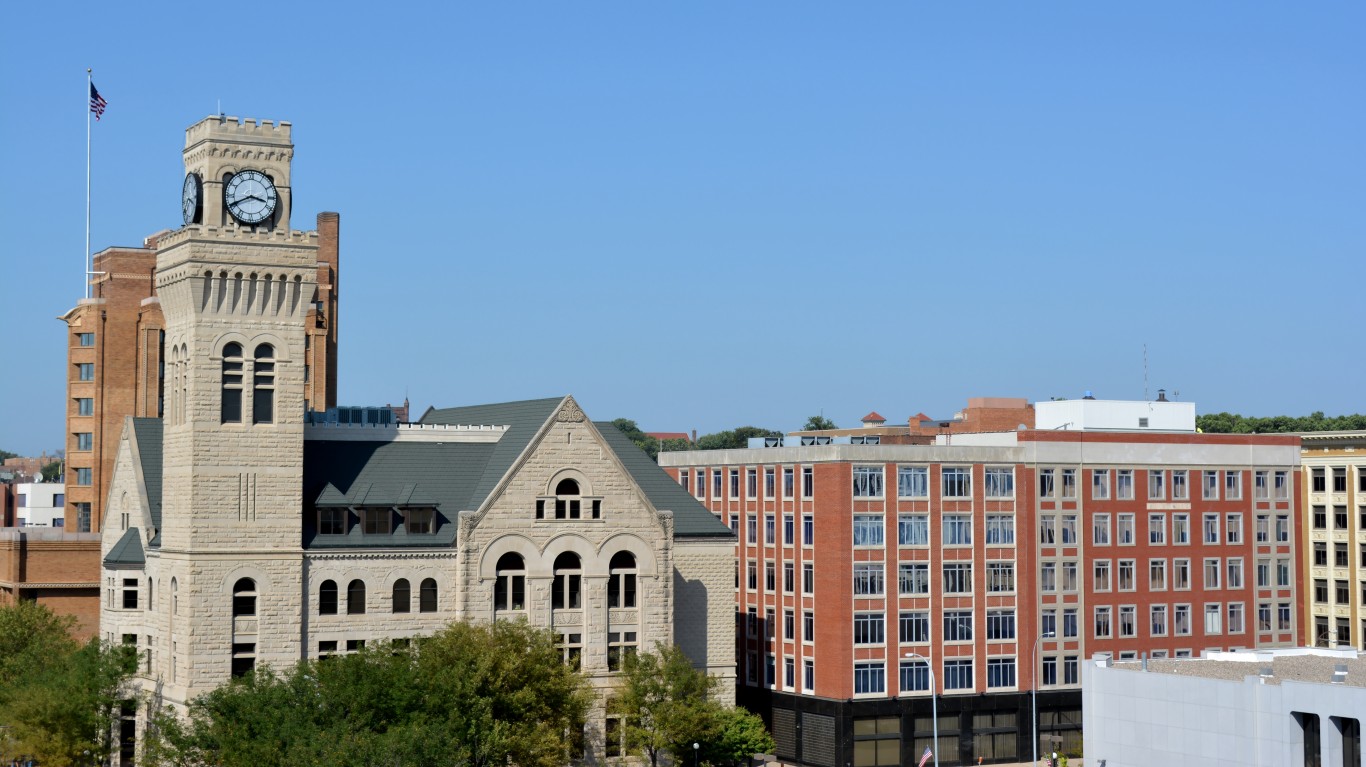
- Adults who report not exercising: 26.70% (state: 22.7%)
- Population with no access to places for exercise: 85.00% (state: 79.3%)
- Adult obesity rate: 38.30% (state: 37.2%)
- Adults who report fair/poor health: 13.20% (state: 12.0%)
- Average days people reported feeling unhealthy: 3 a month (state: 2.8 a month)
Kansas: Topeka
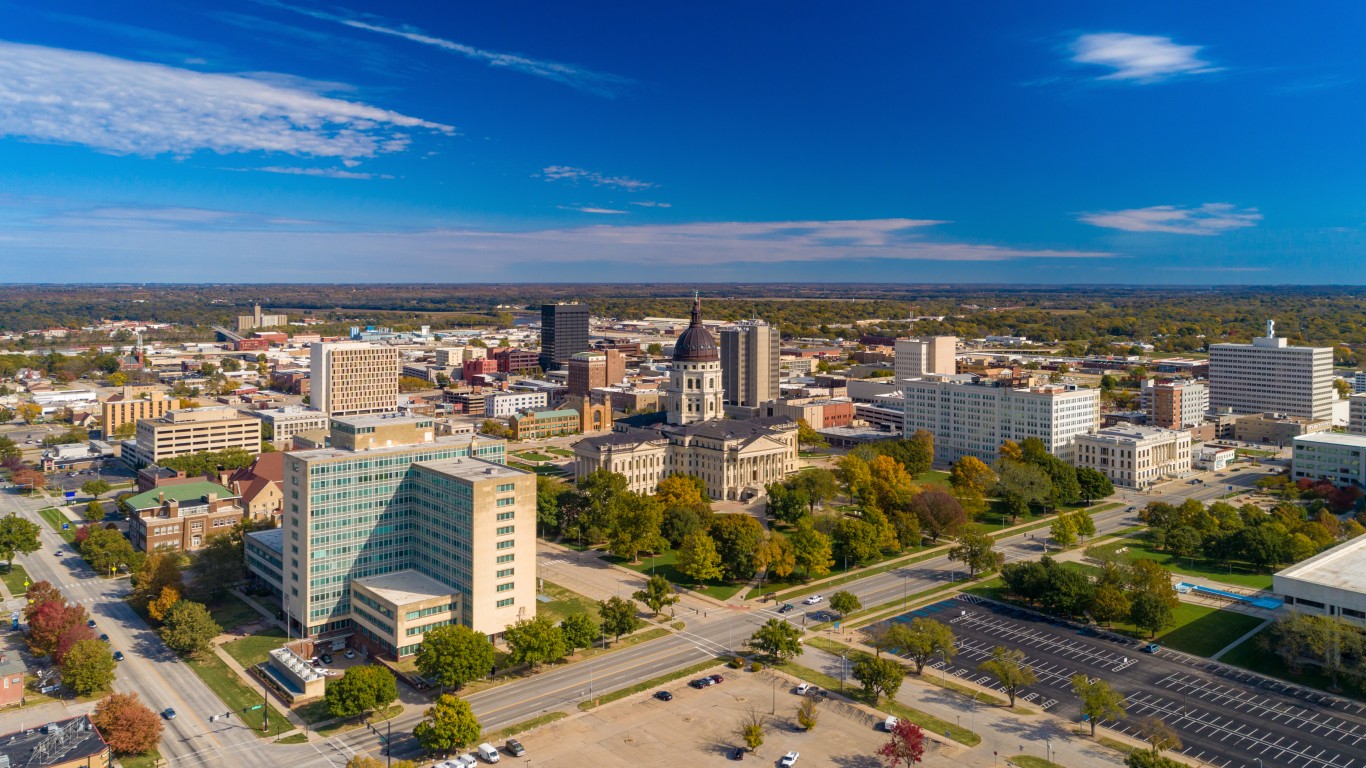
- Adults who report not exercising: 22.30% (state: 21.4%)
- Population with no access to places for exercise: 77.50% (state: 79.7%)
- Adult obesity rate: 37.50% (state: 35.8%)
- Adults who report fair/poor health: 13.10% (state: 12.8%)
- Average days people reported feeling unhealthy: 3 a month (state: 2.8 a month)
Kentucky: Bowling Green
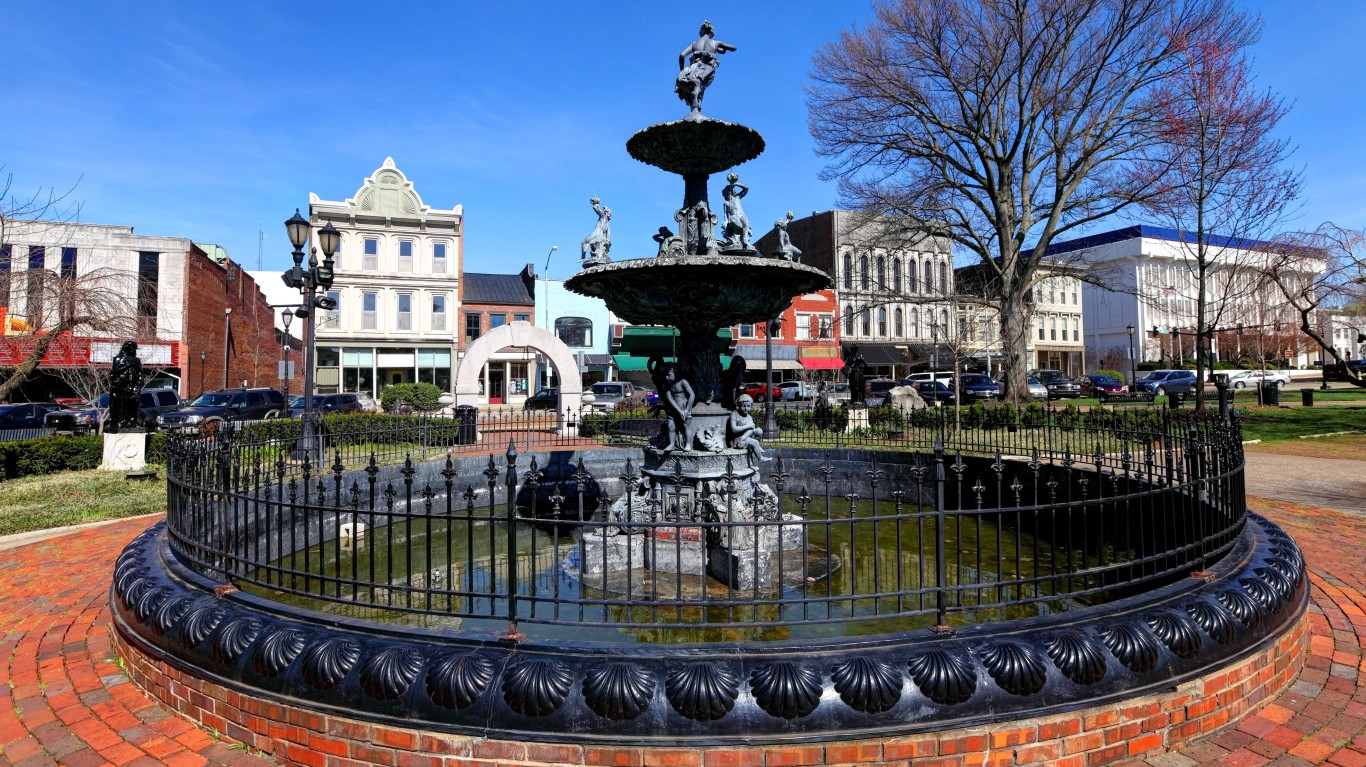
- Adults who report not exercising: 30.60% (state: 29.3%)
- Population with no access to places for exercise: 55.10% (state: 69.9%)
- Adult obesity rate: 37.60% (state: 37.0%)
- Adults who report fair/poor health: 18.90% (state: 19.5%)
- Average days people reported feeling unhealthy: 4.3 a month (state: 4.3 a month)
Louisiana: Hammond
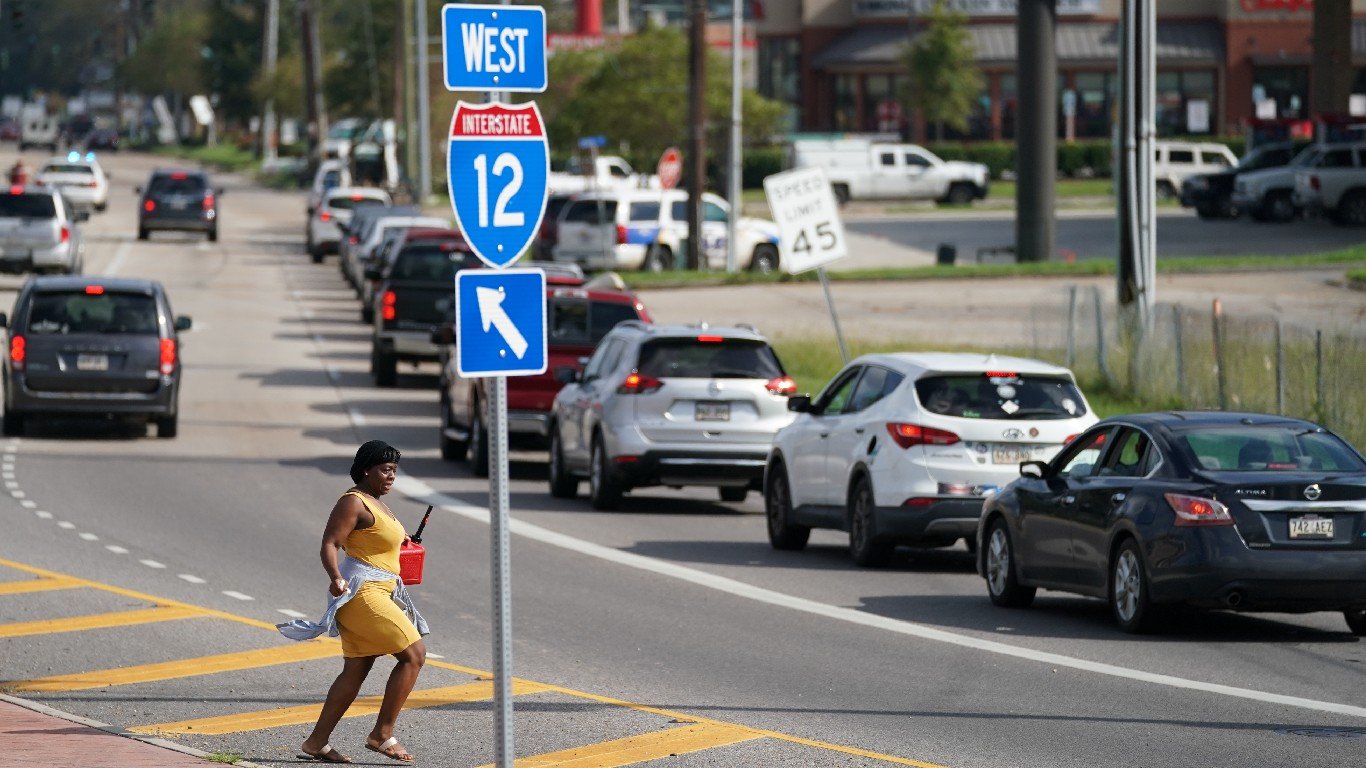
- Adults who report not exercising: 33.40% (state: 28.2%)
- Population with no access to places for exercise: 65.50% (state: 75.8%)
- Adult obesity rate: 40.80% (state: 38.3%)
- Adults who report fair/poor health: 19.50% (state: 19.0%)
- Average days people reported feeling unhealthy: 4 a month (state: 4.0 a month)
Maine: Lewiston-Auburn
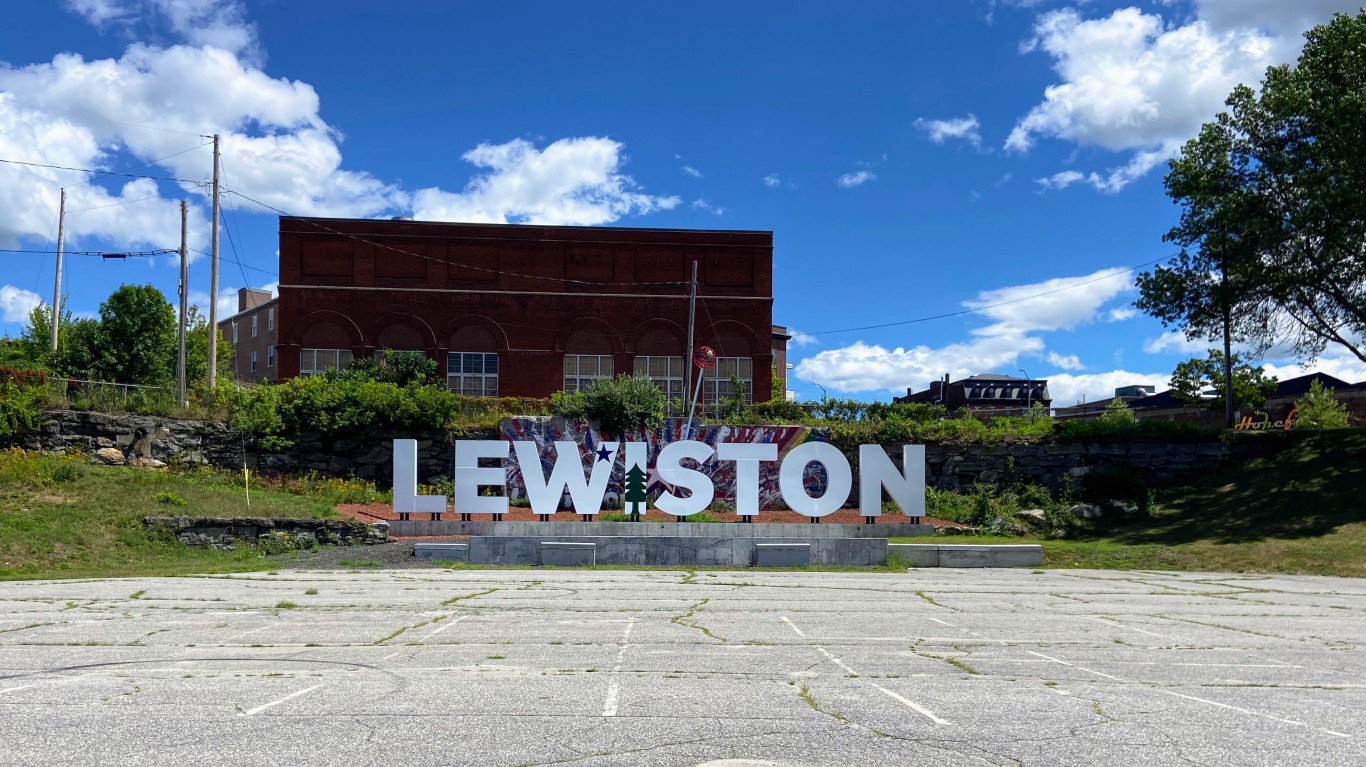
- Adults who report not exercising: 24.30% (state: 19.7%)
- Population with no access to places for exercise: 83.10% (state: 65.7%)
- Adult obesity rate: 35.00% (state: 31.3%)
- Adults who report fair/poor health: 13.20% (state: 11.1%)
- Average days people reported feeling unhealthy: 3.2 a month (state: 2.7 a month)
Maryland: Hagerstown-Martinsburg
- Adults who report not exercising: 27.00% (state: 20.6%)
- Population with no access to places for exercise: 68.60% (state: 92.1%)
- Adult obesity rate: 37.70% (state: 30.9%)
- Adults who report fair/poor health: 15.10% (state: 10.6%)
- Average days people reported feeling unhealthy: 3.6 a month (state: 2.5 a month)
Massachusetts: Worcester

- Adults who report not exercising: 21.80% (state: 19.4%)
- Population with no access to places for exercise: 89.70% (state: 94.7%)
- Adult obesity rate: 30.30% (state: 24.5%)
- Adults who report fair/poor health: 11.00% (state: 10.8%)
- Average days people reported feeling unhealthy: 2.8 a month (state: 2.4 a month)
Michigan: Flint
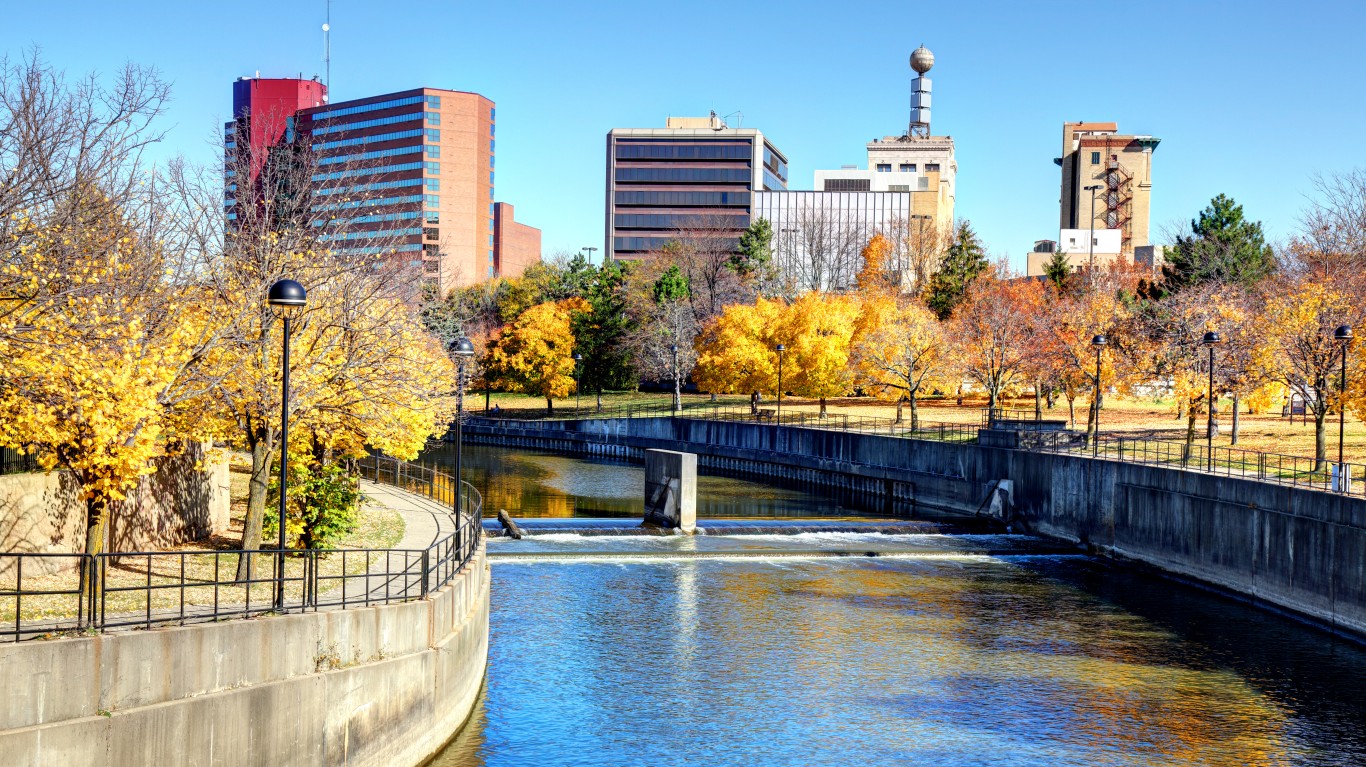
- Adults who report not exercising: 24.70% (state: 20.2%)
- Population with no access to places for exercise: 85.90% (state: 85.2%)
- Adult obesity rate: 42.10% (state: 35.3%)
- Adults who report fair/poor health: 16.80% (state: 14.7%)
- Average days people reported feeling unhealthy: 3.8 a month (state: 3.3 a month)
Minnesota: St. Cloud
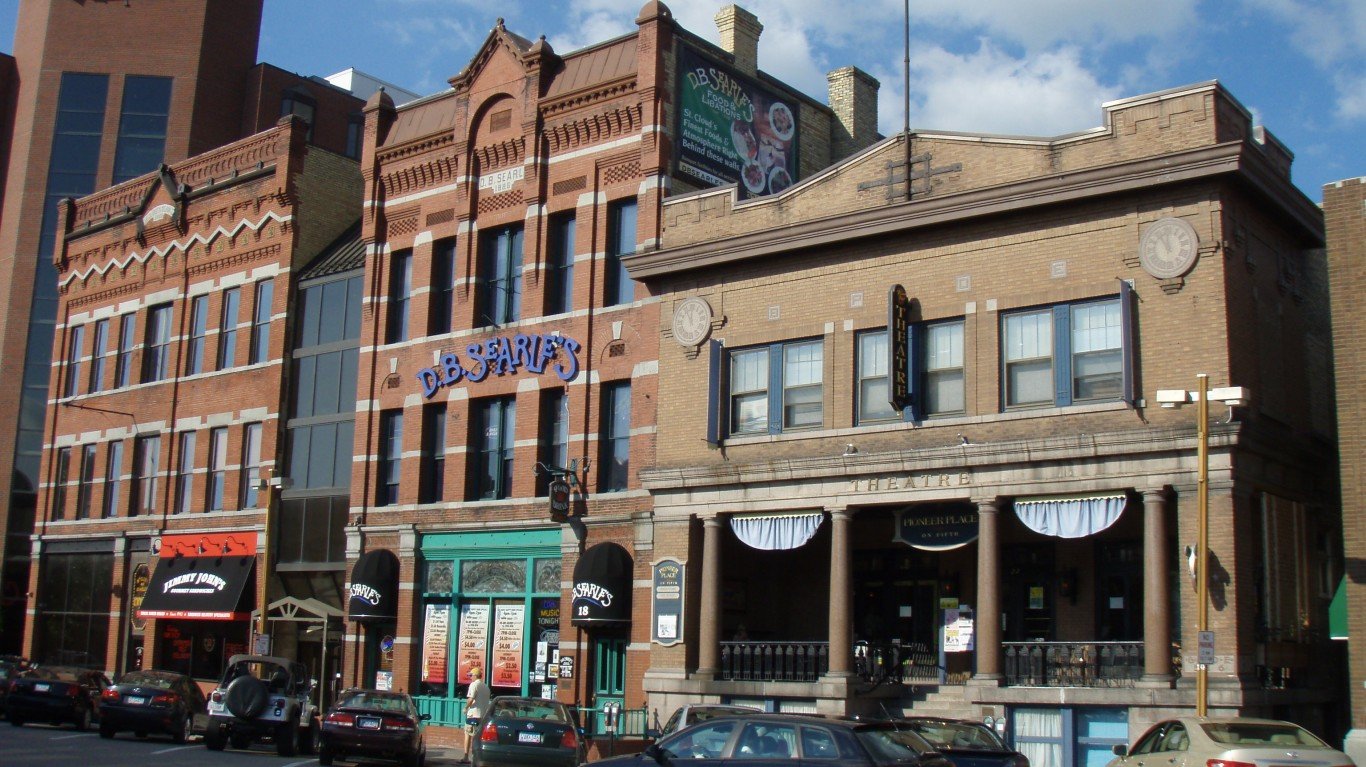
- Adults who report not exercising: 21.50% (state: 18.7%)
- Population with no access to places for exercise: 77.00% (state: 86.0%)
- Adult obesity rate: 34.80% (state: 30.6%)
- Adults who report fair/poor health: 11.60% (state: 10.0%)
- Average days people reported feeling unhealthy: 2.9 a month (state: 2.6 a month)
Mississippi: Hattiesburg

- Adults who report not exercising: 28.40% (state: 28.9%)
- Population with no access to places for exercise: 62.60% (state: 57.5%)
- Adult obesity rate: 39.10% (state: 39.9%)
- Adults who report fair/poor health: 18.60% (state: 18.7%)
- Average days people reported feeling unhealthy: 3.2 a month (state: 2.9 a month)
Missouri: Joplin
- Adults who report not exercising: 27.10% (state: 24.9%)
- Population with no access to places for exercise: 68.60% (state: 75.8%)
- Adult obesity rate: 36.50% (state: 34.2%)
- Adults who report fair/poor health: 17.00% (state: 15.2%)
- Average days people reported feeling unhealthy: 3.8 a month (state: 3.4 a month)
Montana: Great Falls
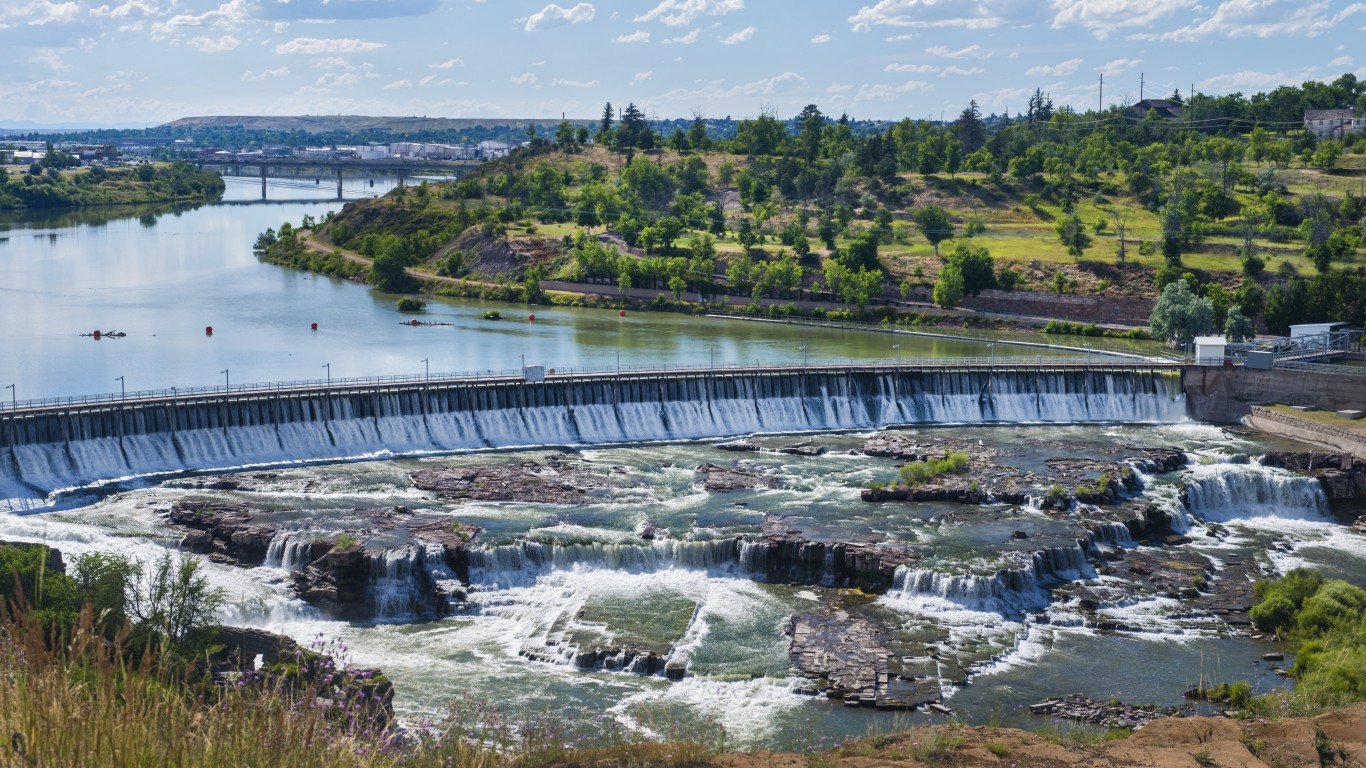
- Adults who report not exercising: 21.30% (state: 18.0%)
- Population with no access to places for exercise: 76.60% (state: 72.8%)
- Adult obesity rate: 35.00% (state: 28.9%)
- Adults who report fair/poor health: 12.90% (state: 12.1%)
- Average days people reported feeling unhealthy: 3.4 a month (state: 3.3 a month)
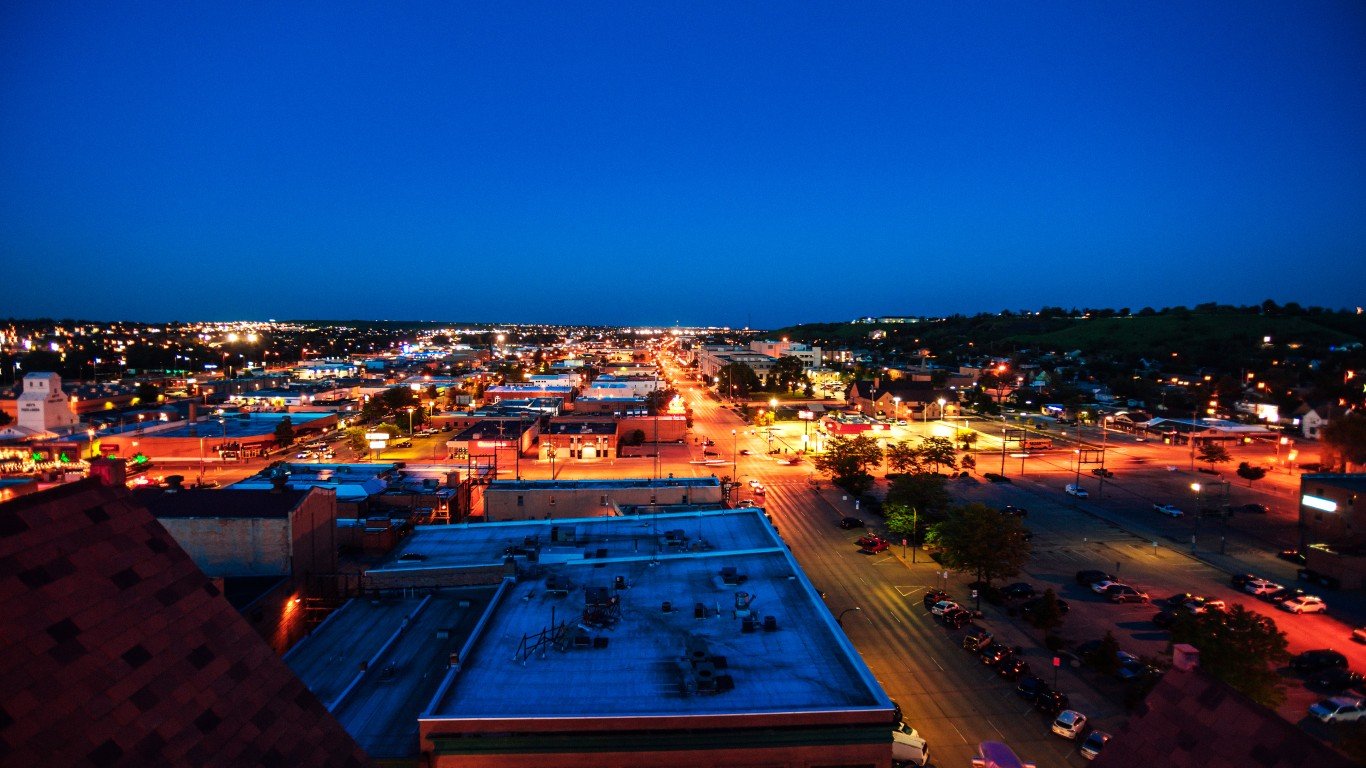
Nebraska: Grand Island
- Adults who report not exercising: 25.70% (state: 21.0%)
- Population with no access to places for exercise: 81.50% (state: 83.1%)
- Adult obesity rate: 39.00% (state: 34.0%)
- Adults who report fair/poor health: 12.80% (state: 10.2%)
- Average days people reported feeling unhealthy: 2.7 a month (state: 2.5 a month)
Nevada: Las Vegas-Henderson-Paradise

- Adults who report not exercising: 26.20% (state: 24.9%)
- Population with no access to places for exercise: 96.10% (state: 91.5%)
- Adult obesity rate: 31.10% (state: 28.1%)
- Adults who report fair/poor health: 17.50% (state: 16.7%)
- Average days people reported feeling unhealthy: 3.8 a month (state: 3.9 a month)
New Hampshire: Manchester-Nashua

- Adults who report not exercising: 19.90% (state: 18.6%)
- Population with no access to places for exercise: 86.60% (state: 84.2%)
- Adult obesity rate: 29.20% (state: 30.5%)
- Adults who report fair/poor health: 10.90% (state: 10.8%)
- Average days people reported feeling unhealthy: 2.7 a month (state: 3.1 a month)
New Jersey: Vineland-Bridgeton

- Adults who report not exercising: 30.80% (state: 20.2%)
- Population with no access to places for exercise: 86.70% (state: 96.1%)
- Adult obesity rate: 35.70% (state: 27.7%)
- Adults who report fair/poor health: 17.80% (state: 10.8%)
- Average days people reported feeling unhealthy: 3.4 a month (state: 2.4 a month)
New Mexico: Las Cruces
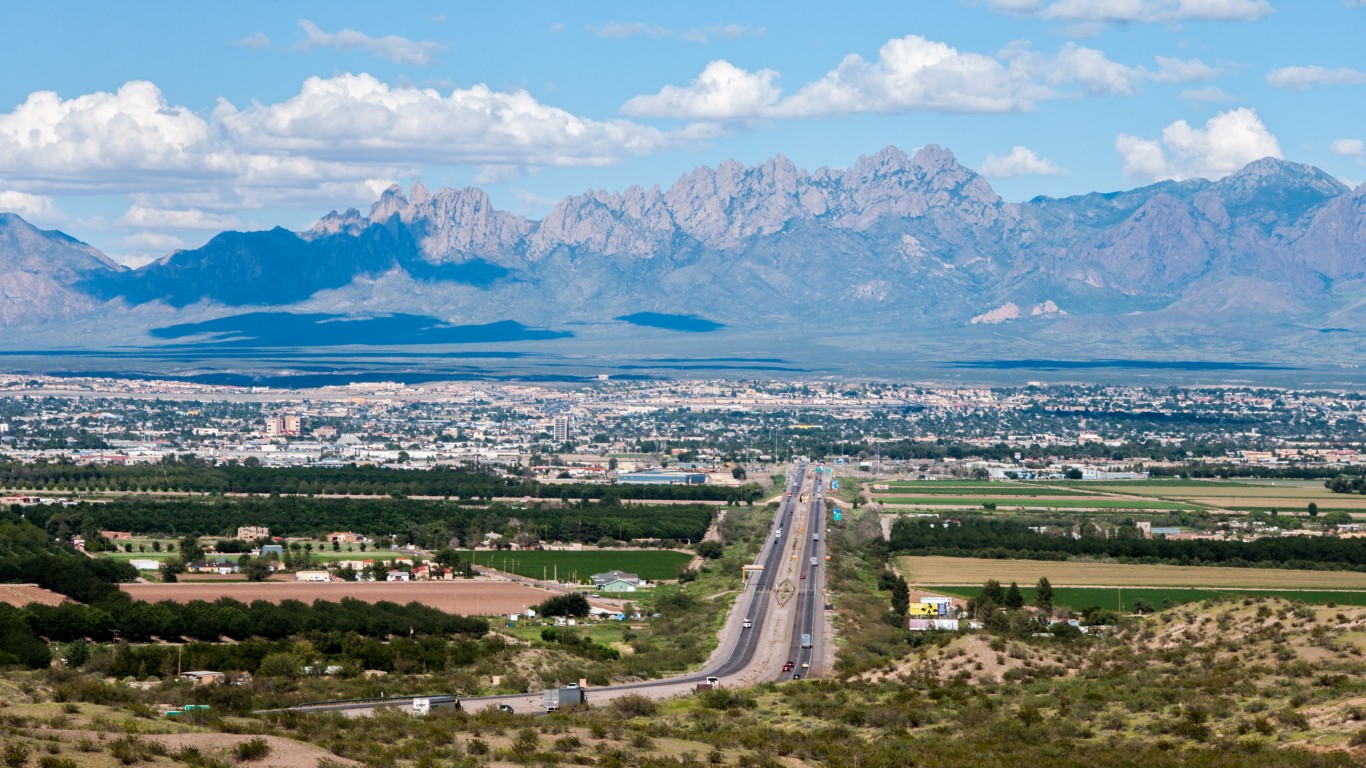
- Adults who report not exercising: 25.00% (state: 22.5%)
- Population with no access to places for exercise: 65.10% (state: 74.3%)
- Adult obesity rate: 30.90% (state: 31.7%)
- Adults who report fair/poor health: 16.80% (state: 13.8%)
- Average days people reported feeling unhealthy: 3.5 a month (state: 3.1 a month)
New York: Elmira
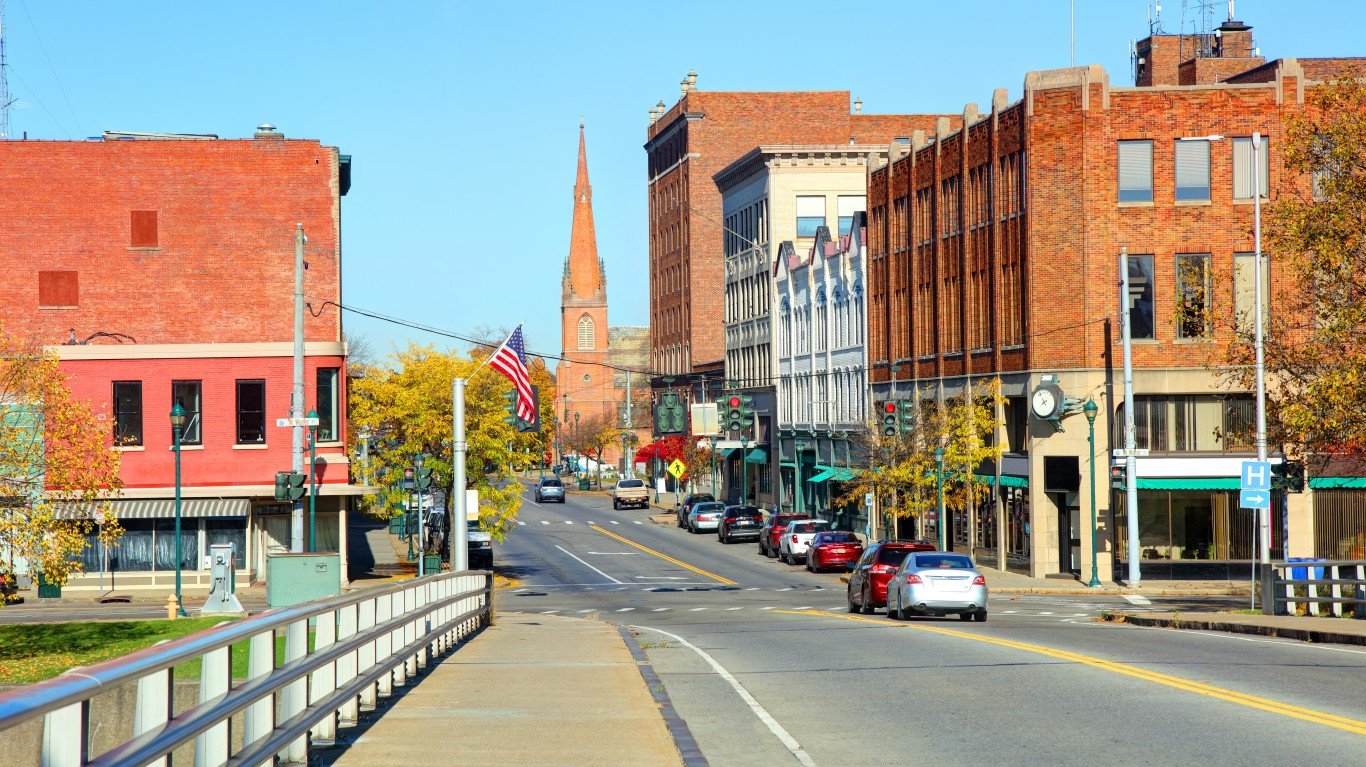
- Adults who report not exercising: 25.20% (state: 25.2%)
- Population with no access to places for exercise: 81.80% (state: 93.2%)
- Adult obesity rate: 33.00% (state: 26.5%)
- Adults who report fair/poor health: 12.50% (state: 11.8%)
- Average days people reported feeling unhealthy: 3.2 a month (state: 2.7 a month)
North Carolina: Rocky Mount
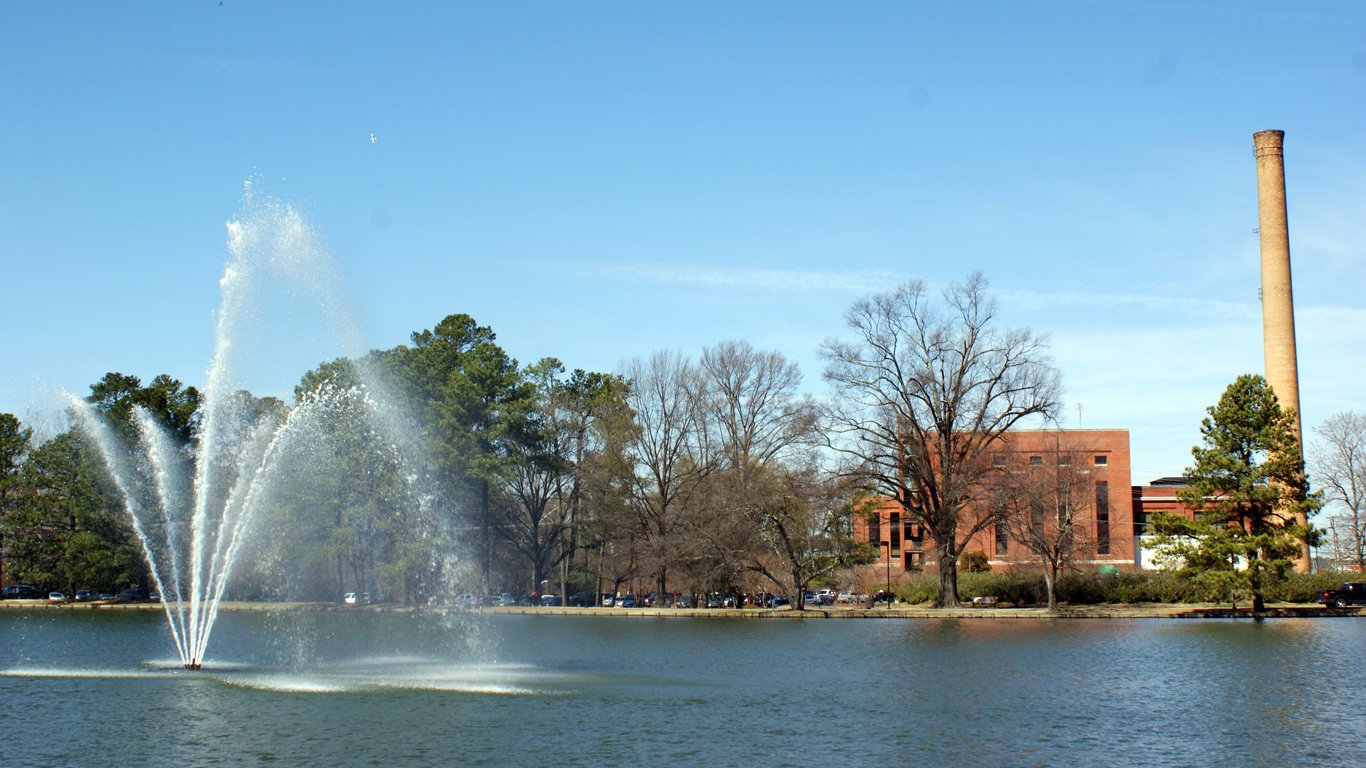
- Adults who report not exercising: 26.70% (state: 21.9%)
- Population with no access to places for exercise: 59.60% (state: 74.5%)
- Adult obesity rate: 39.00% (state: 33.6%)
- Adults who report fair/poor health: 17.50% (state: 13.5%)
- Average days people reported feeling unhealthy: 3.4 a month (state: 3.0 a month)
North Dakota: Grand Forks
- Adults who report not exercising: 23.40% (state: 24.6%)
- Population with no access to places for exercise: 83.00% (state: 72.5%)
- Adult obesity rate: 35.90% (state: 33.6%)
- Adults who report fair/poor health: 11.60% (state: 11.6%)
- Average days people reported feeling unhealthy: 2.8 a month (state: 2.6 a month)
Ohio: Springfield
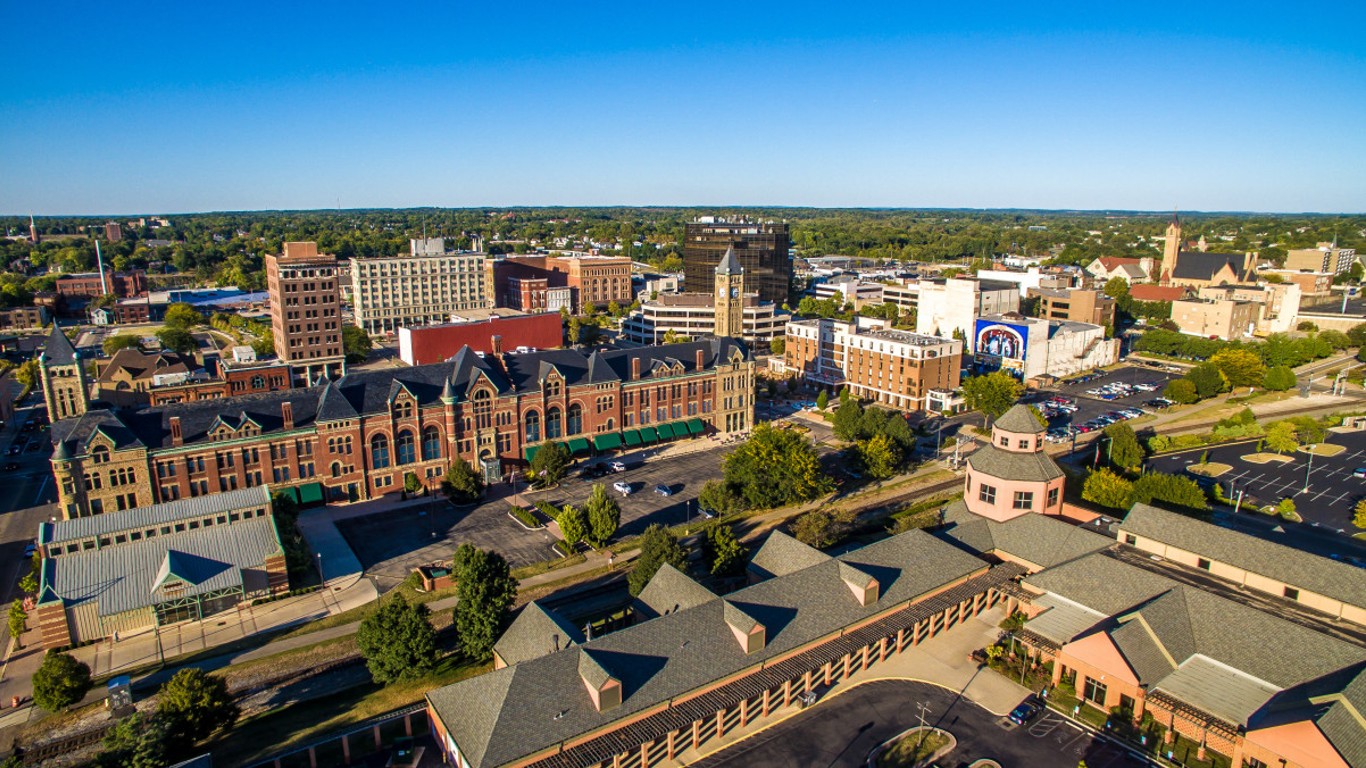
- Adults who report not exercising: 29.00% (state: 23.5%)
- Population with no access to places for exercise: 85.80% (state: 83.8%)
- Adult obesity rate: 36.70% (state: 35.8%)
- Adults who report fair/poor health: 16.30% (state: 14.5%)
- Average days people reported feeling unhealthy: 3.5 a month (state: 3.2 a month)
Oklahoma: Lawton
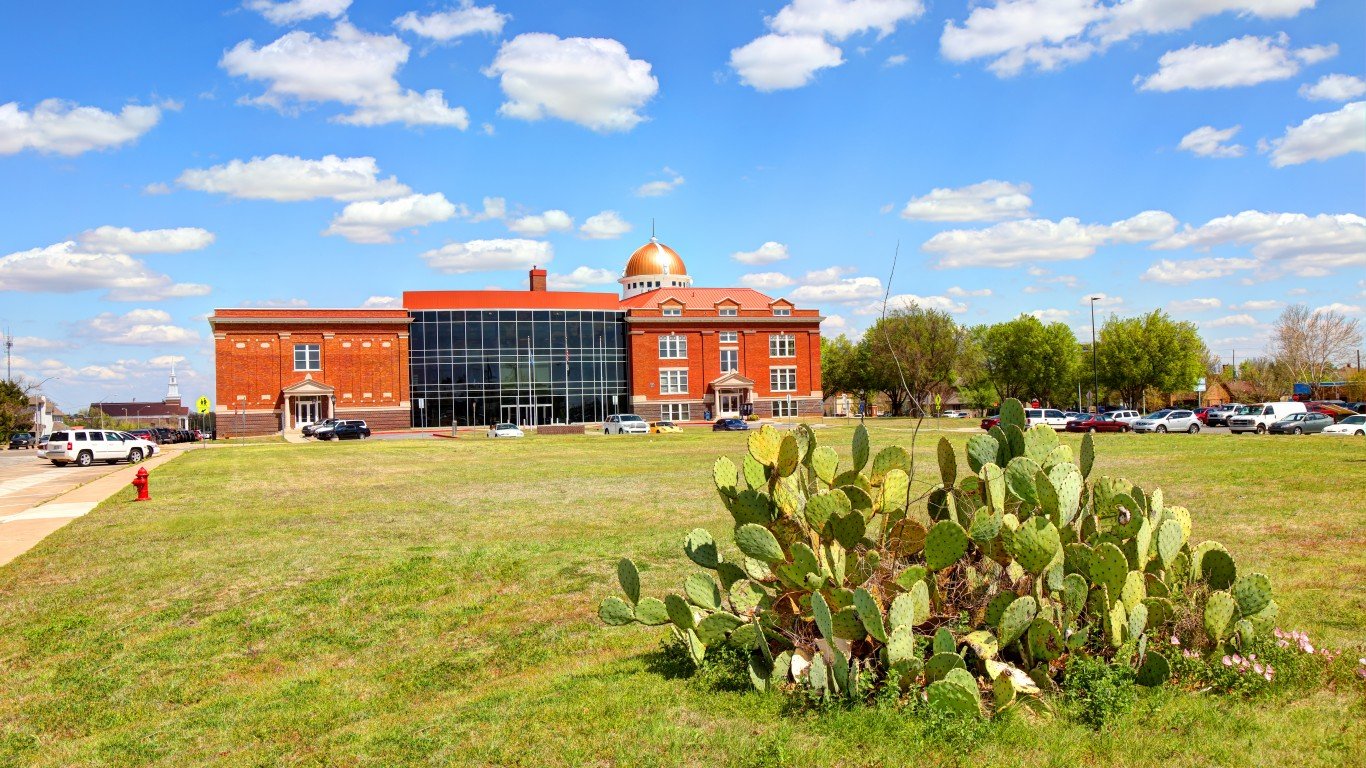
- Adults who report not exercising: 31.20% (state: 27.9%)
- Population with no access to places for exercise: 69.30% (state: 71.3%)
- Adult obesity rate: 39.40% (state: 37.1%)
- Adults who report fair/poor health: 18.00% (state: 17.3%)
- Average days people reported feeling unhealthy: 3.9 a month (state: 3.7 a month)
Oregon: Grants Pass
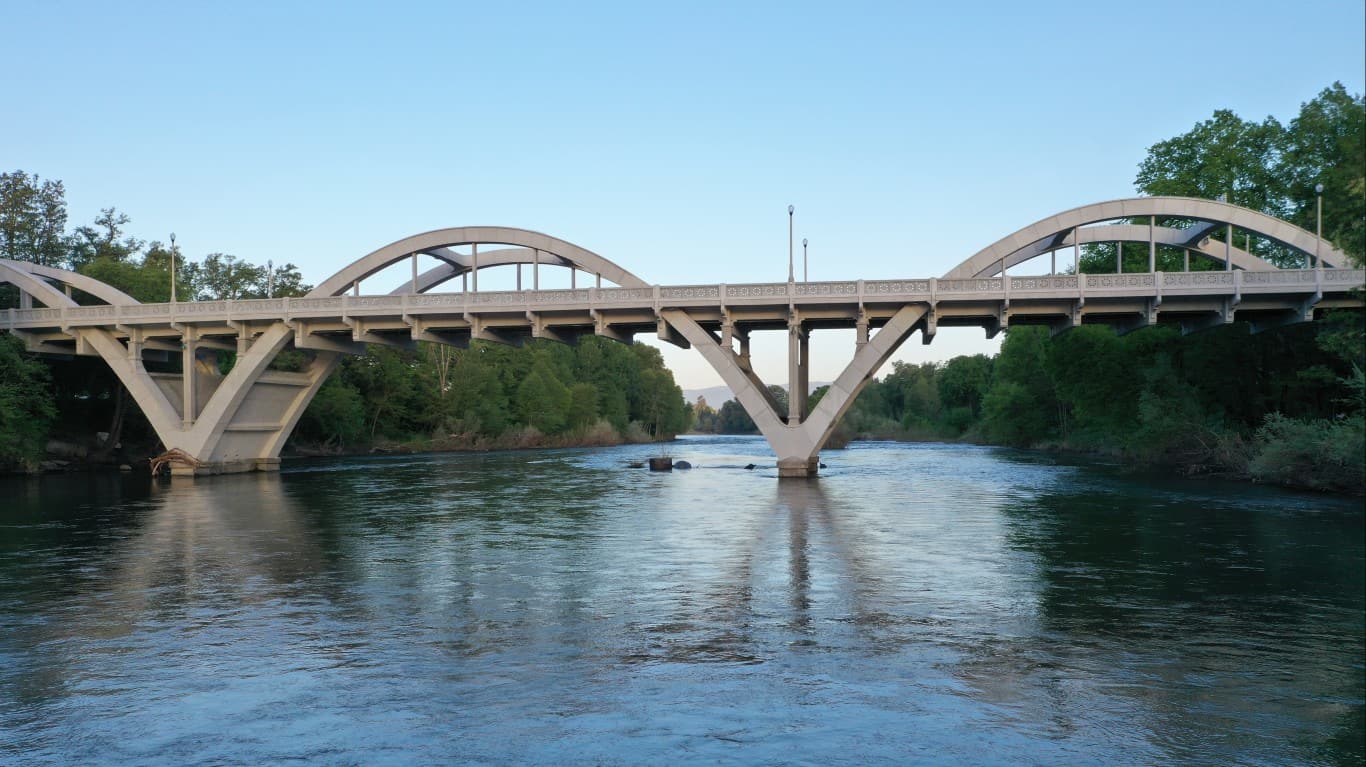
- Adults who report not exercising: 21.20% (state: 17.6%)
- Population with no access to places for exercise: 68.60% (state: 87.9%)
- Adult obesity rate: 30.40% (state: 28.3%)
- Adults who report fair/poor health: 15.80% (state: 12.7%)
- Average days people reported feeling unhealthy: 3.8 a month (state: 2.9 a month)
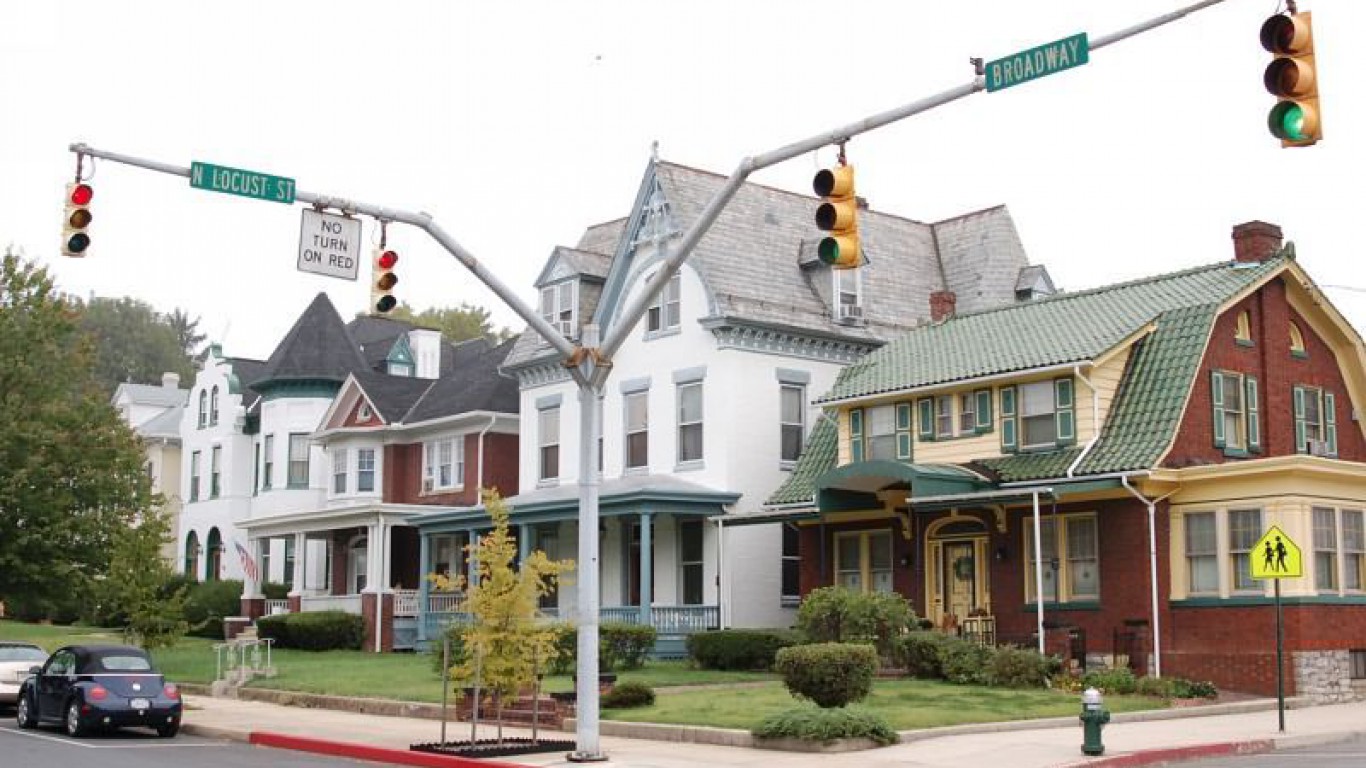
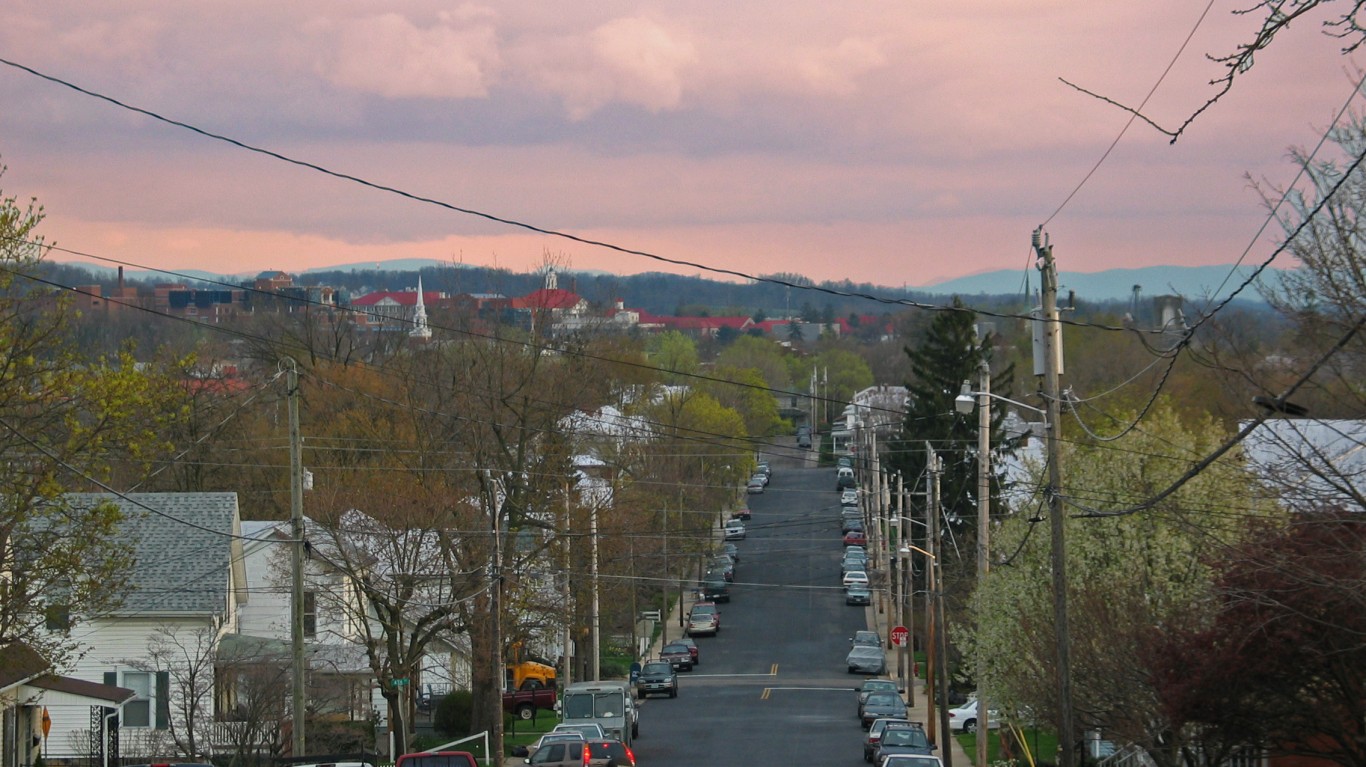
Pennsylvania: Lebanon
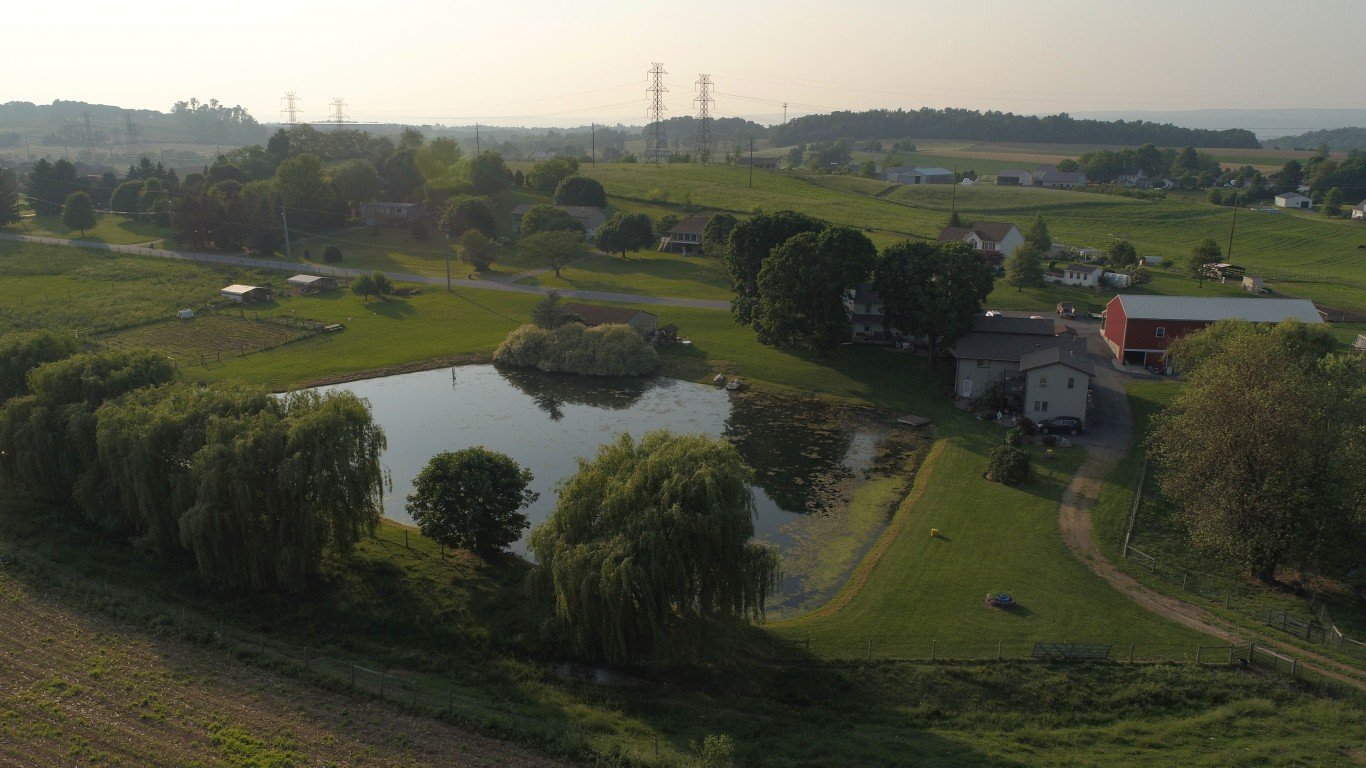
- Adults who report not exercising: 25.30% (state: 23.4%)
- Population with no access to places for exercise: 86.90% (state: 85.8%)
- Adult obesity rate: 36.30% (state: 31.6%)
- Adults who report fair/poor health: 14.20% (state: 13.1%)
- Average days people reported feeling unhealthy: 3.3 a month (state: 3.1 a month)
Rhode Island: Providence-Warwick

- Adults who report not exercising: 22.60% (state: 22.9%)
- Population with no access to places for exercise: 94.00% (state: 95.5%)
- Adult obesity rate: 29.60% (state: 30.6%)
- Adults who report fair/poor health: 12.50% (state: 11.8%)
- Average days people reported feeling unhealthy: 3 a month (state: 3.0 a month)
South Carolina: Florence
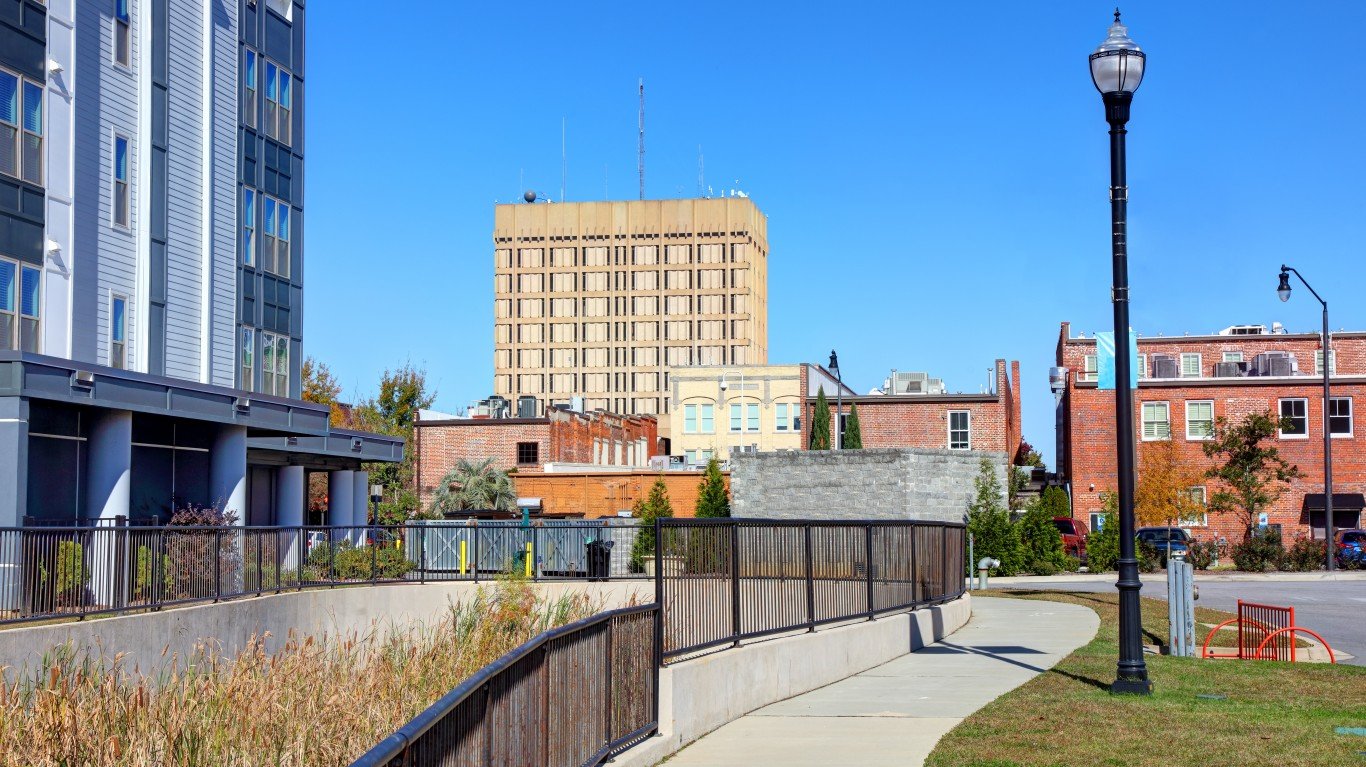
- Adults who report not exercising: 30.80% (state: 25.6%)
- Population with no access to places for exercise: 47.50% (state: 70.3%)
- Adult obesity rate: 41.70% (state: 36.7%)
- Adults who report fair/poor health: 18.40% (state: 15.9%)
- Average days people reported feeling unhealthy: 4.1 a month (state: 3.9 a month)
South Dakota: Rapid City
- Adults who report not exercising: 21.30% (state: 21.6%)
- Population with no access to places for exercise: 74.60% (state: 70.6%)
- Adult obesity rate: 32.80% (state: 33.4%)
- Adults who report fair/poor health: 10.80% (state: 10.4%)
- Average days people reported feeling unhealthy: 2.7 a month (state: 2.3 a month)
Tennessee: Cleveland
- Adults who report not exercising: 27.50% (state: 23.6%)
- Population with no access to places for exercise: 78.00% (state: 67.6%)
- Adult obesity rate: 38.70% (state: 35.8%)
- Adults who report fair/poor health: 16.20% (state: 15.7%)
- Average days people reported feeling unhealthy: 3.7 a month (state: 3.3 a month)
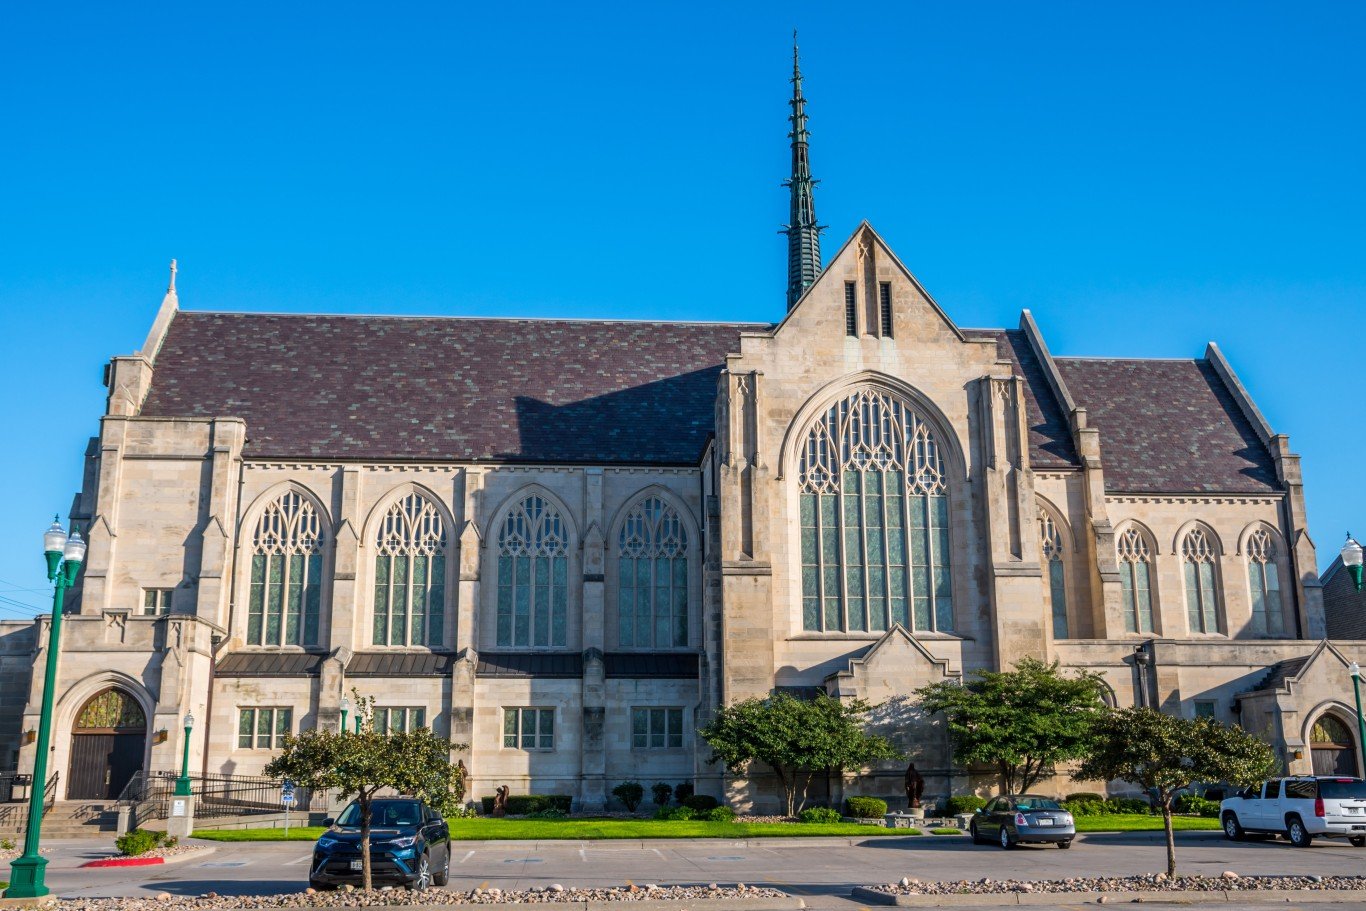
Texas: Laredo
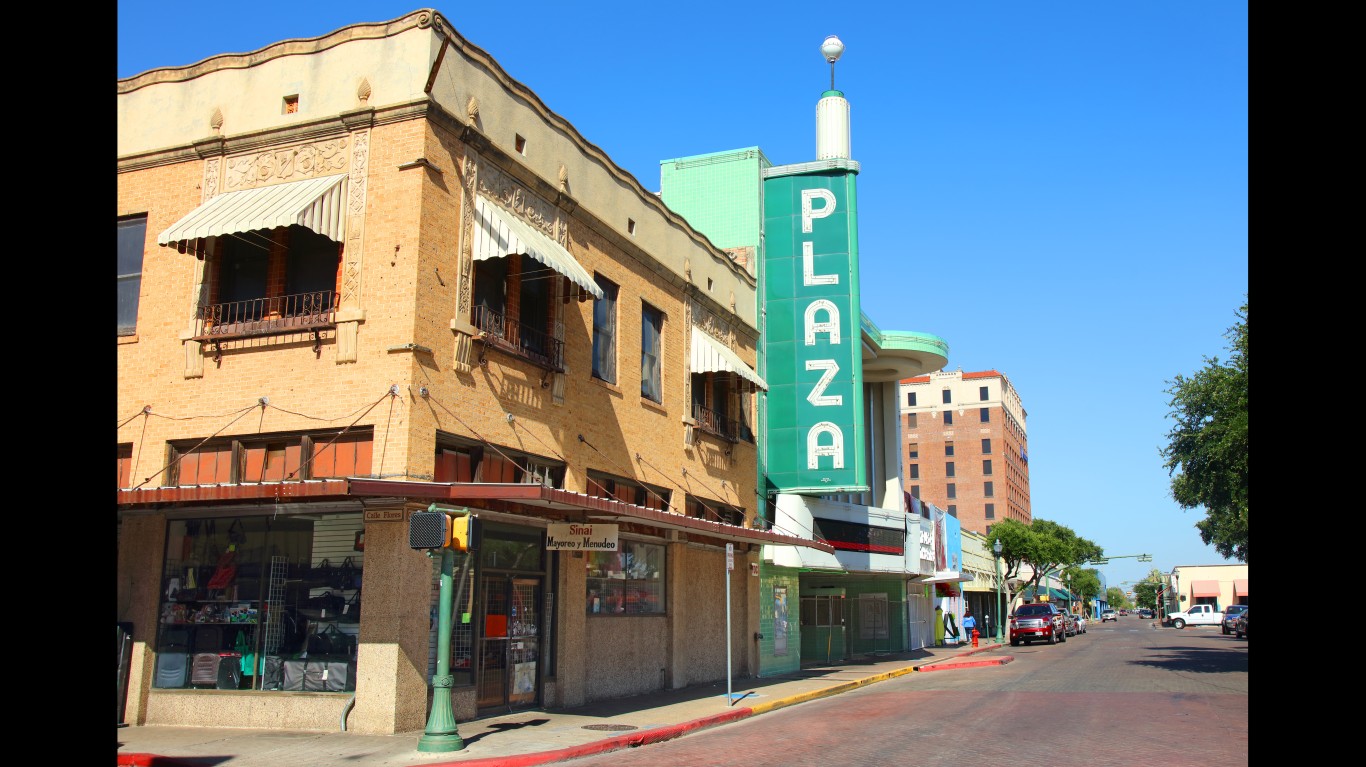
- Adults who report not exercising: 38.00% (state: 25.4%)
- Population with no access to places for exercise: 91.10% (state: 81.7%)
- Adult obesity rate: 44.60% (state: 35.8%)
- Adults who report fair/poor health: 27.40% (state: 15.7%)
- Average days people reported feeling unhealthy: 4.3 a month (state: 2.9 a month)
Utah: Ogden-Clearfield
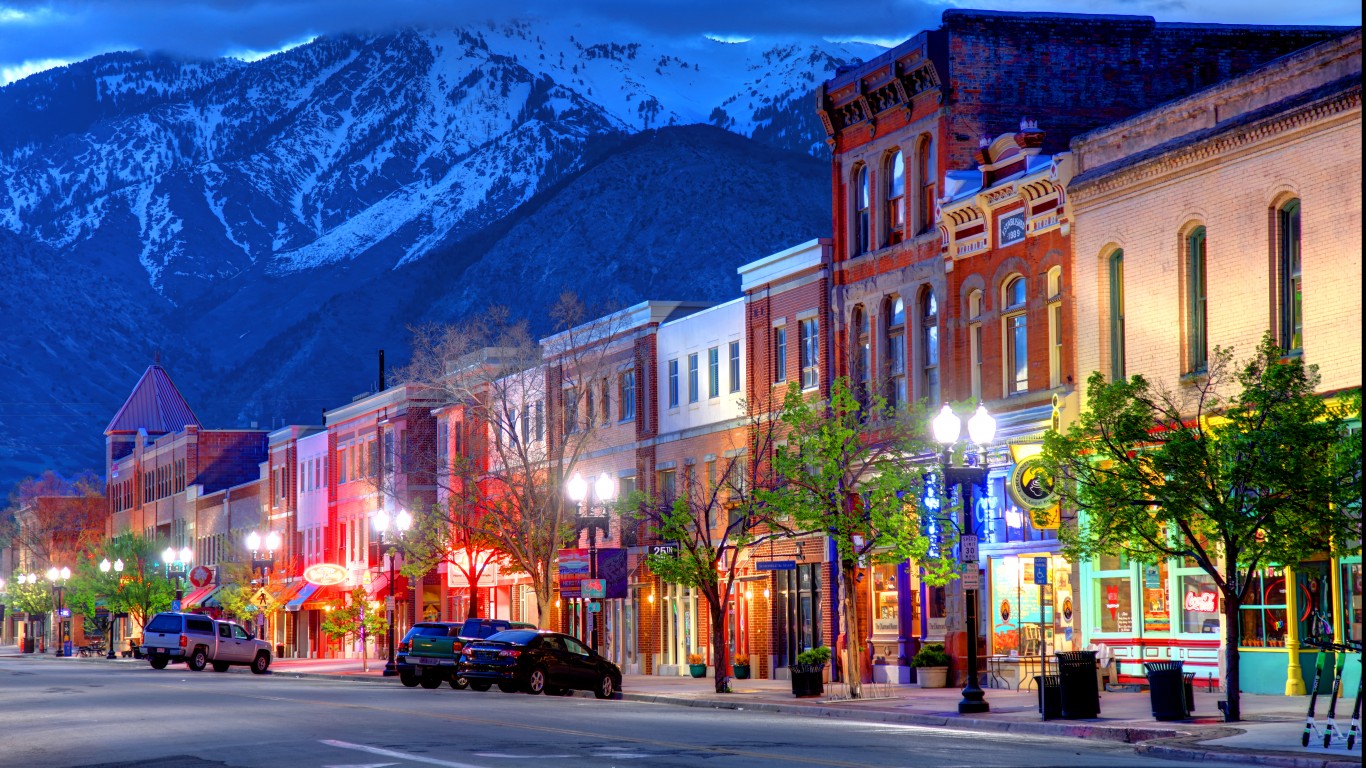
- Adults who report not exercising: 17.90% (state: 16.3%)
- Population with no access to places for exercise: 88.00% (state: 84.2%)
- Adult obesity rate: 32.70% (state: 29.3%)
- Adults who report fair/poor health: 11.40% (state: 10.9%)
- Average days people reported feeling unhealthy: 3.2 a month (state: 2.8 a month)
Vermont: Burlington-South Burlington

- Adults who report not exercising: 15.20% (state: 17.1%)
- Population with no access to places for exercise: 77.10% (state: 70.6%)
- Adult obesity rate: 24.40% (state: 26.3%)
- Adults who report fair/poor health: 9.10% (state: 10.6%)
- Average days people reported feeling unhealthy: 2.6 a month (state: 2.9 a month)
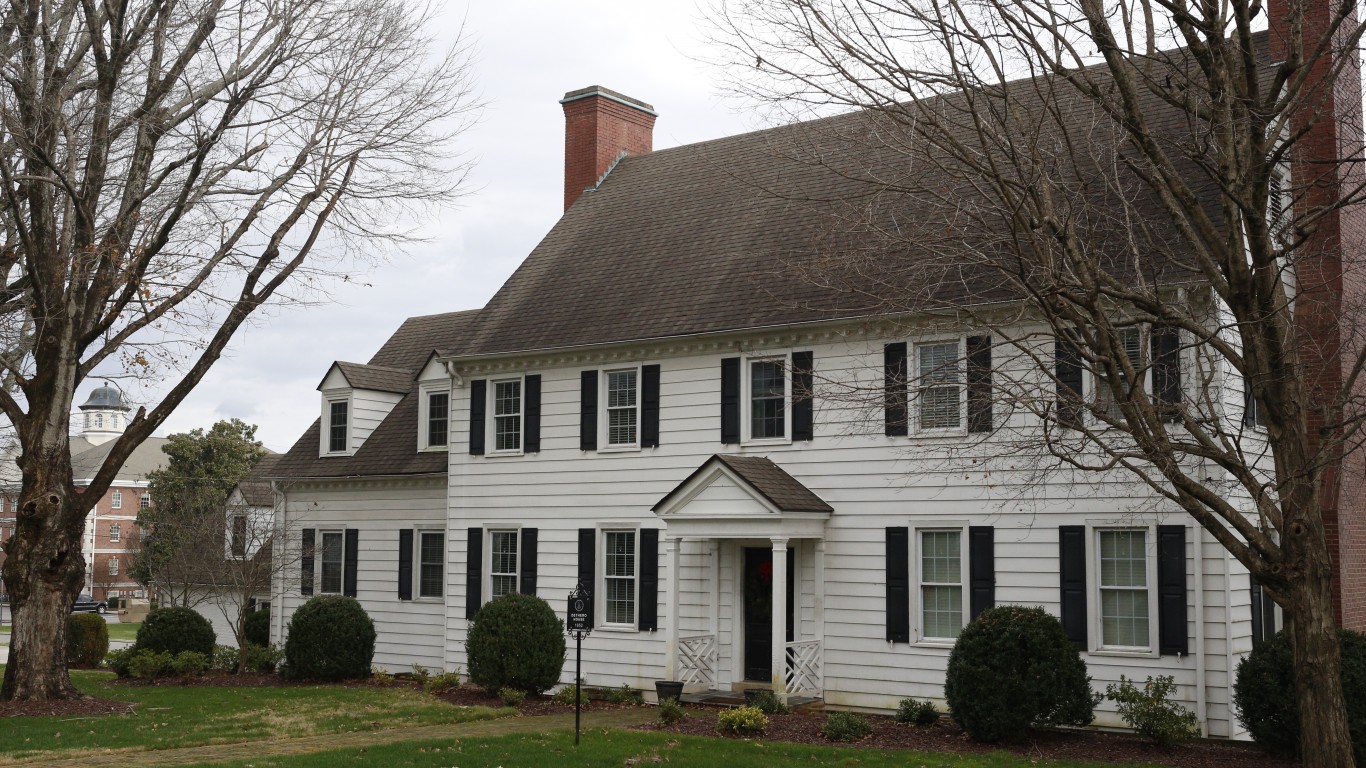
Virginia: Harrisonburg
- Adults who report not exercising: 24.50% (state: 20.4%)
- Population with no access to places for exercise: 68.80% (state: 83.4%)
- Adult obesity rate: 34.10% (state: 32.4%)
- Adults who report fair/poor health: 15.90% (state: 12.4%)
- Average days people reported feeling unhealthy: 3.4 a month (state: 2.7 a month)
Washington: Yakima
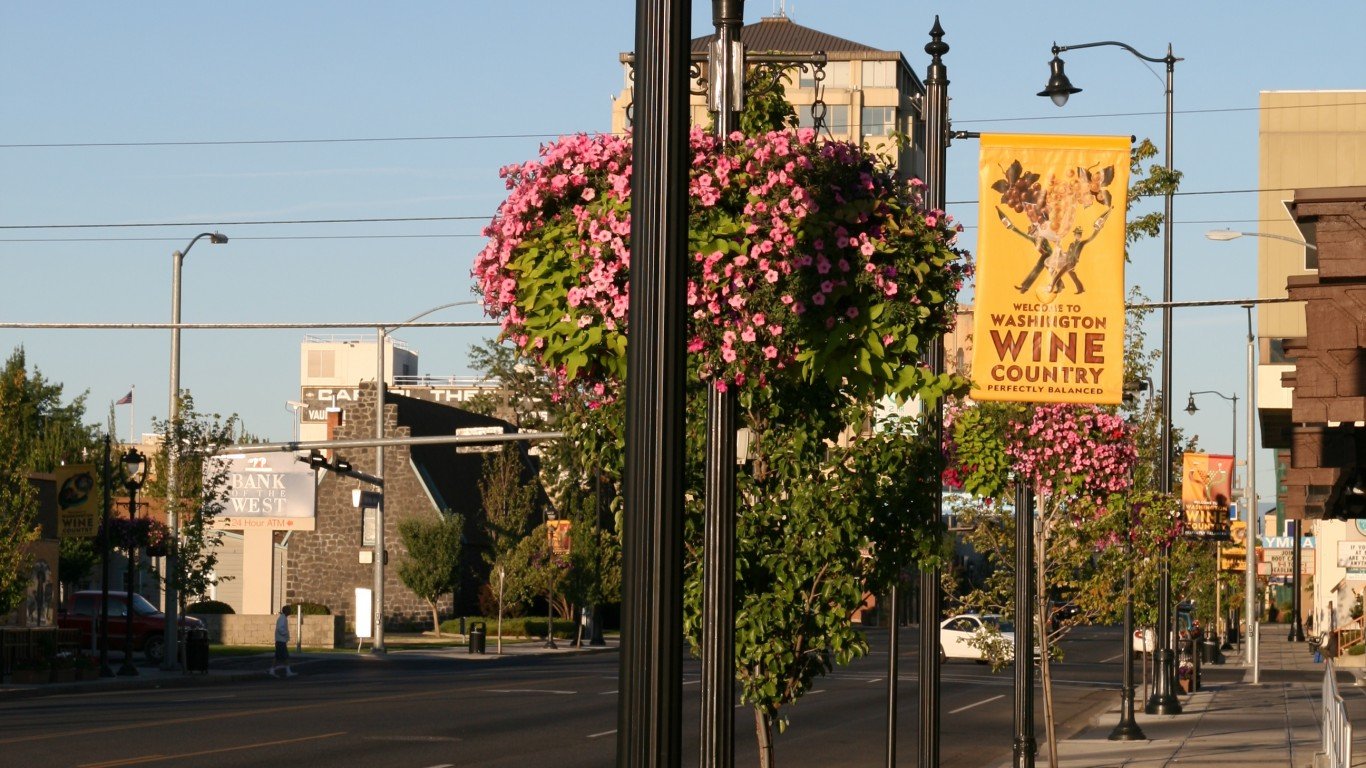
- Adults who report not exercising: 25.30% (state: 17.5%)
- Population with no access to places for exercise: 77.90% (state: 86.0%)
- Adult obesity rate: 37.10% (state: 28.0%)
- Adults who report fair/poor health: 19.20% (state: 11.8%)
- Average days people reported feeling unhealthy: 4.1 a month (state: 2.9 a month)
West Virginia: Charleston

- Adults who report not exercising: 30.50% (state: 27.4%)
- Population with no access to places for exercise: 56.50% (state: 57.8%)
- Adult obesity rate: 39.00% (state: 39.6%)
- Adults who report fair/poor health: 19.70% (state: 20.0%)
- Average days people reported feeling unhealthy: 4.4 a month (state: 4.4 a month)
Wisconsin: Janesville-Beloit
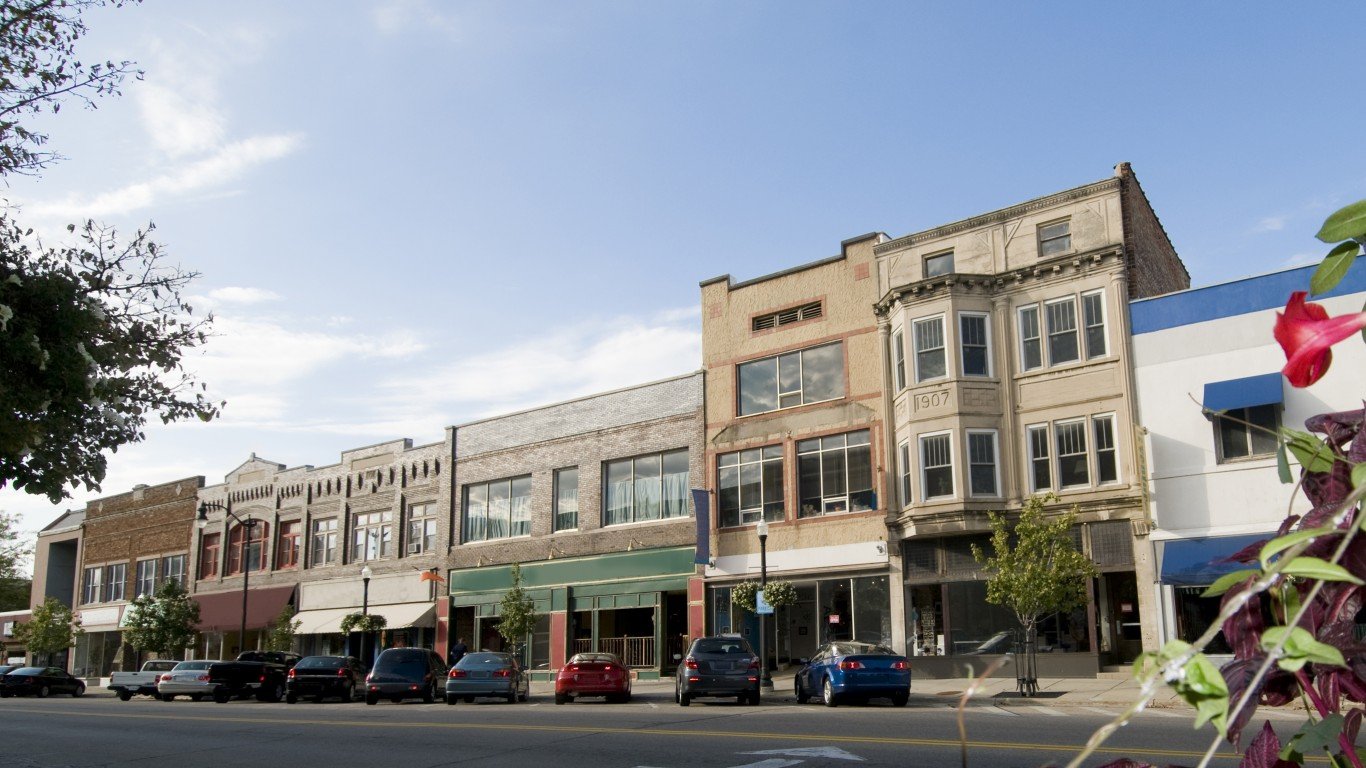
- Adults who report not exercising: 21.60% (state: 19.8%)
- Population with no access to places for exercise: 87.30% (state: 83.5%)
- Adult obesity rate: 35.10% (state: 32.7%)
- Adults who report fair/poor health: 12.10% (state: 12.4%)
- Average days people reported feeling unhealthy: 3.3 a month (state: 3.2 a month)
Wyoming: Casper
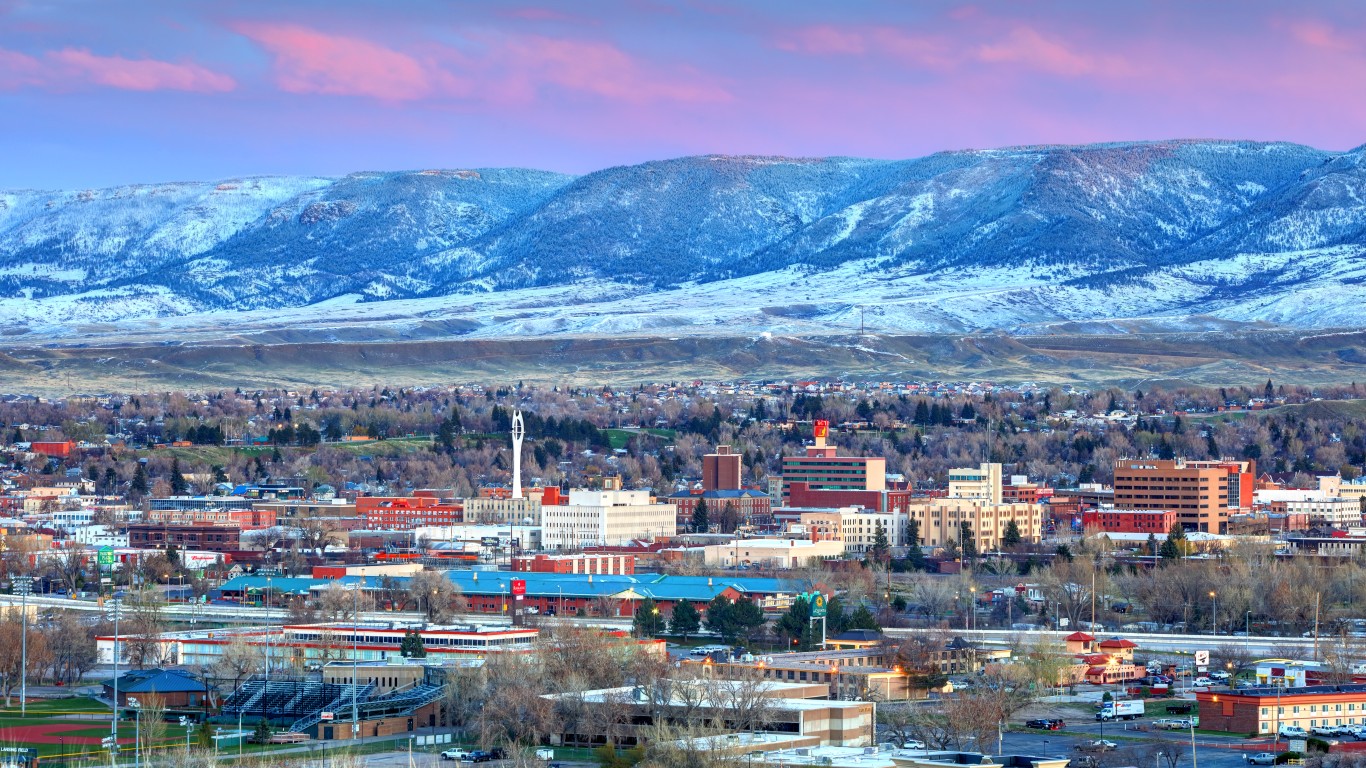
- Adults who report not exercising: 25.00% (state: 21.6%)
- Population with no access to places for exercise: 82.80% (state: 77.5%)
- Adult obesity rate: 34.00% (state: 30.6%)
- Adults who report fair/poor health: 12.20% (state: 11.5%)
- Average days people reported feeling unhealthy: 2.9 a month (state: 2.7 a month)