The South is the most populous region of the United States, and unfortunately for the area, it also is home to the most obese cities in America.
24/7 Tempo analyzed county-level data from the 2023 County Health Rankings & Roadmaps report (CHR), a collaboration between the Robert Wood Johnson Foundation and the University of Wisconsin Population Health Institute to determine the 50 most obese cities in the U.S. We aggregated county-level statistics to metropolitan statistical areas. The age-adjusted percentage of the total population 20 years and over diagnosed with diabetes in 2018, the latest year for which data is available, also came from the 2023 CHR. Data on people in poor or fair health, who don’t exercise regularly and who don’t sleep more than seven hours a night also came from the CHR.
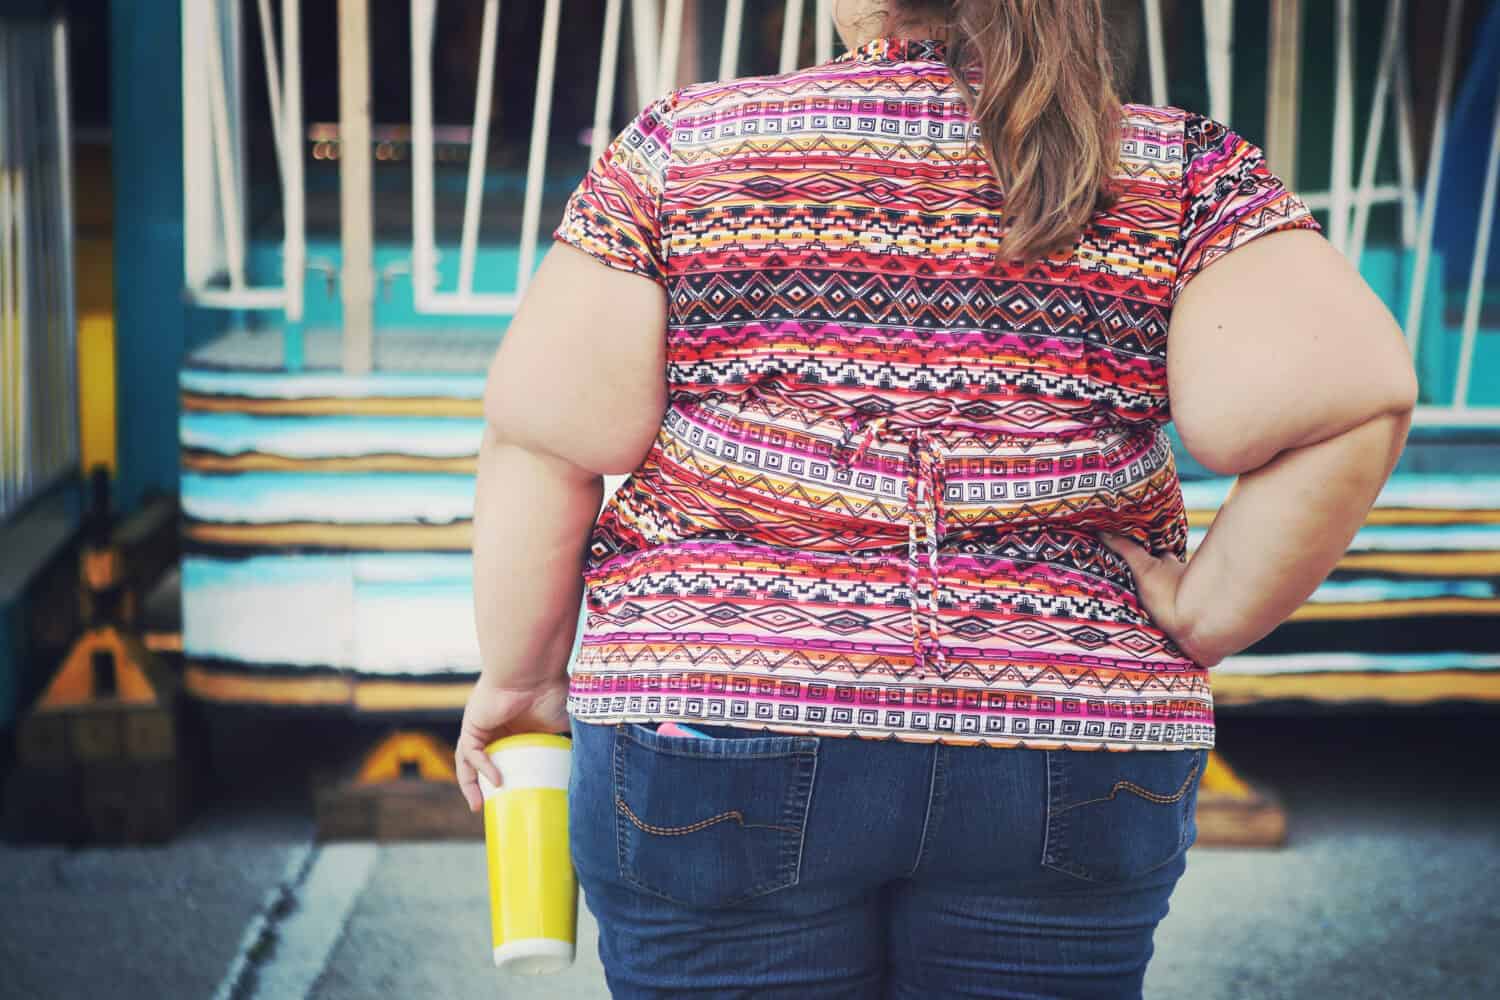
Obesity is one of the most serious health issues in the United States. Obesity-related conditions include heart disease, stroke, type 2 diabetes and certain types of cancer. These are among the leading causes of preventable, premature death, according to data from the Centers for Disease Control and Prevention. (Also See The States With the Highest Diabetes Rates.)
The CDC’s data says obesity prevalence in the U.S. was 41.9% and statistics indicate the nation is becoming more obese. In the Trust for America’s Health’s analysis of CDC data, in 2022, 22 states had an adult-obesity rate at or above 35%. In 2012, no state had an adult-obesity rate above 35%. The problem is more prevalent among non-Hispanic Black adults at 49.9%, the highest age-adjusted prevalence of obesity, followed by Hispanic adults (45.6%), non-Hispanic White adults (41.4%) and non-Hispanic Asian adults (16.1%).
Southern cities account for all but 12 of the 40 cities on our list of the most obese cities in the U.S. Eight of the 10 cities are from the South, and three are from Texas. Southern cities occupy all 10 spots in two of the metrics listed (adults who are obese, don’t exercise, report poor or fair health, have diabetes; and get less than seven hours of sleep a night) and nine of out 10 in two others. (Here is a list of the most obese state in America.)
Texas cities figure prominently in all but one of the metrics; a Lone Star State city is first in four of the five metrics on our list.
Outside of the South, cities from the Midwestern states of Michigan (three), Illinois (three), Iowa, and Indiana were among the most obese in America.
Here are the most obese cities in America.
40. Michigan City-La Porte, Indiana

- Obesity rate among adults: 39.30% (US avg: 32.0%)
- Adults who don’t exercise regularly: 27.60% — 73 out of 384 metros (US avg: 22.2%)
- People over 20 with diabetes: 11.10% — 102 out of 384 metros (US avg: 8.9%)
- Adults in poor or fair health: 16.70% — 98 out of 384 metros (US avg: 12.0%)
- Adults who don’t get enough sleep: 38.40% — 35 out of 384 metros (US avg: 33.0%)
39. Jackson, Mississippi

- Obesity rate among adults: 39.30% (US avg: 32.0%)
- Adults who don’t exercise regularly: 27.60% — 75 out of 384 metros (US avg: 22.2%)
- People over 20 with diabetes: 12.00% — 54 out of 384 metros (US avg: 8.9%)
- Adults in poor or fair health: 17.70% — 68 out of 384 metros (US avg: 12.0%)
- Adults who don’t get enough sleep: 34.70% — 174 out of 384 metros (US avg: 33.0%)
38. Weirton-Steubenville, West Virginia-Ohio

- Obesity rate among adults: 39.30% (US avg: 32.0%)
- Adults who don’t exercise regularly: 28.00% — 61 out of 384 metros (US avg: 22.2%)
- People over 20 with diabetes: 11.30% — 86 out of 384 metros (US avg: 8.9%)
- Adults in poor or fair health: 17.50% — 74 out of 384 metros (US avg: 12.0%)
- Adults who don’t get enough sleep: 41.80% — 3 out of 384 metros (US avg: 33.0%)
37. Waterloo-Cedar Falls, Iowa

- Obesity rate among adults: 39.30% (US avg: 32.0%)
- Adults who don’t exercise regularly: 23.00% — 217 out of 384 metros (US avg: 22.2%)
- People over 20 with diabetes: 9.00% — 275 out of 384 metros (US avg: 8.9%)
- Adults in poor or fair health: 12.10% — 302 out of 384 metros (US avg: 12.0%)
- Adults who don’t get enough sleep: 31.90% — 293 out of 384 metros (US avg: 33.0%)
36. Lawton, Oklahoma

- Obesity rate among adults: 39.40% (US avg: 32.0%)
- Adults who don’t exercise regularly: 31.20% — 14 out of 384 metros (US avg: 22.2%)
- People over 20 with diabetes: 12.30% — 43 out of 384 metros (US avg: 8.9%)
- Adults in poor or fair health: 18.00% — 60 out of 384 metros (US avg: 12.0%)
- Adults who don’t get enough sleep: 38.60% — 30 out of 384 metros (US avg: 33.0%)
35. Mobile, Alabama

- Obesity rate among adults: 39.50% (US avg: 32.0%)
- Adults who don’t exercise regularly: 27.90% — 64 out of 384 metros (US avg: 22.2%)
- People over 20 with diabetes: 13.00% — 18 out of 384 metros (US avg: 8.9%)
- Adults in poor or fair health: 19.90% — 21 out of 384 metros (US avg: 12.0%)
- Adults who don’t get enough sleep: 40.60% — 11 out of 384 metros (US avg: 33.0%)
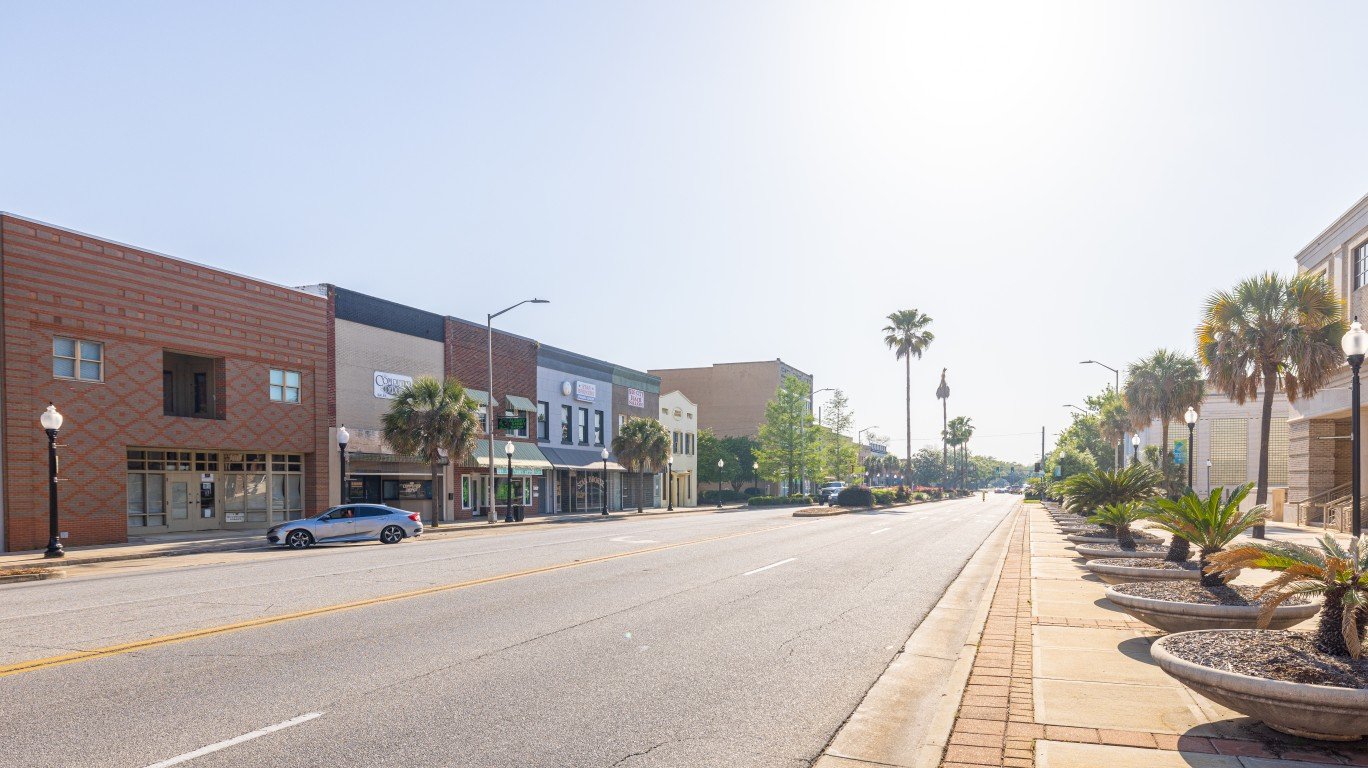
34. Valdosta, Georgia

- Obesity rate among adults: 39.60% (US avg: 32.0%)
- Adults who don’t exercise regularly: 29.60% — 29 out of 384 metros (US avg: 22.2%)
- People over 20 with diabetes: 12.90% — 22 out of 384 metros (US avg: 8.9%)
- Adults in poor or fair health: 18.90% — 42 out of 384 metros (US avg: 12.0%)
- Adults who don’t get enough sleep: 38.70% — 27 out of 384 metros (US avg: 33.0%)
33. Odessa, Texas
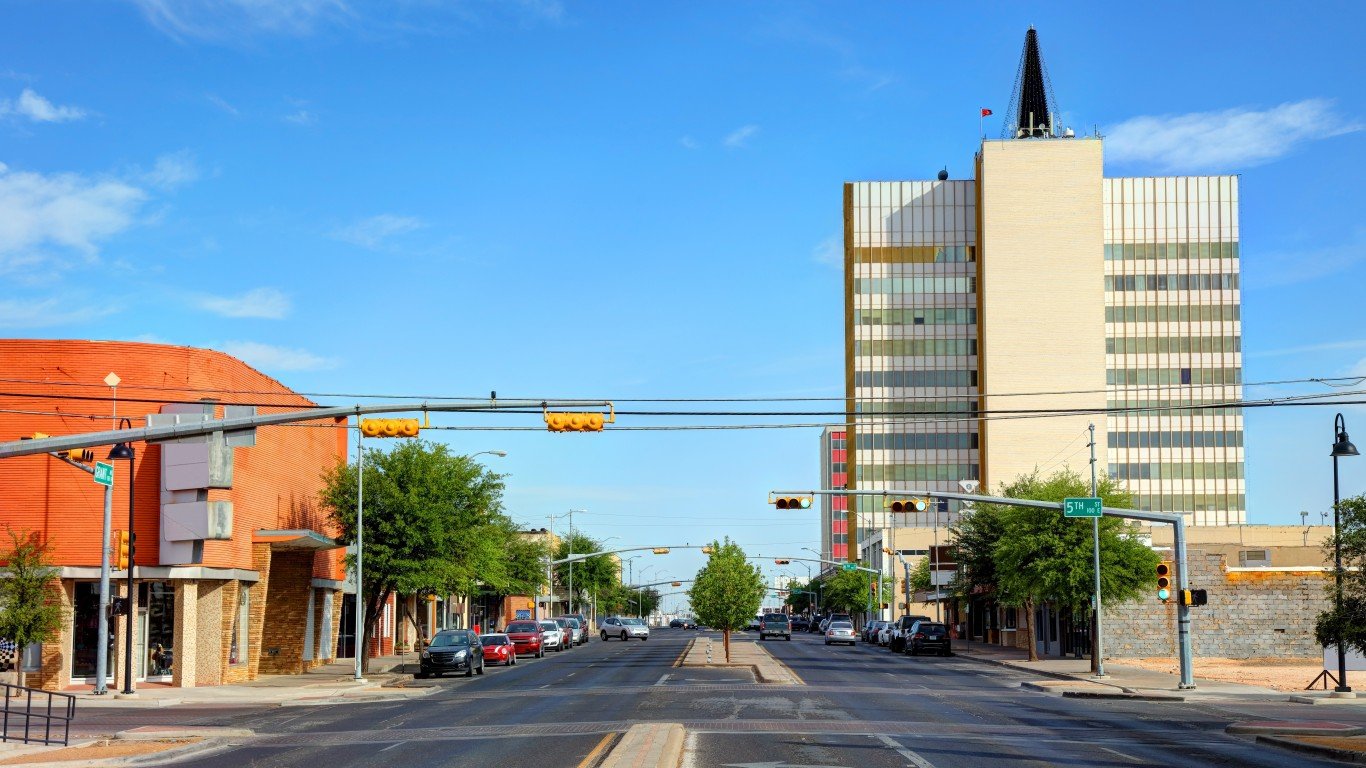
- Obesity rate among adults: 39.60% (US avg: 32.0%)
- Adults who don’t exercise regularly: 31.10% — 15 out of 384 metros (US avg: 22.2%)
- People over 20 with diabetes: 12.90% — 24 out of 384 metros (US avg: 8.9%)
- Adults in poor or fair health: 20.40% — 15 out of 384 metros (US avg: 12.0%)
- Adults who don’t get enough sleep: 36.30% — 91 out of 384 metros (US avg: 33.0%)
32. Kalamazoo-Portage, Michigan

- Obesity rate among adults: 39.70% (US avg: 32.0%)
- Adults who don’t exercise regularly: 18.30% — 348 out of 384 metros (US avg: 22.2%)
- People over 20 with diabetes: 9.40% — 240 out of 384 metros (US avg: 8.9%)
- Adults in poor or fair health: 12.90% — 268 out of 384 metros (US avg: 12.0%)
- Adults who don’t get enough sleep: 33.90% — 212 out of 384 metros (US avg: 33.0%)
31. Decatur, Alabama
- Obesity rate among adults: 39.80% (US avg: 32.0%)
- Adults who don’t exercise regularly: 28.40% — 51 out of 384 metros (US avg: 22.2%)
- People over 20 with diabetes: 11.50% — 71 out of 384 metros (US avg: 8.9%)
- Adults in poor or fair health: 19.10% — 38 out of 384 metros (US avg: 12.0%)
- Adults who don’t get enough sleep: 38.40% — 36 out of 384 metros (US avg: 33.0%)
30. Chambersburg-Waynesboro, Pennsylvania

- Obesity rate among adults: 40.00% (US avg: 32.0%)
- Adults who don’t exercise regularly: 23.20% — 210 out of 384 metros (US avg: 22.2%)
- People over 20 with diabetes: 9.10% — 263 out of 384 metros (US avg: 8.9%)
- Adults in poor or fair health: 13.70% — 231 out of 384 metros (US avg: 12.0%)
- Adults who don’t get enough sleep: 36.50% — 82 out of 384 metros (US avg: 33.0%)
29. Muncie, Indiana

- Obesity rate among adults: 40.10% (US avg: 32.0%)
- Adults who don’t exercise regularly: 29.20% — 35 out of 384 metros (US avg: 22.2%)
- People over 20 with diabetes: 11.50% — 76 out of 384 metros (US avg: 8.9%)
- Adults in poor or fair health: 17.30% — 82 out of 384 metros (US avg: 12.0%)
- Adults who don’t get enough sleep: 35.60% — 117 out of 384 metros (US avg: 33.0%)
28. Cape Girardeau, Missouri-Illinois
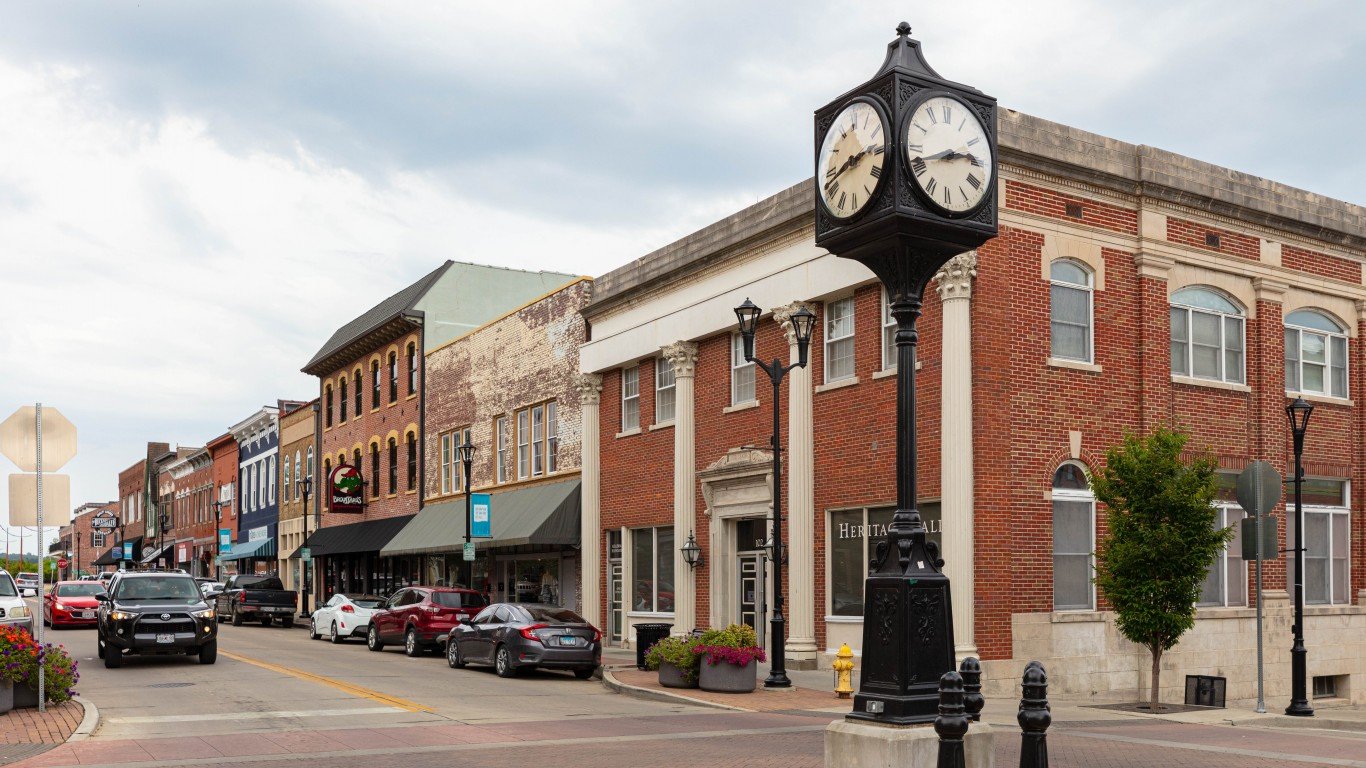
- Obesity rate among adults: 40.10% (US avg: 32.0%)
- Adults who don’t exercise regularly: 25.80% — 116 out of 384 metros (US avg: 22.2%)
- People over 20 with diabetes: 9.80% — 204 out of 384 metros (US avg: 8.9%)
- Adults in poor or fair health: 15.50% — 143 out of 384 metros (US avg: 12.0%)
- Adults who don’t get enough sleep: 33.20% — 248 out of 384 metros (US avg: 33.0%)
27. Houma-Thibodaux, Louisiana

- Obesity rate among adults: 40.30% (US avg: 32.0%)
- Adults who don’t exercise regularly: 31.60% — 12 out of 384 metros (US avg: 22.2%)
- People over 20 with diabetes: 12.60% — 29 out of 384 metros (US avg: 8.9%)
- Adults in poor or fair health: 19.60% — 25 out of 384 metros (US avg: 12.0%)
- Adults who don’t get enough sleep: 35.50% — 120 out of 384 metros (US avg: 33.0%)
26. Jonesboro, Arkansas

- Obesity rate among adults: 40.50% (US avg: 32.0%)
- Adults who don’t exercise regularly: 29.30% — 33 out of 384 metros (US avg: 22.2%)
- People over 20 with diabetes: 10.50% — 144 out of 384 metros (US avg: 8.9%)
- Adults in poor or fair health: 18.70% — 45 out of 384 metros (US avg: 12.0%)
- Adults who don’t get enough sleep: 35.50% — 121 out of 384 metros (US avg: 33.0%)
25. Yuma, Arizona
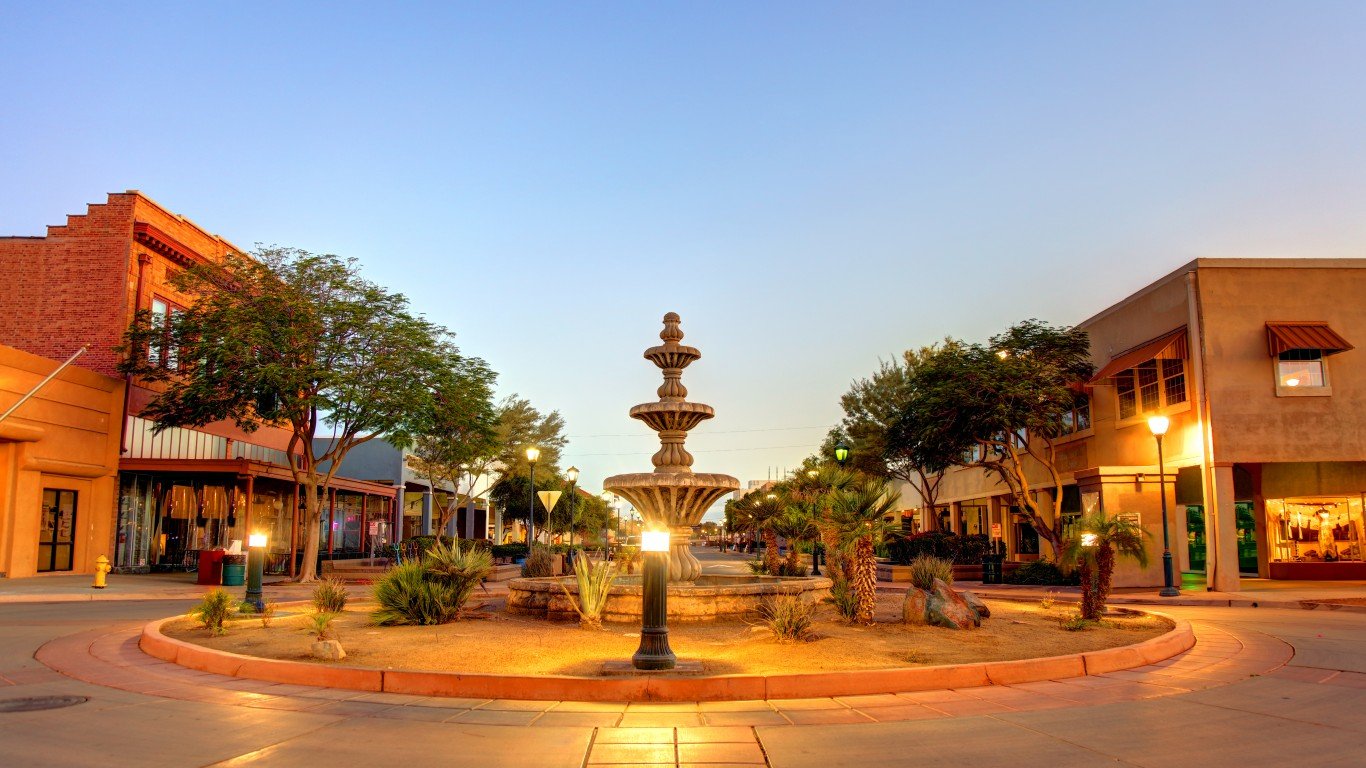
- Obesity rate among adults: 40.50% (US avg: 32.0%)
- Adults who don’t exercise regularly: 29.40% — 32 out of 384 metros (US avg: 22.2%)
- People over 20 with diabetes: 13.00% — 19 out of 384 metros (US avg: 8.9%)
- Adults in poor or fair health: 21.10% — 12 out of 384 metros (US avg: 12.0%)
- Adults who don’t get enough sleep: 36.60% — 81 out of 384 metros (US avg: 33.0%)
24. Corpus Christi, Texas

- Obesity rate among adults: 40.60% (US avg: 32.0%)
- Adults who don’t exercise regularly: 32.10% — 8 out of 384 metros (US avg: 22.2%)
- People over 20 with diabetes: 13.70% — 8 out of 384 metros (US avg: 8.9%)
- Adults in poor or fair health: 21.10% — 13 out of 384 metros (US avg: 12.0%)
- Adults who don’t get enough sleep: 36.70% — 77 out of 384 metros (US avg: 33.0%)
23. Kankakee, Illinois

- Obesity rate among adults: 40.60% (US avg: 32.0%)
- Adults who don’t exercise regularly: 25.90% — 111 out of 384 metros (US avg: 22.2%)
- People over 20 with diabetes: 10.00% — 185 out of 384 metros (US avg: 8.9%)
- Adults in poor or fair health: 15.10% — 157 out of 384 metros (US avg: 12.0%)
- Adults who don’t get enough sleep: 33.90% — 215 out of 384 metros (US avg: 33.0%)
22. Hinesville, Georgia

- Obesity rate among adults: 40.70% (US avg: 32.0%)
- Adults who don’t exercise regularly: 29.10% — 37 out of 384 metros (US avg: 22.2%)
- People over 20 with diabetes: 13.10% — 15 out of 384 metros (US avg: 8.9%)
- Adults in poor or fair health: 18.30% — 52 out of 384 metros (US avg: 12.0%)
- Adults who don’t get enough sleep: 41.00% — 5 out of 384 metros (US avg: 33.0%)
21. Parkersburg-Vienna, West Virginia

- Obesity rate among adults: 40.70% (US avg: 32.0%)
- Adults who don’t exercise regularly: 27.30% — 84 out of 384 metros (US avg: 22.2%)
- People over 20 with diabetes: 11.70% — 64 out of 384 metros (US avg: 8.9%)
- Adults in poor or fair health: 19.20% — 33 out of 384 metros (US avg: 12.0%)
- Adults who don’t get enough sleep: 38.00% — 48 out of 384 metros (US avg: 33.0%)
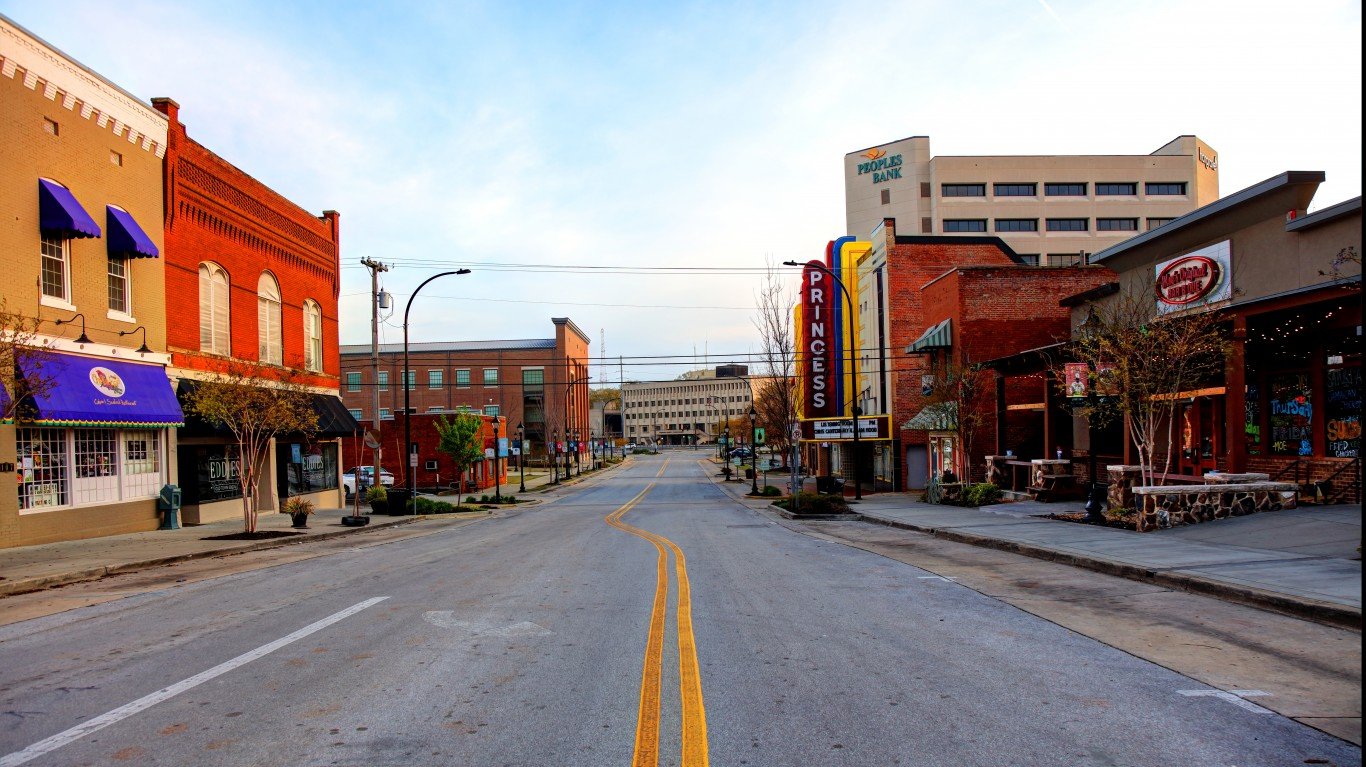
20. Jackson, Tennessee

- Obesity rate among adults: 40.70% (US avg: 32.0%)
- Adults who don’t exercise regularly: 27.10% — 88 out of 384 metros (US avg: 22.2%)
- People over 20 with diabetes: 12.80% — 26 out of 384 metros (US avg: 8.9%)
- Adults in poor or fair health: 18.00% — 59 out of 384 metros (US avg: 12.0%)
- Adults who don’t get enough sleep: 35.40% — 129 out of 384 metros (US avg: 33.0%)
19. Hammond, Louisiana

- Obesity rate among adults: 40.80% (US avg: 32.0%)
- Adults who don’t exercise regularly: 33.40% — 3 out of 384 metros (US avg: 22.2%)
- People over 20 with diabetes: 12.40% — 36 out of 384 metros (US avg: 8.9%)
- Adults in poor or fair health: 19.50% — 26 out of 384 metros (US avg: 12.0%)
- Adults who don’t get enough sleep: 34.80% — 171 out of 384 metros (US avg: 33.0%)
18. Rockford, Illinois

- Obesity rate among adults: 40.90% (US avg: 32.0%)
- Adults who don’t exercise regularly: 26.90% — 95 out of 384 metros (US avg: 22.2%)
- People over 20 with diabetes: 10.30% — 166 out of 384 metros (US avg: 8.9%)
- Adults in poor or fair health: 15.50% — 140 out of 384 metros (US avg: 12.0%)
- Adults who don’t get enough sleep: 32.20% — 281 out of 384 metros (US avg: 33.0%)
17. Gadsden, Alabama

- Obesity rate among adults: 41.10% (US avg: 32.0%)
- Adults who don’t exercise regularly: 29.30% — 34 out of 384 metros (US avg: 22.2%)
- People over 20 with diabetes: 12.10% — 49 out of 384 metros (US avg: 8.9%)
- Adults in poor or fair health: 19.10% — 35 out of 384 metros (US avg: 12.0%)
- Adults who don’t get enough sleep: 39.80% — 20 out of 384 metros (US avg: 33.0%)
16. Kokomo, Indiana

- Obesity rate among adults: 41.20% (US avg: 32.0%)
- Adults who don’t exercise regularly: 26.80% — 96 out of 384 metros (US avg: 22.2%)
- People over 20 with diabetes: 10.30% — 163 out of 384 metros (US avg: 8.9%)
- Adults in poor or fair health: 15.20% — 152 out of 384 metros (US avg: 12.0%)
- Adults who don’t get enough sleep: 35.20% — 139 out of 384 metros (US avg: 33.0%)
15. Sumter, South Carolina

- Obesity rate among adults: 41.30% (US avg: 32.0%)
- Adults who don’t exercise regularly: 29.60% — 27 out of 384 metros (US avg: 22.2%)
- People over 20 with diabetes: 13.60% — 10 out of 384 metros (US avg: 8.9%)
- Adults in poor or fair health: 18.80% — 44 out of 384 metros (US avg: 12.0%)
- Adults who don’t get enough sleep: 38.20% — 42 out of 384 metros (US avg: 33.0%)
14. Albany, Georgia
- Obesity rate among adults: 41.40% (US avg: 32.0%)
- Adults who don’t exercise regularly: 29.60% — 28 out of 384 metros (US avg: 22.2%)
- People over 20 with diabetes: 14.50% — 5 out of 384 metros (US avg: 8.9%)
- Adults in poor or fair health: 20.00% — 20 out of 384 metros (US avg: 12.0%)
- Adults who don’t get enough sleep: 40.70% — 7 out of 384 metros (US avg: 33.0%)
13. Florence, South Carolina

- Obesity rate among adults: 41.70% (US avg: 32.0%)
- Adults who don’t exercise regularly: 30.80% — 16 out of 384 metros (US avg: 22.2%)
- People over 20 with diabetes: 13.00% — 20 out of 384 metros (US avg: 8.9%)
- Adults in poor or fair health: 18.40% — 51 out of 384 metros (US avg: 12.0%)
- Adults who don’t get enough sleep: 38.40% — 37 out of 384 metros (US avg: 33.0%)
12. Beckley, West Virginia

- Obesity rate among adults: 41.80% (US avg: 32.0%)
- Adults who don’t exercise regularly: 30.50% — 22 out of 384 metros (US avg: 22.2%)
- People over 20 with diabetes: 13.00% — 21 out of 384 metros (US avg: 8.9%)
- Adults in poor or fair health: 21.70% — 8 out of 384 metros (US avg: 12.0%)
- Adults who don’t get enough sleep: 43.20% — 1 out of 384 metros (US avg: 33.0%)
11. Shreveport-Bossier City, Louisiana

- Obesity rate among adults: 42.00% (US avg: 32.0%)
- Adults who don’t exercise regularly: 31.60% — 13 out of 384 metros (US avg: 22.2%)
- People over 20 with diabetes: 13.50% — 11 out of 384 metros (US avg: 8.9%)
- Adults in poor or fair health: 19.40% — 28 out of 384 metros (US avg: 12.0%)
- Adults who don’t get enough sleep: 39.90% — 18 out of 384 metros (US avg: 33.0%)
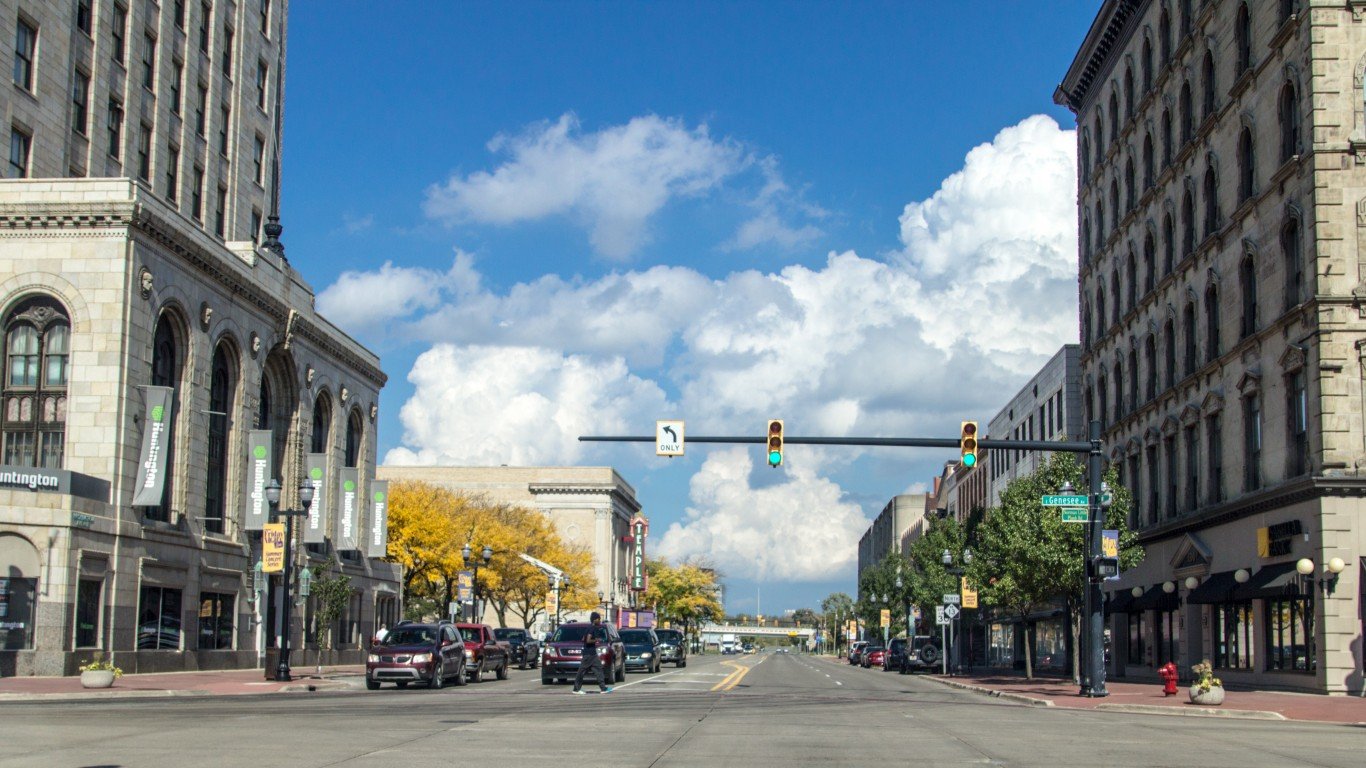
10. Flint, Michigan

- Obesity rate among adults: 42.10% (US avg: 32.0%)
- Adults who don’t exercise regularly: 24.70% — 158 out of 384 metros (US avg: 22.2%)
- People over 20 with diabetes: 11.60% — 67 out of 384 metros (US avg: 8.9%)
- Adults in poor or fair health: 16.80% — 94 out of 384 metros (US avg: 12.0%)
- Adults who don’t get enough sleep: 40.10% — 15 out of 384 metros (US avg: 33.0%)
9. Tuscaloosa, Alabama
- Obesity rate among adults: 42.20% (US avg: 32.0%)
- Adults who don’t exercise regularly: 30.00% — 25 out of 384 metros (US avg: 22.2%)
- People over 20 with diabetes: 12.50% — 33 out of 384 metros (US avg: 8.9%)
- Adults in poor or fair health: 19.10% — 37 out of 384 metros (US avg: 12.0%)
- Adults who don’t get enough sleep: 40.70% — 6 out of 384 metros (US avg: 33.0%)
8. Monroe, Louisiana
- Obesity rate among adults: 42.40% (US avg: 32.0%)
- Adults who don’t exercise regularly: 33.00% — 6 out of 384 metros (US avg: 22.2%)
- People over 20 with diabetes: 13.40% — 12 out of 384 metros (US avg: 8.9%)
- Adults in poor or fair health: 20.80% — 14 out of 384 metros (US avg: 12.0%)
- Adults who don’t get enough sleep: 38.50% — 34 out of 384 metros (US avg: 33.0%)
7. Brownsville-Harlingen, Texas
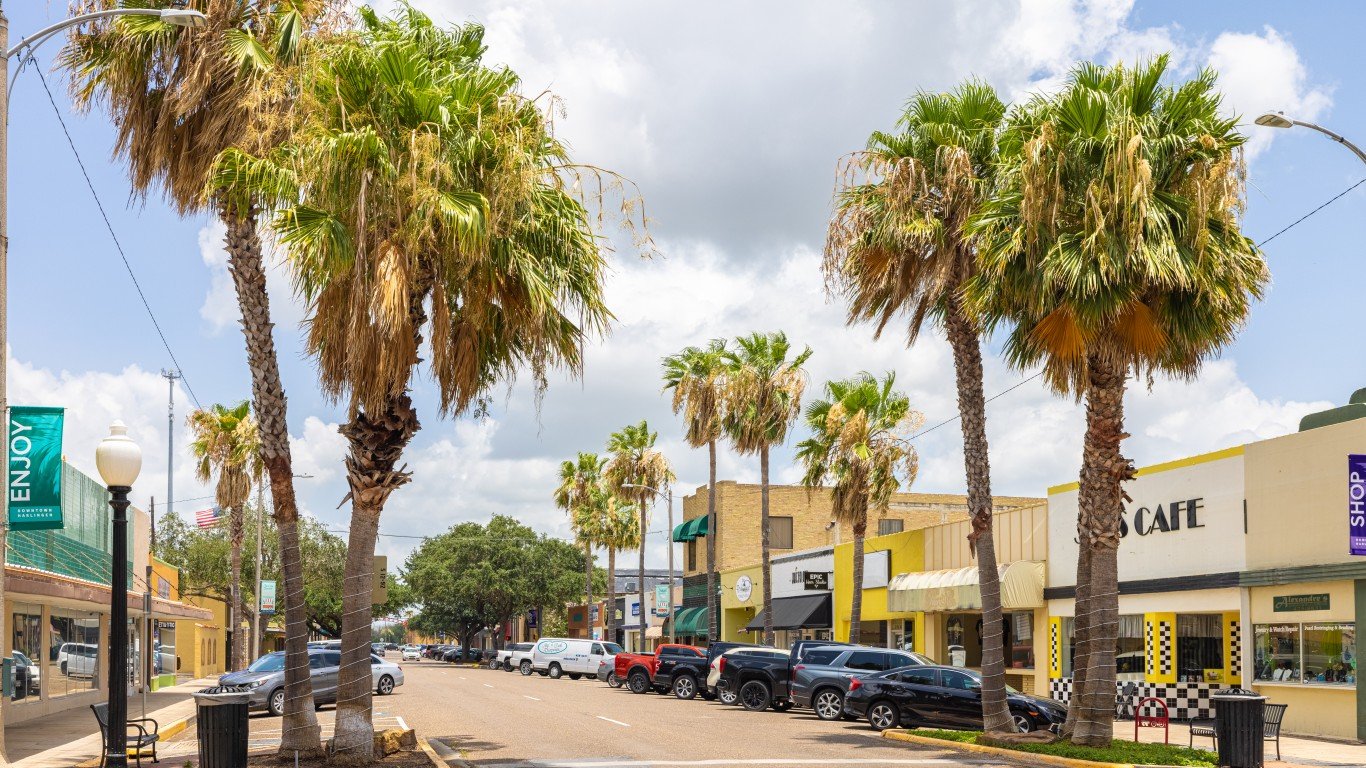
- Obesity rate among adults: 42.70% (US avg: 32.0%)
- Adults who don’t exercise regularly: 33.10% — 5 out of 384 metros (US avg: 22.2%)
- People over 20 with diabetes: 16.90% — 3 out of 384 metros (US avg: 8.9%)
- Adults in poor or fair health: 28.20% — 2 out of 384 metros (US avg: 12.0%)
- Adults who don’t get enough sleep: 32.80% — 265 out of 384 metros (US avg: 33.0%)
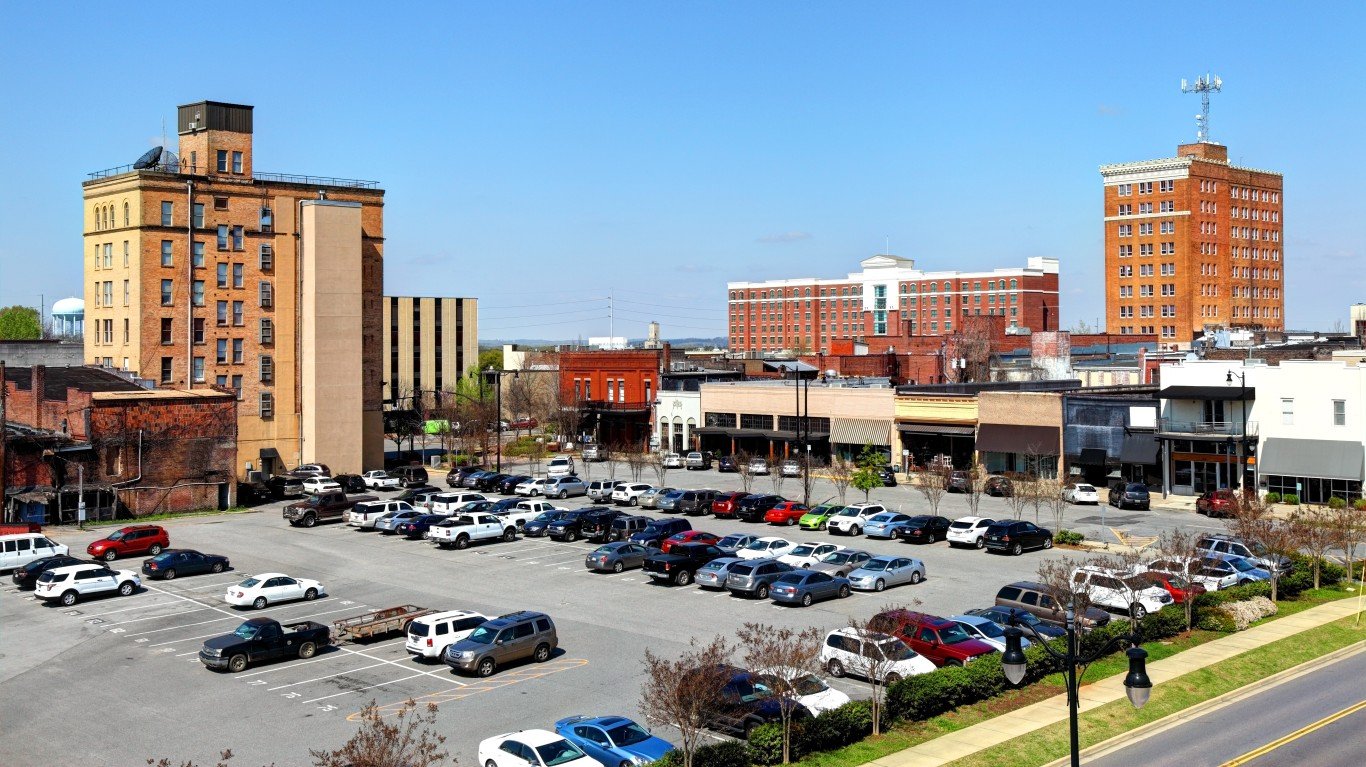
6. Pine Bluff, Arkansas

- Obesity rate among adults: 42.90% (US avg: 32.0%)
- Adults who don’t exercise regularly: 33.70% — 2 out of 384 metros (US avg: 22.2%)
- People over 20 with diabetes: 14.20% — 7 out of 384 metros (US avg: 8.9%)
- Adults in poor or fair health: 22.80% — 6 out of 384 metros (US avg: 12.0%)
- Adults who don’t get enough sleep: 39.90% — 19 out of 384 metros (US avg: 33.0%)
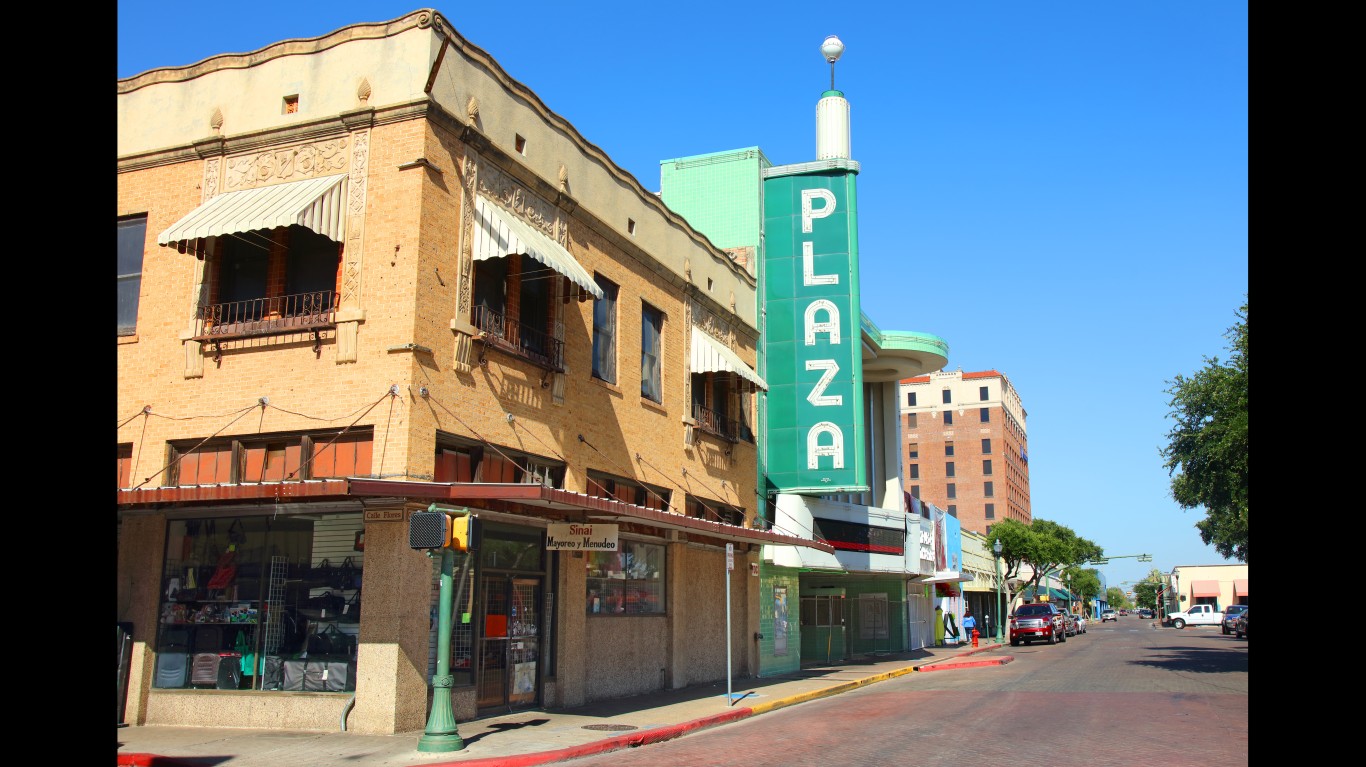
5. McAllen-Edinburg-Mission, Texas

- Obesity rate among adults: 42.90% (US avg: 32.0%)
- Adults who don’t exercise regularly: 33.40% — 4 out of 384 metros (US avg: 22.2%)
- People over 20 with diabetes: 18.80% — 1 out of 384 metros (US avg: 8.9%)
- Adults in poor or fair health: 28.30% — 1 out of 384 metros (US avg: 12.0%)
- Adults who don’t get enough sleep: 34.20% — 202 out of 384 metros (US avg: 33.0%)
4. Saginaw, Michigan
- Obesity rate among adults: 42.90% (US avg: 32.0%)
- Adults who don’t exercise regularly: 23.60% — 193 out of 384 metros (US avg: 22.2%)
- People over 20 with diabetes: 11.30% — 85 out of 384 metros (US avg: 8.9%)
- Adults in poor or fair health: 15.90% — 130 out of 384 metros (US avg: 12.0%)
- Adults who don’t get enough sleep: 37.30% — 61 out of 384 metros (US avg: 33.0%)
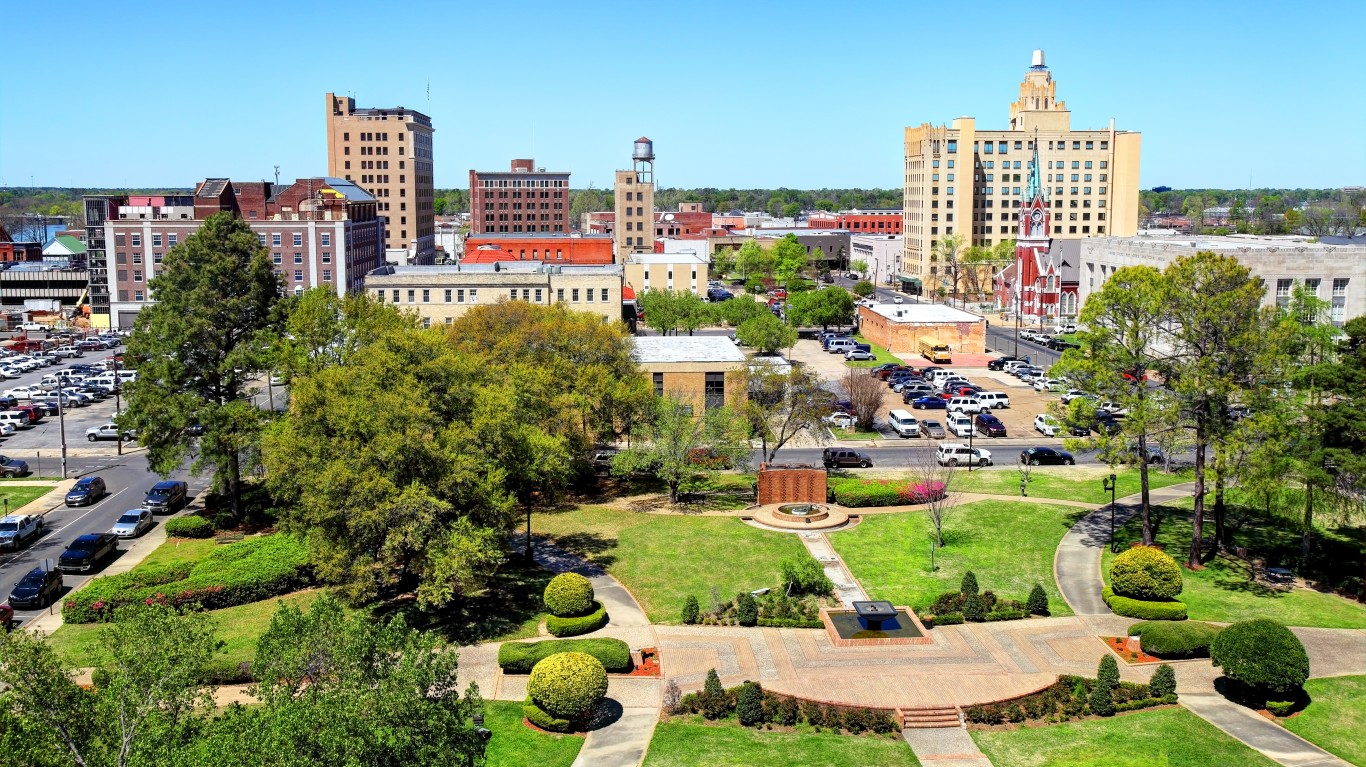
3. Alexandria, Louisiana

- Obesity rate among adults: 43.20% (US avg: 32.0%)
- Adults who don’t exercise regularly: 32.30% — 7 out of 384 metros (US avg: 22.2%)
- People over 20 with diabetes: 12.50% — 30 out of 384 metros (US avg: 8.9%)
- Adults in poor or fair health: 18.60% — 46 out of 384 metros (US avg: 12.0%)
- Adults who don’t get enough sleep: 37.60% — 57 out of 384 metros (US avg: 33.0%)
2. Montgomery, Alabama

- Obesity rate among adults: 44.40% (US avg: 32.0%)
- Adults who don’t exercise regularly: 29.00% — 39 out of 384 metros (US avg: 22.2%)
- People over 20 with diabetes: 13.20% — 13 out of 384 metros (US avg: 8.9%)
- Adults in poor or fair health: 19.10% — 34 out of 384 metros (US avg: 12.0%)
- Adults who don’t get enough sleep: 40.70% — 8 out of 384 metros (US avg: 33.0%)
1. Laredo, Texas
- Obesity rate among adults: 44.60% (US avg: 32.0%)
- Adults who don’t exercise regularly: 38.00% — 1 out of 384 metros (US avg: 22.2%)
- People over 20 with diabetes: 17.00% — 2 out of 384 metros (US avg: 8.9%)
- Adults in poor or fair health: 27.40% — 3 out of 384 metros (US avg: 12.0%)
- Adults who don’t get enough sleep: 37.30% — 63 out of 384 metros (US avg: 33.0%)