Is COVID-19 still a threat to the American population? You wouldn’t think so these days, when almost nobody — and certainly nobody under 65 or so — wears a mask in crowded shops or restaurants, or on planes, trains, or buses. Drug stores and markets are well-stocked with the antiviral wipes and sprays that just a few years back were so rare that people sold them at a premium on eBay, and COVID tests are hidden away on a back shelf, if they’re even still around at all. That six-feet-of-distance rule seems like some relic of the distant past.
Indeed, there’s reason to be optimistic. So many people have had the virus by now and/or have been vaccinated against it that even in its latest, ever-evolving state it’s having a hard time finding vulnerable hosts. But it still finds them, especially among the elderly and immunocompromised.
Wastewater analysis, the most accurate way of determining both symptomatic and asymptomatic cases, reveals continuing high levels of the disease in many parts of the country, and as of Feb. 13, an average of about 20,000 people were still hospitalized with COVID each week — and 2,300 were dying. That’s a far cry from this time three years ago, when about six times that many people were going to the hospital with the virus weekly and almost 10 times as many people were dying — but it’s not nothing.
To determine the states where COVID-19 is the worst right now, 24/7 Tempo consulted data from the CDC on the number of new hospital admissions due to COVID-19 per 100,000 state residents for the week of Feb. 11-Feb. 17, 2024. (Click here to compare this week’s numbers with last week’s.)
The previous week, New Mexico was doing the best of any state, with only 3.2 hospital admissions per 100,000 residents, and Utah came next, with 3.4 admissions. New Mexico has edged up slightly, with 3.3 admissions, while Idaho, with last week’s third-smallest number of admissions (3.8), now has the fewest (2.7). Utah is still the next state up, but its admissions have decreased to 3.0.
At the high end, there’s good news for New York, which had the most admissions of any state last week, at 8.5 per 100,000 residents, but is now No. 9 with 6.6 admissions. The state where the COVID-19 surge is the worst right now, on the other hand, is Alabama, which leapt from 17th place last week with 6.7 admissions to No. 1 this week with 8.5.
Methodology
To determine the states where COVID-19 is the worst right now, 24/7 Tempo reviewed data on recent COVID-19 hospital admissions from the Centers for Disease Control and Prevention. States were ranked based on the number of new hospital admissions due to COVID-19 per 100,000 state residents for the week of Feb 11-Feb. 17, 2024. Supplemental data on the total number of recorded COVID-19 hospital admissions since Aug. 1, 2020; the total number of deaths due to COVID-19 since January 2020; and the COVID-19 test positivity rate for the week of Feb 11-Feb. 17 2024 also came from the CDC. It should be noted that this metric is widely considered to be inaccurate today, due to the closing down of many official testing centers and the fact that the results of home tests are rarely reported. Population data used to adjust hospital admission and death counts per capita came from the U.S. Census Bureau’s Population and Housing Unit Estimates program and is for July 1, 2022.
Here is a list of the states where COVID-19 is the worst right now:
50. Idaho

- New weekly COVID-19 hospital admissions, Feb 11-Feb. 17, 2024: 2.7 per 100,000 (53 total)
- COVID-19 hospital admissions since Aug. 1, 2020: 1,569.1 per 100,000 (12th lowest)
- COVID-19 deaths since January 2020: 294.4 per 100,000 (13th lowest)
- Current COVID-19 test positivity rate: 8.3% (20th highest)
49. Utah

- New weekly COVID-19 hospital admissions, Feb 11-Feb. 17, 2024: 3.0 per 100,000 (100 total)
- COVID-19 hospital admissions since Aug. 1, 2020: 1,501.8 per 100,000 (8th lowest)
- COVID-19 deaths since January 2020: 169.2 per 100,000 (2nd lowest)
- Current COVID-19 test positivity rate: 6.4% (15th lowest)
48. Iowa

- New weekly COVID-19 hospital admissions, Feb 11-Feb. 17, 2024: 3.0 per 100,000 (96 total)
- COVID-19 hospital admissions since Aug. 1, 2020: 1,852.4 per 100,000 (19th lowest)
- COVID-19 deaths since January 2020: 363.0 per 100,000 (25th highest)
- Current COVID-19 test positivity rate: 8.2% (24th highest)
47. New Mexico

- New weekly COVID-19 hospital admissions, Feb 11-Feb. 17, 2024: 3.3 per 100,000 (69 total)
- COVID-19 hospital admissions since Aug. 1, 2020: 1,935.7 per 100,000 (20th lowest)
- COVID-19 deaths since January 2020: 455.3 per 100,000 (5th highest)
- Current COVID-19 test positivity rate: 8.6% (9th highest)
46. Wyoming

- New weekly COVID-19 hospital admissions, Feb 11-Feb. 17, 2024: 3.3 per 100,000 (19 total)
- COVID-19 hospital admissions since Aug. 1, 2020: 2,086.4 per 100,000 (23rd highest)
- COVID-19 deaths since January 2020: 384.9 per 100,000 (18th highest)
- Current COVID-19 test positivity rate: 6.4% (15th lowest)
45. Nevada

- New weekly COVID-19 hospital admissions, Feb 11-Feb. 17, 2024: 3.6 per 100,000 (113 total)
- COVID-19 hospital admissions since Aug. 1, 2020: 2,139.0 per 100,000 (17th highest)
- COVID-19 deaths since January 2020: 384.8 per 100,000 (19th highest)
- Current COVID-19 test positivity rate: 6.3% (9th lowest)
44. Montana

- New weekly COVID-19 hospital admissions, Feb 11-Feb. 17, 2024: 3.6 per 100,000 (40 total)
- COVID-19 hospital admissions since Aug. 1, 2020: 2,854.9 per 100,000 (3rd highest)
- COVID-19 deaths since January 2020: 357.8 per 100,000 (25th lowest)
- Current COVID-19 test positivity rate: 6.4% (15th lowest)
43. Washington

- New weekly COVID-19 hospital admissions, Feb 11-Feb. 17, 2024: 3.6 per 100,000 (282 total)
- COVID-19 hospital admissions since Aug. 1, 2020: 1,080.6 per 100,000 (the lowest)
- COVID-19 deaths since January 2020: 202.7 per 100,000 (4th lowest)
- Current COVID-19 test positivity rate: 8.3% (20th highest)
42. Maine

- New weekly COVID-19 hospital admissions, Feb 11-Feb. 17, 2024: 3.7 per 100,000 (51 total)
- COVID-19 hospital admissions since Aug. 1, 2020: 1,214.6 per 100,000 (4th lowest)
- COVID-19 deaths since January 2020: 255.8 per 100,000 (8th lowest)
- Current COVID-19 test positivity rate: 7.4% (21st lowest)
41. Colorado

- New weekly COVID-19 hospital admissions, Feb 11-Feb. 17, 2024: 3.8 per 100,000 (223 total)
- COVID-19 hospital admissions since Aug. 1, 2020: 1,810.6 per 100,000 (18th lowest)
- COVID-19 deaths since January 2020: 266.3 per 100,000 (9th lowest)
- Current COVID-19 test positivity rate: 6.4% (15th lowest)
40. Oregon

- New weekly COVID-19 hospital admissions, Feb 11-Feb. 17, 2024: 3.9 per 100,000 (165 total)
- COVID-19 hospital admissions since Aug. 1, 2020: 1,213.1 per 100,000 (3rd lowest)
- COVID-19 deaths since January 2020: 230.3 per 100,000 (6th lowest)
- Current COVID-19 test positivity rate: 8.3% (20th highest)
39. Vermont

- New weekly COVID-19 hospital admissions, Feb 11-Feb. 17, 2024: 4.0 per 100,000 (26 total)
- COVID-19 hospital admissions since Aug. 1, 2020: 1,117.5 per 100,000 (2nd lowest)
- COVID-19 deaths since January 2020: 176.0 per 100,000 (3rd lowest)
- Current COVID-19 test positivity rate: 7.4% (21st lowest)
38. Arizona

- New weekly COVID-19 hospital admissions, Feb 11-Feb. 17, 2024: 4.0 per 100,000 (298 total)
- COVID-19 hospital admissions since Aug. 1, 2020: 2,224.5 per 100,000 (13th highest)
- COVID-19 deaths since January 2020: 413.9 per 100,000 (13th highest)
- Current COVID-19 test positivity rate: 6.3% (9th lowest)
37. Kansas
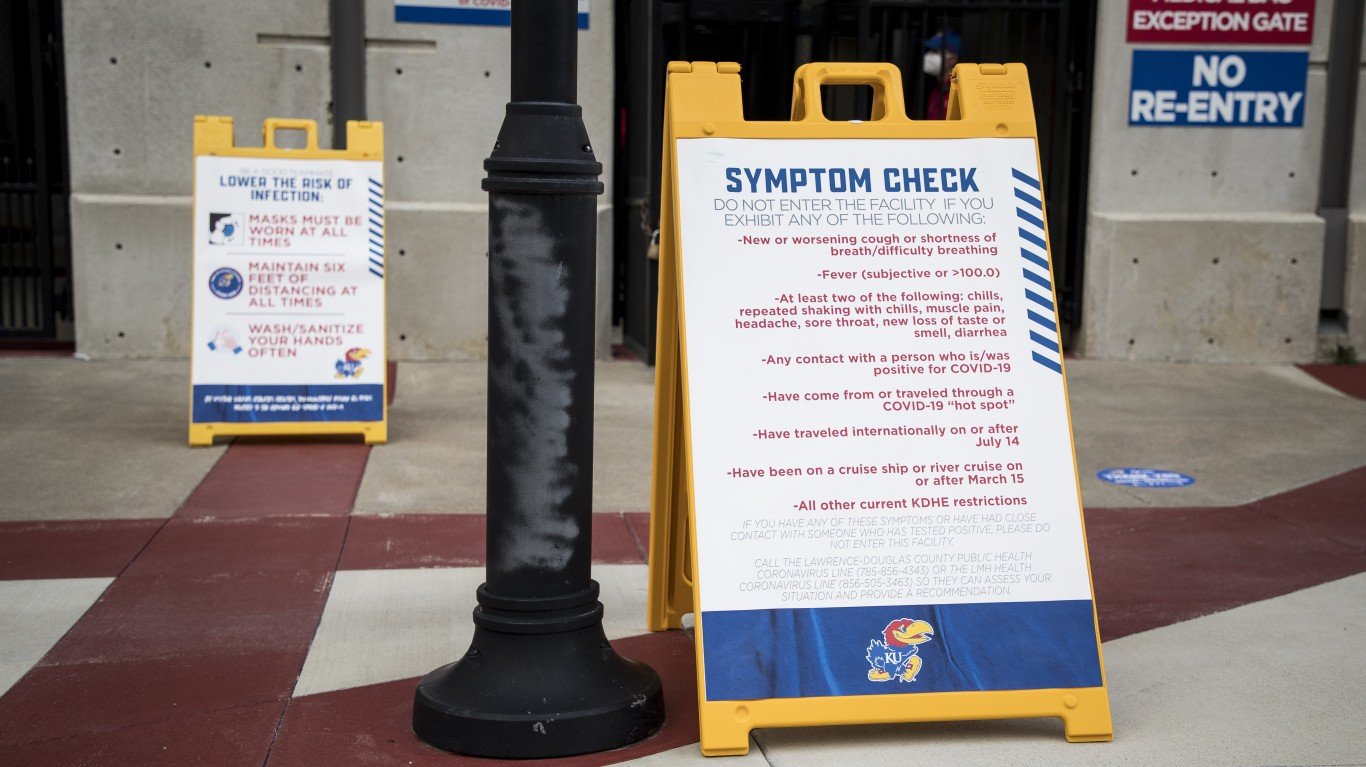
- New weekly COVID-19 hospital admissions, Feb 11-Feb. 17, 2024: 4.1 per 100,000 (121 total)
- COVID-19 hospital admissions since Aug. 1, 2020: 2,092.4 per 100,000 (21st highest)
- COVID-19 deaths since January 2020: 373.2 per 100,000 (23rd highest)
- Current COVID-19 test positivity rate: 8.2% (24th highest)
36. Rhode Island

- New weekly COVID-19 hospital admissions, Feb 11-Feb. 17, 2024: 4.2 per 100,000 (46 total)
- COVID-19 hospital admissions since Aug. 1, 2020: 1,345.6 per 100,000 (5th lowest)
- COVID-19 deaths since January 2020: 375.9 per 100,000 (21st highest)
- Current COVID-19 test positivity rate: 7.4% (21st lowest)
35. Minnesota

- New weekly COVID-19 hospital admissions, Feb 11-Feb. 17, 2024: 4.3 per 100,000 (243 total)
- COVID-19 hospital admissions since Aug. 1, 2020: 1,518.3 per 100,000 (10th lowest)
- COVID-19 deaths since January 2020: 286.1 per 100,000 (11th lowest)
- Current COVID-19 test positivity rate: 8.5% (14th highest)
34. Indiana

- New weekly COVID-19 hospital admissions, Feb 11-Feb. 17, 2024: 4.4 per 100,000 (298 total)
- COVID-19 hospital admissions since Aug. 1, 2020: 2,194.7 per 100,000 (15th highest)
- COVID-19 deaths since January 2020: 394.8 per 100,000 (14th highest)
- Current COVID-19 test positivity rate: 8.5% (14th highest)
33. Nebraska

- New weekly COVID-19 hospital admissions, Feb 11-Feb. 17, 2024: 4.4 per 100,000 (87 total)
- COVID-19 hospital admissions since Aug. 1, 2020: 1,764.2 per 100,000 (17th lowest)
- COVID-19 deaths since January 2020: 304.8 per 100,000 (15th lowest)
- Current COVID-19 test positivity rate: 8.2% (24th highest)
32. Maryland

- New weekly COVID-19 hospital admissions, Feb 11-Feb. 17, 2024: 4.5 per 100,000 (276 total)
- COVID-19 hospital admissions since Aug. 1, 2020: 1,691.3 per 100,000 (14th lowest)
- COVID-19 deaths since January 2020: 307.5 per 100,000 (16th lowest)
- Current COVID-19 test positivity rate: 5.5% (5th lowest)
31. Mississippi

- New weekly COVID-19 hospital admissions, Feb 11-Feb. 17, 2024: 4.6 per 100,000 (136 total)
- COVID-19 hospital admissions since Aug. 1, 2020: 1,997.6 per 100,000 (25th lowest)
- COVID-19 deaths since January 2020: 521.9 per 100,000 (the highest)
- Current COVID-19 test positivity rate: 10.8% (the highest)
30. California

- New weekly COVID-19 hospital admissions, Feb 11-Feb. 17, 2024: 4.8 per 100,000 (1,882 total)
- COVID-19 hospital admissions since Aug. 1, 2020: 1,704.3 per 100,000 (16th lowest)
- COVID-19 deaths since January 2020: 287.4 per 100,000 (12th lowest)
- Current COVID-19 test positivity rate: 6.3% (9th lowest)
29. Ohio

- New weekly COVID-19 hospital admissions, Feb 11-Feb. 17, 2024: 4.8 per 100,000 (570 total)
- COVID-19 hospital admissions since Aug. 1, 2020: 2,395.5 per 100,000 (7th highest)
- COVID-19 deaths since January 2020: 437.9 per 100,000 (7th highest)
- Current COVID-19 test positivity rate: 8.5% (14th highest)
28. New Hampshire
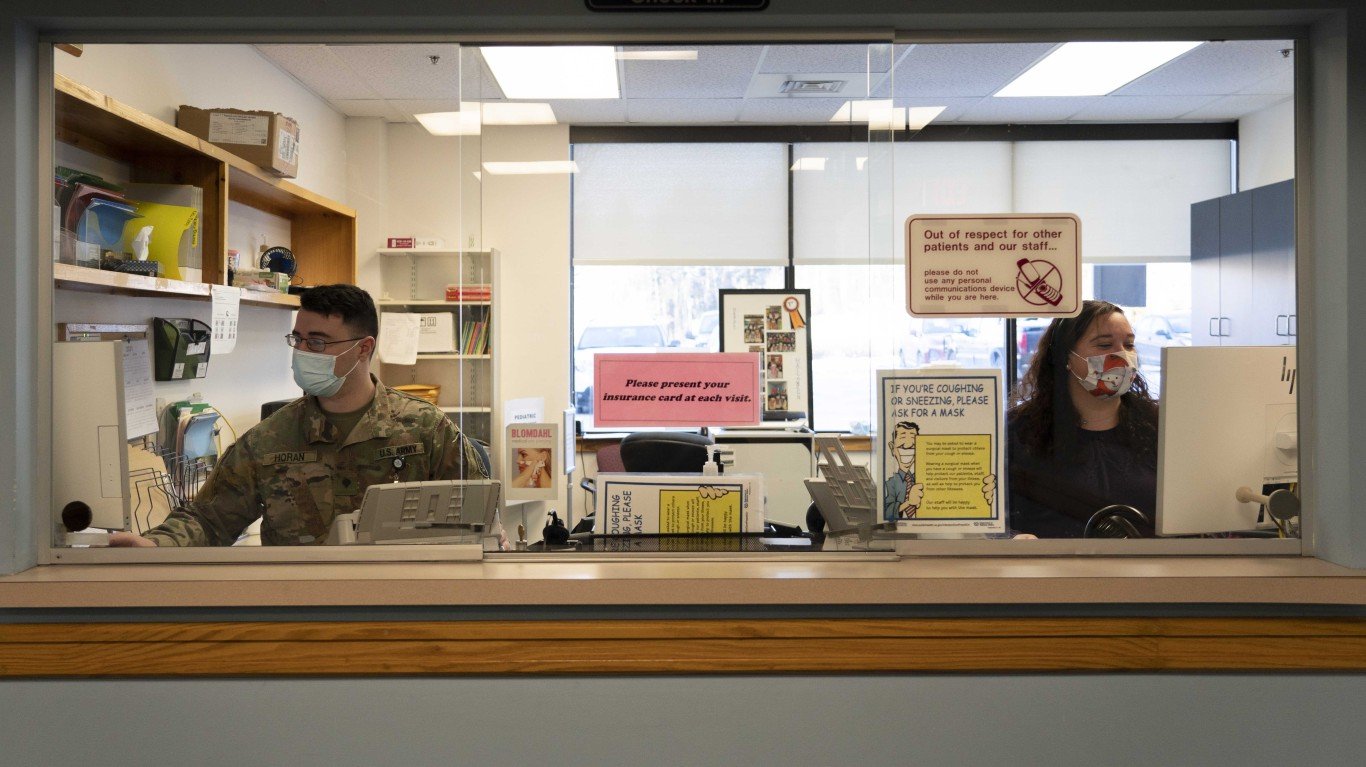
- New weekly COVID-19 hospital admissions, Feb 11-Feb. 17, 2024: 4.9 per 100,000 (68 total)
- COVID-19 hospital admissions since Aug. 1, 2020: 1,451.0 per 100,000 (7th lowest)
- COVID-19 deaths since January 2020: 249.6 per 100,000 (7th lowest)
- Current COVID-19 test positivity rate: 7.4% (21st lowest)
27. Alaska

- New weekly COVID-19 hospital admissions, Feb 11-Feb. 17, 2024: 4.9 per 100,000 (36 total)
- COVID-19 hospital admissions since Aug. 1, 2020: 1,420.2 per 100,000 (6th lowest)
- COVID-19 deaths since January 2020: 212.9 per 100,000 (5th lowest)
- Current COVID-19 test positivity rate: 8.3% (20th highest)
26. North Dakota

- New weekly COVID-19 hospital admissions, Feb 11-Feb. 17, 2024: 5.0 per 100,000 (39 total)
- COVID-19 hospital admissions since Aug. 1, 2020: 2,104.4 per 100,000 (20th highest)
- COVID-19 deaths since January 2020: 348.9 per 100,000 (22nd lowest)
- Current COVID-19 test positivity rate: 6.4% (15th lowest)
25. Wisconsin

- New weekly COVID-19 hospital admissions, Feb 11-Feb. 17, 2024: 5.2 per 100,000 (306 total)
- COVID-19 hospital admissions since Aug. 1, 2020: 2,314.1 per 100,000 (11th highest)
- COVID-19 deaths since January 2020: 302.7 per 100,000 (14th lowest)
- Current COVID-19 test positivity rate: 8.5% (14th highest)
24. Michigan

- New weekly COVID-19 hospital admissions, Feb 11-Feb. 17, 2024: 5.4 per 100,000 (540 total)
- COVID-19 hospital admissions since Aug. 1, 2020: 2,086.8 per 100,000 (22nd highest)
- COVID-19 deaths since January 2020: 390.0 per 100,000 (17th highest)
- Current COVID-19 test positivity rate: 8.5% (14th highest)
23. Massachusetts

- New weekly COVID-19 hospital admissions, Feb 11-Feb. 17, 2024: 5.6 per 100,000 (389 total)
- COVID-19 hospital admissions since Aug. 1, 2020: 1,682.5 per 100,000 (13th lowest)
- COVID-19 deaths since January 2020: 313.5 per 100,000 (17th lowest)
- Current COVID-19 test positivity rate: 7.4% (21st lowest)
22. West Virginia

- New weekly COVID-19 hospital admissions, Feb 11-Feb. 17, 2024: 5.6 per 100,000 (100 total)
- COVID-19 hospital admissions since Aug. 1, 2020: 2,649.3 per 100,000 (5th highest)
- COVID-19 deaths since January 2020: 507.9 per 100,000 (2nd highest)
- Current COVID-19 test positivity rate: 5.5% (5th lowest)
21. Arkansas

- New weekly COVID-19 hospital admissions, Feb 11-Feb. 17, 2024: 5.6 per 100,000 (172 total)
- COVID-19 hospital admissions since Aug. 1, 2020: 2,368.8 per 100,000 (8th highest)
- COVID-19 deaths since January 2020: 425.6 per 100,000 (9th highest)
- Current COVID-19 test positivity rate: 8.6% (9th highest)
20. Illinois

- New weekly COVID-19 hospital admissions, Feb 11-Feb. 17, 2024: 5.7 per 100,000 (719 total)
- COVID-19 hospital admissions since Aug. 1, 2020: 1,992.3 per 100,000 (24th lowest)
- COVID-19 deaths since January 2020: 331.7 per 100,000 (19th lowest)
- Current COVID-19 test positivity rate: 8.5% (14th highest)
19. Tennessee

- New weekly COVID-19 hospital admissions, Feb 11-Feb. 17, 2024: 5.7 per 100,000 (405 total)
- COVID-19 hospital admissions since Aug. 1, 2020: 1,979.6 per 100,000 (23rd lowest)
- COVID-19 deaths since January 2020: 421.1 per 100,000 (11th highest)
- Current COVID-19 test positivity rate: 10.8% (the highest)
18. Missouri

- New weekly COVID-19 hospital admissions, Feb 11-Feb. 17, 2024: 5.8 per 100,000 (360 total)
- COVID-19 hospital admissions since Aug. 1, 2020: 2,300.7 per 100,000 (12th highest)
- COVID-19 deaths since January 2020: 377.6 per 100,000 (20th highest)
- Current COVID-19 test positivity rate: 8.2% (24th highest)
17. Texas

- New weekly COVID-19 hospital admissions, Feb 11-Feb. 17, 2024: 5.8 per 100,000 (1,756 total)
- COVID-19 hospital admissions since Aug. 1, 2020: 2,143.6 per 100,000 (16th highest)
- COVID-19 deaths since January 2020: 347.7 per 100,000 (21st lowest)
- Current COVID-19 test positivity rate: 8.6% (9th highest)
16. Pennsylvania

- New weekly COVID-19 hospital admissions, Feb 11-Feb. 17, 2024: 5.9 per 100,000 (763 total)
- COVID-19 hospital admissions since Aug. 1, 2020: 2,054.2 per 100,000 (24th highest)
- COVID-19 deaths since January 2020: 421.9 per 100,000 (10th highest)
- Current COVID-19 test positivity rate: 5.5% (5th lowest)
15. Oklahoma

- New weekly COVID-19 hospital admissions, Feb 11-Feb. 17, 2024: 5.9 per 100,000 (237 total)
- COVID-19 hospital admissions since Aug. 1, 2020: 2,882.7 per 100,000 (2nd highest)
- COVID-19 deaths since January 2020: 502.9 per 100,000 (3rd highest)
- Current COVID-19 test positivity rate: 8.6% (9th highest)
14. Delaware

- New weekly COVID-19 hospital admissions, Feb 11-Feb. 17, 2024: 6.2 per 100,000 (63 total)
- COVID-19 hospital admissions since Aug. 1, 2020: 2,126.1 per 100,000 (18th highest)
- COVID-19 deaths since January 2020: 355.9 per 100,000 (24th lowest)
- Current COVID-19 test positivity rate: 5.5% (5th lowest)
13. New Jersey

- New weekly COVID-19 hospital admissions, Feb 11-Feb. 17, 2024: 6.3 per 100,000 (585 total)
- COVID-19 hospital admissions since Aug. 1, 2020: 2,043.4 per 100,000 (25th highest)
- COVID-19 deaths since January 2020: 393.1 per 100,000 (16th highest)
- Current COVID-19 test positivity rate: 7.7% (23rd lowest)
12. Kentucky

- New weekly COVID-19 hospital admissions, Feb 11-Feb. 17, 2024: 6.3 per 100,000 (286 total)
- COVID-19 hospital admissions since Aug. 1, 2020: 3,635.5 per 100,000 (the highest)
- COVID-19 deaths since January 2020: 464.7 per 100,000 (4th highest)
- Current COVID-19 test positivity rate: 10.8% (the highest)
11. South Dakota

- New weekly COVID-19 hospital admissions, Feb 11-Feb. 17, 2024: 6.4 per 100,000 (58 total)
- COVID-19 hospital admissions since Aug. 1, 2020: 2,323.3 per 100,000 (9th highest)
- COVID-19 deaths since January 2020: 373.4 per 100,000 (22nd highest)
- Current COVID-19 test positivity rate: 6.4% (15th lowest)
10. Connecticut

- New weekly COVID-19 hospital admissions, Feb 11-Feb. 17, 2024: 6.4 per 100,000 (233 total)
- COVID-19 hospital admissions since Aug. 1, 2020: 1,971.8 per 100,000 (22nd lowest)
- COVID-19 deaths since January 2020: 352.7 per 100,000 (23rd lowest)
- Current COVID-19 test positivity rate: 7.4% (21st lowest)
9. New York

- New weekly COVID-19 hospital admissions, Feb 11-Feb. 17, 2024: 6.6 per 100,000 (1,303 total)
- COVID-19 hospital admissions since Aug. 1, 2020: 2,115.9 per 100,000 (19th highest)
- COVID-19 deaths since January 2020: 425.6 per 100,000 (8th highest)
- Current COVID-19 test positivity rate: 7.7% (23rd lowest)
8. North Carolina

- New weekly COVID-19 hospital admissions, Feb 11-Feb. 17, 2024: 6.6 per 100,000 (711 total)
- COVID-19 hospital admissions since Aug. 1, 2020: 1,698.4 per 100,000 (15th lowest)
- COVID-19 deaths since January 2020: 330.4 per 100,000 (18th lowest)
- Current COVID-19 test positivity rate: 10.8% (the highest)
7. Virginia

- New weekly COVID-19 hospital admissions, Feb 11-Feb. 17, 2024: 6.9 per 100,000 (595 total)
- COVID-19 hospital admissions since Aug. 1, 2020: 1,553.8 per 100,000 (11th lowest)
- COVID-19 deaths since January 2020: 284.6 per 100,000 (10th lowest)
- Current COVID-19 test positivity rate: 5.5% (5th lowest)
6. Hawaii

- New weekly COVID-19 hospital admissions, Feb 11-Feb. 17, 2024: 7.1 per 100,000 (102 total)
- COVID-19 hospital admissions since Aug. 1, 2020: 1,512.4 per 100,000 (9th lowest)
- COVID-19 deaths since January 2020: 143.6 per 100,000 (the lowest)
- Current COVID-19 test positivity rate: 6.3% (9th lowest)
5. Louisiana

- New weekly COVID-19 hospital admissions, Feb 11-Feb. 17, 2024: 7.2 per 100,000 (330 total)
- COVID-19 hospital admissions since Aug. 1, 2020: 2,213.1 per 100,000 (14th highest)
- COVID-19 deaths since January 2020: 394.2 per 100,000 (15th highest)
- Current COVID-19 test positivity rate: 8.6% (9th highest)
4. Florida

- New weekly COVID-19 hospital admissions, Feb 11-Feb. 17, 2024: 7.6 per 100,000 (1,697 total)
- COVID-19 hospital admissions since Aug. 1, 2020: 2,709.7 per 100,000 (4th highest)
- COVID-19 deaths since January 2020: 370.5 per 100,000 (24th highest)
- Current COVID-19 test positivity rate: 10.8% (the highest)
3. South Carolina

- New weekly COVID-19 hospital admissions, Feb 11-Feb. 17, 2024: 7.7 per 100,000 (409 total)
- COVID-19 hospital admissions since Aug. 1, 2020: 1,940.1 per 100,000 (21st lowest)
- COVID-19 deaths since January 2020: 416.1 per 100,000 (12th highest)
- Current COVID-19 test positivity rate: 10.8% (the highest)
2. Georgia

- New weekly COVID-19 hospital admissions, Feb 11-Feb. 17, 2024: 7.9 per 100,000 (863 total)
- COVID-19 hospital admissions since Aug. 1, 2020: 2,318.9 per 100,000 (10th highest)
- COVID-19 deaths since January 2020: 340.3 per 100,000 (20th lowest)
- Current COVID-19 test positivity rate: 10.8% (the highest)
1. Alabama
- New weekly COVID-19 hospital admissions, Feb 11-Feb. 17, 2024: 8.5 per 100,000 (431 total)
- COVID-19 hospital admissions since Aug. 1, 2020: 2,496.3 per 100,000 (6th highest)
- COVID-19 deaths since January 2020: 452.9 per 100,000 (6th highest)
- Current COVID-19 test positivity rate: 10.8% (the highest)
