
MattGush / iStock via Getty Images

Jeff McCollough / iStock via Getty Images

Jacqueline Nix / iStock Editorial via Getty Images


BOB WESTON / iStock via Getty Images

DenisTangneyJr / E+ via Getty Images

MizC / iStock via Getty Images

DenisTangneyJr / E+ via Getty Images


Simplyphotos / iStock via Getty Images


Roberto Galan / iStock Editorial via Getty Images

Roberto Galan / iStock Editorial via Getty Images

harmantasdc / iStock Editorial via Getty Images


DenisTangneyJr / iStock via Getty Images

DenisTangneyJr / iStock via Getty Images


BOB WESTON / iStock via Getty Images

f11photo / iStock via Getty Images

RiverNorthPhotography / iStock via Getty Images

DenisTangneyJr / iStock via Getty Images

DenisTangneyJr / iStock via Getty Images

sbossert / iStock via Getty Images

ChrisBoswell / iStock via Getty Images


Content zilla / Shutterstock.com


chamey / iStock via Getty Images

DenisTangneyJr / E+ via Getty Images

Michael Barera / Getty Images


pabradyphoto / iStock via Getty Images

SeanPavonePhoto / iStock via Getty Images


BOB WESTON / iStock via Getty Images

Public Domain / Wikimedia Commons

DenisTangneyJr / iStock via Getty Images


Sean Pavone / iStock via Getty Images

Lorraine Boogich / iStock via Getty Images


The Deadliest County in Each U.S. State
Since the start of the COVID-19 pandemic, homicide rates have risen significantly in the United States. From 2014 to 2019, annual homicides ranged from 15,775 to 19,393, with an average rate of 5.6 per 100,000 people, according to the National Center for Health Statistics. Between 2020 and 2023, the rate climbed to 7.3 per 100,000, with at least 22,800 reported homicides each year.
There is no single explanation for the increase. Early in the pandemic, school closures and mass layoffs left more adults and teens at home as unemployment surged, contributing to a spike in violence. The rise was particularly pronounced in high-poverty neighborhoods, where economic opportunity and social engagement were already limited.
The growing prevalence of firearms has also played a role. The U.S. Department of Justice reports that 80% of homicides in 2023 involved a firearm, up from 68% in 2014. Gun sales surged during the pandemic, with FBI background checks indicating nearly 22.7 million firearms purchased in 2020 alone. Although sales have declined since then, they remain historically high.
While national trends provide context, violent crime is often driven by local conditions such as poverty, income inequality, housing instability, population density, strained police-community relations, and gang activity. As a result, homicide rates vary widely across the country.
Using data from County Health Rankings and Roadmaps, a program of the University of Wisconsin Population Health Institute, Tempo identified the county with the highest homicide rate in each state. Counties were ranked by average homicide rate using data from 2016 through 2022. The analysis includes 1,425 counties and county equivalents with available data. Supplemental poverty data comes from the U.S. Census Bureau's 2023 American Community Survey. Homicides are defined as deaths resulting from assault.
Among the counties on this list, homicide rates range from 2.4 to 57.4 incidents per 100,000 residents and exceed their respective state averages by as much as 47.5 points.
Many of the counties with the highest homicide rates also have above-average poverty levels, often by more than 5 percentage points compared with the state overall. Still, some counties on the list remain relatively safe by national standards. In states such as New Hampshire and Vermont, even the highest-ranking counties report fewer than three homicides per 100,000 residents annually. Because homicide rates are calculated relative to population, even a single incident in a small community can significantly affect the local rate.
These are the murder capitals of every state.
Why It Matters
The uptick in homicides during the COVID-19 pandemic has been linked to broad national trends, including school closures, surging unemployment, and record-breaking gun sales. Still, rates of deadly violence are also influenced by a wide range of socioeconomic conditions at the local level, including not only unemployment and access to firearms, but also poverty, population density, and community-police relations. As a result, local homicide rates vary considerably across the country, and in every state, certain areas stand out for especially high rates of deadly violence.
Alabama: Lowndes County
- Avg. annual murder rate in county: 46.0 homicides per 100,000 people (5th highest of 1,425 U.S. counties or county equivalents)
- Avg. annual murder rate in state: 12.7 homicides per 100,000 people (3rd highest of the 50 U.S. states)
- Avg. number of homicides per year in county: Approx. 5 (0.7% of homicides statewide)
- Local population: 10,008 (0.2% of state population)
- Poverty rate in county: 29.6% (15.6% statewide)
- Number of counties or county equivalents considered in state: 58
Alaska: Kusilvak Census Area
- Avg. annual murder rate in census area: 27.7 homicides per 100,000 people (32nd highest of 1,425 U.S. counties or county equivalents)
- Avg. annual murder rate in state: 8.6 homicides per 100,000 people (12th highest of the 50 U.S. states)
- Avg. number of homicides per year in census area: Approx. 2 (3.6% of homicides statewide)
- Local population: 8,277 (1.1% of state population)
- Poverty rate in census area: 31.2% (10.2% statewide)
- Number of counties or county equivalents considered in state: 8
Arizona: Apache County
- Avg. annual murder rate in county: 16.9 homicides per 100,000 people (131st highest of 1,425 U.S. counties or county equivalents)
- Avg. annual murder rate in state: 6.7 homicides per 100,000 people (22nd highest of the 50 U.S. states)
- Avg. number of homicides per year in county: Approx. 11 (2.3% of homicides statewide)
- Local population: 65,680 (0.9% of state population)
- Poverty rate in county: 31.2% (12.8% statewide)
- Number of counties or county equivalents considered in state: 14
Arkansas: Phillips County
- Avg. annual murder rate in county: 57.4 homicides per 100,000 people (the highest of 1,425 U.S. counties or county equivalents)
- Avg. annual murder rate in state: 9.9 homicides per 100,000 people (8th highest of the 50 U.S. states)
- Avg. number of homicides per year in county: Approx. 9 (3.0% of homicides statewide)
- Local population: 15,910 (0.5% of state population)
- Poverty rate in county: 28.7% (16.0% statewide)
- Number of counties or county equivalents considered in state: 48
California: Kern County
- Avg. annual murder rate in county: 12.0 homicides per 100,000 people (258th highest of 1,425 U.S. counties or county equivalents)
- Avg. annual murder rate in state: 5.3 homicides per 100,000 people (23rd lowest of the 50 U.S. states)
- Avg. number of homicides per year in county: Approx. 109 (5.2% of homicides statewide)
- Local population: 910,433 (2.3% of state population)
- Poverty rate in county: 19.0% (12.0% statewide)
- Number of counties or county equivalents considered in state: 49
Colorado: Alamosa County
- Avg. annual murder rate in county: 12.1 homicides per 100,000 people (254th highest of 1,425 U.S. counties or county equivalents)
- Avg. annual murder rate in state: 5.2 homicides per 100,000 people (22nd lowest of the 50 U.S. states)
- Avg. number of homicides per year in county: Approx. 2 (0.7% of homicides statewide)
- Local population: 16,515 (0.3% of state population)
- Poverty rate in county: 18.2% (9.4% statewide)
- Number of counties or county equivalents considered in state: 20
Connecticut: Greater Bridgeport Planning Region
- Avg. annual murder rate in planning region: 4.9 homicides per 100,000 people (871st highest of 1,425 U.S. counties or county equivalents)
- Avg. annual murder rate in state: 3.4 homicides per 100,000 people (13th lowest of the 50 U.S. states)
- Avg. number of homicides per year in planning region: Approx. 16 (13.3% of homicides statewide)
- Local population: 326,296 (9.1% of state population)
- Poverty rate in planning region: 13.2% (10.0% statewide)
- Number of counties or county equivalents considered in state: 7
Delaware: New Castle County
- Avg. annual murder rate in county: 8.9 homicides per 100,000 people (433rd highest of 1,425 U.S. counties or county equivalents)
- Avg. annual murder rate in state: 7.1 homicides per 100,000 people (19th highest of the 50 U.S. states)
- Avg. number of homicides per year in county: Approx. 51 (71.9% of homicides statewide)
- Local population: 573,030 (57.0% of state population)
- Poverty rate in county: 10.2% (10.7% statewide)
- Number of counties or county equivalents considered in state: 3
Florida: Hamilton County
- Avg. annual murder rate in county: 21.2 homicides per 100,000 people (73rd highest of 1,425 U.S. counties or county equivalents)
- Avg. annual murder rate in state: 6.4 homicides per 100,000 people (24th highest of the 50 U.S. states)
- Avg. number of homicides per year in county: Approx. 3 (0.2% of homicides statewide)
- Local population: 13,445 (0.1% of state population)
- Poverty rate in county: 27.3% (12.6% statewide)
- Number of counties or county equivalents considered in state: 58
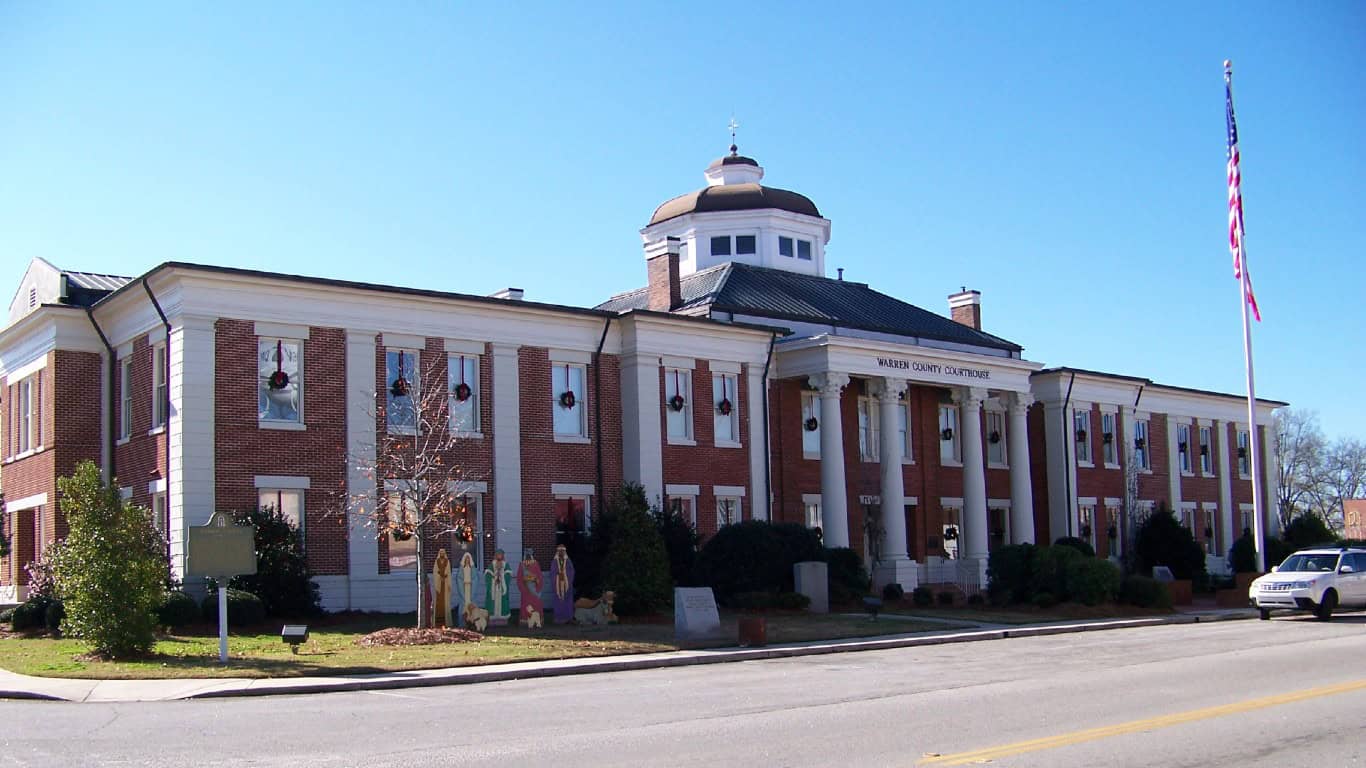
Georgia: Warren County
- Avg. annual murder rate in county: 27.1 homicides per 100,000 people (37th highest of 1,425 U.S. counties or county equivalents)
- Avg. annual murder rate in state: 9.1 homicides per 100,000 people (11th highest of the 50 U.S. states)
- Avg. number of homicides per year in county: Approx. 1 (0.1% of homicides statewide)
- Local population: 5,175 (0.0% of state population)
- Poverty rate in county: 21.8% (13.5% statewide)
- Number of counties or county equivalents considered in state: 87
Hawaii: Hawaii County
- Avg. annual murder rate in county: 3.7 homicides per 100,000 people (1,074th highest of 1,425 U.S. counties or county equivalents)
- Avg. annual murder rate in state: 2.7 homicides per 100,000 people (8th lowest of the 50 U.S. states)
- Avg. number of homicides per year in county: Approx. 8 (19.5% of homicides statewide)
- Local population: 203,684 (14.1% of state population)
- Poverty rate in county: 14.6% (10.0% statewide)
- Number of counties or county equivalents considered in state: 4
Idaho: Bingham County
- Avg. annual murder rate in county: 3.9 homicides per 100,000 people (1,037th highest of 1,425 U.S. counties or county equivalents)
- Avg. annual murder rate in state: 2.2 homicides per 100,000 people (4th lowest of the 50 U.S. states)
- Avg. number of homicides per year in county: Approx. 2 (4.7% of homicides statewide)
- Local population: 48,993 (2.6% of state population)
- Poverty rate in county: 11.0% (10.6% statewide)
- Number of counties or county equivalents considered in state: 9
Illinois: Alexander County
- Avg. annual murder rate in county: 25.0 homicides per 100,000 people (51st highest of 1,425 U.S. counties or county equivalents)
- Avg. annual murder rate in state: 9.4 homicides per 100,000 people (10th highest of the 50 U.S. states)
- Avg. number of homicides per year in county: Approx. 1 (0.1% of homicides statewide)
- Local population: 5,042 (0.0% of state population)
- Poverty rate in county: 21.0% (11.7% statewide)
- Number of counties or county equivalents considered in state: 32
Indiana: Marion County
- Avg. annual murder rate in county: 20.6 homicides per 100,000 people (81st highest of 1,425 U.S. counties or county equivalents)
- Avg. annual murder rate in state: 7.8 homicides per 100,000 people (14th highest of the 50 U.S. states)
- Avg. number of homicides per year in county: Approx. 200 (37.9% of homicides statewide)
- Local population: 971,822 (14.3% of state population)
- Poverty rate in county: 15.1% (12.2% statewide)
- Number of counties or county equivalents considered in state: 38
Iowa: Des Moines County
- Avg. annual murder rate in county: 6.2 homicides per 100,000 people (701st highest of 1,425 U.S. counties or county equivalents)
- Avg. annual murder rate in state: 2.9 homicides per 100,000 people (9th lowest of the 50 U.S. states)
- Avg. number of homicides per year in county: Approx. 2 (2.6% of homicides statewide)
- Local population: 38,597 (1.2% of state population)
- Poverty rate in county: 14.1% (11.0% statewide)
- Number of counties or county equivalents considered in state: 16
Kansas: Wyandotte County
- Avg. annual murder rate in county: 23.9 homicides per 100,000 people (55th highest of 1,425 U.S. counties or county equivalents)
- Avg. annual murder rate in state: 5.7 homicides per 100,000 people (24th lowest of the 50 U.S. states)
- Avg. number of homicides per year in county: Approx. 40 (24.1% of homicides statewide)
- Local population: 167,277 (5.7% of state population)
- Poverty rate in county: 17.5% (11.5% statewide)
- Number of counties or county equivalents considered in state: 15
Kentucky: Jefferson County
- Avg. annual murder rate in county: 17.5 homicides per 100,000 people (123rd highest of 1,425 U.S. counties or county equivalents)
- Avg. annual murder rate in state: 7.2 homicides per 100,000 people (16th highest of the 50 U.S. states)
- Avg. number of homicides per year in county: Approx. 136 (41.8% of homicides statewide)
- Local population: 777,392 (17.2% of state population)
- Poverty rate in county: 14.5% (16.1% statewide)
- Number of counties or county equivalents considered in state: 37
Louisiana: Orleans Parish
- Avg. annual murder rate in parish: 40.6 homicides per 100,000 people (14th highest of 1,425 U.S. counties or county equivalents)
- Avg. annual murder rate in state: 15.9 homicides per 100,000 people (2nd highest of the 50 U.S. states)
- Avg. number of homicides per year in parish: Approx. 153 (20.8% of homicides statewide)
- Local population: 376,035 (8.1% of state population)
- Poverty rate in parish: 22.6% (18.9% statewide)
- Number of counties or county equivalents considered in state: 55
Maine: Washington County
- Avg. annual murder rate in county: 5.0 homicides per 100,000 people (859th highest of 1,425 U.S. counties or county equivalents)
- Avg. annual murder rate in state: 1.6 homicides per 100,000 people (2nd lowest of the 50 U.S. states)
- Avg. number of homicides per year in county: Approx. 2 (7.2% of homicides statewide)
- Local population: 31,261 (2.3% of state population)
- Poverty rate in county: 17.8% (10.8% statewide)
- Number of counties or county equivalents considered in state: 7
Maryland: Baltimore (independent city)
- Avg. annual murder rate in city: 45.5 homicides per 100,000 people (7th highest of 1,425 U.S. counties or county equivalents)
- Avg. annual murder rate in state: 10.0 homicides per 100,000 people (7th highest of the 50 U.S. states)
- Avg. number of homicides per year in city: Approx. 263 (42.7% of homicides statewide)
- Local population: 577,193 (9.4% of state population)
- Poverty rate in city: 20.1% (9.3% statewide)
- Number of counties or county equivalents considered in state: 17
Massachusetts: Suffolk County
- Avg. annual murder rate in county: 5.9 homicides per 100,000 people (748th highest of 1,425 U.S. counties or county equivalents)
- Avg. annual murder rate in state: 2.3 homicides per 100,000 people (6th lowest of the 50 U.S. states)
- Avg. number of homicides per year in county: Approx. 46 (28.4% of homicides statewide)
- Local population: 782,172 (11.2% of state population)
- Poverty rate in county: 16.5% (10.0% statewide)
- Number of counties or county equivalents considered in state: 11
Michigan: Wayne County
- Avg. annual murder rate in county: 18.9 homicides per 100,000 people (100th highest of 1,425 U.S. counties or county equivalents)
- Avg. annual murder rate in state: 6.9 homicides per 100,000 people (20th highest of the 50 U.S. states)
- Avg. number of homicides per year in county: Approx. 335 (48.5% of homicides statewide)
- Local population: 1,773,767 (17.6% of state population)
- Poverty rate in county: 20.1% (13.1% statewide)
- Number of counties or county equivalents considered in state: 27
Minnesota: Beltrami County
- Avg. annual murder rate in county: 6.7 homicides per 100,000 people (632nd highest of 1,425 U.S. counties or county equivalents)
- Avg. annual murder rate in state: 2.9 homicides per 100,000 people (11th lowest of the 50 U.S. states)
- Avg. number of homicides per year in county: Approx. 3 (1.9% of homicides statewide)
- Local population: 46,421 (0.8% of state population)
- Poverty rate in county: 16.0% (9.2% statewide)
- Number of counties or county equivalents considered in state: 16
Mississippi: Leflore County
- Avg. annual murder rate in county: 48.4 homicides per 100,000 people (3rd highest of 1,425 U.S. counties or county equivalents)
- Avg. annual murder rate in state: 16.0 homicides per 100,000 people (the highest of the 50 U.S. states)
- Avg. number of homicides per year in county: Approx. 13 (2.8% of homicides statewide)
- Local population: 27,432 (0.9% of state population)
- Poverty rate in county: 31.9% (19.1% statewide)
- Number of counties or county equivalents considered in state: 70
Missouri: St. Louis (independent city)
- Avg. annual murder rate in city: 50.6 homicides per 100,000 people (2nd highest of 1,425 U.S. counties or county equivalents)
- Avg. annual murder rate in state: 11.0 homicides per 100,000 people (4th highest of the 50 U.S. states)
- Avg. number of homicides per year in city: Approx. 148 (21.8% of homicides statewide)
- Local population: 293,109 (4.8% of state population)
- Poverty rate in city: 19.8% (12.6% statewide)
- Number of counties or county equivalents considered in state: 40
Montana: Big Horn County
- Avg. annual murder rate in county: 23.9 homicides per 100,000 people (56th highest of 1,425 U.S. counties or county equivalents)
- Avg. annual murder rate in state: 4.4 homicides per 100,000 people (19th lowest of the 50 U.S. states)
- Avg. number of homicides per year in county: Approx. 3 (6.4% of homicides statewide)
- Local population: 12,963 (1.2% of state population)
- Poverty rate in county: 23.6% (12.0% statewide)
- Number of counties or county equivalents considered in state: 13
Nebraska: Douglas County
- Avg. annual murder rate in county: 5.5 homicides per 100,000 people (796th highest of 1,425 U.S. counties or county equivalents)
- Avg. annual murder rate in state: 3.1 homicides per 100,000 people (12th lowest of the 50 U.S. states)
- Avg. number of homicides per year in county: Approx. 32 (52.8% of homicides statewide)
- Local population: 585,461 (29.8% of state population)
- Poverty rate in county: 11.2% (10.3% statewide)
- Number of counties or county equivalents considered in state: 3
Nevada: Clark County
- Avg. annual murder rate in county: 7.9 homicides per 100,000 people (510th highest of 1,425 U.S. counties or county equivalents)
- Avg. annual murder rate in state: 7.1 homicides per 100,000 people (18th highest of the 50 U.S. states)
- Avg. number of homicides per year in county: Approx. 181 (81.3% of homicides statewide)
- Local population: 2,293,764 (73.0% of state population)
- Poverty rate in county: 13.2% (12.6% statewide)
- Number of counties or county equivalents considered in state: 6
New Hampshire: Cheshire County
- Avg. annual murder rate in county: 2.4 homicides per 100,000 people (1,260th highest of 1,425 U.S. counties or county equivalents)
- Avg. annual murder rate in state: 1.5 homicides per 100,000 people (the lowest of the 50 U.S. states)
- Avg. number of homicides per year in county: Approx. 2 (8.9% of homicides statewide)
- Local population: 76,945 (5.5% of state population)
- Poverty rate in county: 8.9% (7.2% statewide)
- Number of counties or county equivalents considered in state: 5
New Jersey: Essex County
- Avg. annual murder rate in county: 11.0 homicides per 100,000 people (301st highest of 1,425 U.S. counties or county equivalents)
- Avg. annual murder rate in state: 3.8 homicides per 100,000 people (17th lowest of the 50 U.S. states)
- Avg. number of homicides per year in county: Approx. 94 (26.4% of homicides statewide)
- Local population: 854,130 (9.2% of state population)
- Poverty rate in county: 15.0% (9.8% statewide)
- Number of counties or county equivalents considered in state: 19
New Mexico: McKinley County
- Avg. annual murder rate in county: 20.3 homicides per 100,000 people (84th highest of 1,425 U.S. counties or county equivalents)
- Avg. annual murder rate in state: 10.8 homicides per 100,000 people (5th highest of the 50 U.S. states)
- Avg. number of homicides per year in county: Approx. 14 (6.3% of homicides statewide)
- Local population: 71,172 (3.4% of state population)
- Poverty rate in county: 35.7% (18.1% statewide)
- Number of counties or county equivalents considered in state: 22
New York: Bronx County
- Avg. annual murder rate in county: 7.6 homicides per 100,000 people (550th highest of 1,425 U.S. counties or county equivalents)
- Avg. annual murder rate in state: 3.6 homicides per 100,000 people (16th lowest of the 50 U.S. states)
- Avg. number of homicides per year in county: Approx. 107 (14.8% of homicides statewide)
- Local population: 1,419,250 (7.1% of state population)
- Poverty rate in county: 26.9% (13.7% statewide)
- Number of counties or county equivalents considered in state: 30
North Carolina: Robeson County
- Avg. annual murder rate in county: 27.7 homicides per 100,000 people (31st highest of 1,425 U.S. counties or county equivalents)
- Avg. annual murder rate in state: 7.6 homicides per 100,000 people (15th highest of the 50 U.S. states)
- Avg. number of homicides per year in county: Approx. 32 (4.0% of homicides statewide)
- Local population: 116,858 (1.1% of state population)
- Poverty rate in county: 28.8% (13.2% statewide)
- Number of counties or county equivalents considered in state: 78
North Dakota: Williams County
- Avg. annual murder rate in county: 4.3 homicides per 100,000 people (980th highest of 1,425 U.S. counties or county equivalents)
- Avg. annual murder rate in state: 2.9 homicides per 100,000 people (10th lowest of the 50 U.S. states)
- Avg. number of homicides per year in county: Approx. 2 (7.5% of homicides statewide)
- Local population: 39,368 (5.1% of state population)
- Poverty rate in county: 8.8% (10.6% statewide)
- Number of counties or county equivalents considered in state: 5
Ohio: Cuyahoga County
- Avg. annual murder rate in county: 15.8 homicides per 100,000 people (156th highest of 1,425 U.S. counties or county equivalents)
- Avg. annual murder rate in state: 7.2 homicides per 100,000 people (17th highest of the 50 U.S. states)
- Avg. number of homicides per year in county: Approx. 198 (23.3% of homicides statewide)
- Local population: 1,249,418 (10.6% of state population)
- Poverty rate in county: 16.2% (13.2% statewide)
- Number of counties or county equivalents considered in state: 47
Oklahoma: Choctaw County
- Avg. annual murder rate in county: 18.6 homicides per 100,000 people (104th highest of 1,425 U.S. counties or county equivalents)
- Avg. annual murder rate in state: 8.0 homicides per 100,000 people (13th highest of the 50 U.S. states)
- Avg. number of homicides per year in county: Approx. 3 (0.8% of homicides statewide)
- Local population: 14,299 (0.4% of state population)
- Poverty rate in county: 22.0% (15.3% statewide)
- Number of counties or county equivalents considered in state: 42
Oregon: Josephine County
- Avg. annual murder rate in county: 8.5 homicides per 100,000 people (474th highest of 1,425 U.S. counties or county equivalents)
- Avg. annual murder rate in state: 3.5 homicides per 100,000 people (15th lowest of the 50 U.S. states)
- Avg. number of homicides per year in county: Approx. 7 (5.0% of homicides statewide)
- Local population: 88,069 (2.1% of state population)
- Poverty rate in county: 15.8% (11.9% statewide)
- Number of counties or county equivalents considered in state: 18
Pennsylvania: Philadelphia County
- Avg. annual murder rate in county: 26.1 homicides per 100,000 people (42nd highest of 1,425 U.S. counties or county equivalents)
- Avg. annual murder rate in state: 6.8 homicides per 100,000 people (21st highest of the 50 U.S. states)
- Avg. number of homicides per year in county: Approx. 412 (46.7% of homicides statewide)
- Local population: 1,582,432 (12.2% of state population)
- Poverty rate in county: 22.0% (11.8% statewide)
- Number of counties or county equivalents considered in state: 46
Rhode Island: Providence County
- Avg. annual murder rate in county: 3.2 homicides per 100,000 people (1163rd highest of 1,425 U.S. counties or county equivalents)
- Avg. annual murder rate in state: 2.3 homicides per 100,000 people (5th lowest of the 50 U.S. states)
- Avg. number of homicides per year in county: Approx. 21 (83.1% of homicides statewide)
- Local population: 658,977 (60.2% of state population)
- Poverty rate in county: 13.0% (10.9% statewide)
- Number of counties or county equivalents considered in state: 2
South Carolina: Dillon County
- Avg. annual murder rate in county: 37.8 homicides per 100,000 people (17th highest of 1,425 U.S. counties or county equivalents)
- Avg. annual murder rate in state: 10.4 homicides per 100,000 people (6th highest of the 50 U.S. states)
- Avg. number of homicides per year in county: Approx. 11 (2.0% of homicides statewide)
- Local population: 28,031 (0.5% of state population)
- Poverty rate in county: 29.2% (14.2% statewide)
- Number of counties or county equivalents considered in state: 46
South Dakota: Oglala Lakota County
- Avg. annual murder rate in county: 40.6 homicides per 100,000 people (13th highest of 1,425 U.S. counties or county equivalents)
- Avg. annual murder rate in state: 4.6 homicides per 100,000 people (20th lowest of the 50 U.S. states)
- Avg. number of homicides per year in county: Approx. 6 (13.5% of homicides statewide)
- Local population: 13,587 (1.5% of state population)
- Poverty rate in county: 52.8% (12.0% statewide)
- Number of counties or county equivalents considered in state: 4
Tennessee: Shelby County
- Avg. annual murder rate in county: 28.3 homicides per 100,000 people (28th highest of 1,425 U.S. counties or county equivalents)
- Avg. annual murder rate in state: 9.6 homicides per 100,000 people (9th highest of the 50 U.S. states)
- Avg. number of homicides per year in county: Approx. 261 (38.9% of homicides statewide)
- Local population: 922,195 (13.2% of state population)
- Poverty rate in county: 17.5% (13.8% statewide)
- Number of counties or county equivalents considered in state: 58
Texas: Uvalde County
- Avg. annual murder rate in county: 16.8 homicides per 100,000 people (132nd highest of 1,425 U.S. counties or county equivalents)
- Avg. annual murder rate in state: 6.5 homicides per 100,000 people (23rd highest of the 50 U.S. states)
- Avg. number of homicides per year in county: Approx. 4 (0.2% of homicides statewide)
- Local population: 24,810 (0.1% of state population)
- Poverty rate in county: 21.9% (13.8% statewide)
- Number of counties or county equivalents considered in state: 97
Utah: Uintah County
- Avg. annual murder rate in county: 7.9 homicides per 100,000 people (505th highest of 1,425 U.S. counties or county equivalents)
- Avg. annual murder rate in state: 2.5 homicides per 100,000 people (7th lowest of the 50 U.S. states)
- Avg. number of homicides per year in county: Approx. 3 (3.5% of homicides statewide)
- Local population: 36,458 (1.1% of state population)
- Poverty rate in county: 11.1% (8.6% statewide)
- Number of counties or county equivalents considered in state: 7
Vermont: Rutland County
- Avg. annual murder rate in county: 2.4 homicides per 100,000 people (1,264th highest of 1,425 U.S. counties or county equivalents)
- Avg. annual murder rate in state: 2.0 homicides per 100,000 people (3rd lowest of the 50 U.S. states)
- Avg. number of homicides per year in county: Approx. 1 (11.1% of homicides statewide)
- Local population: 60,484 (9.4% of state population)
- Poverty rate in county: 12.0% (10.3% statewide)
- Number of counties or county equivalents considered in state: 2
Virginia: Petersburg (independent city)
- Avg. annual murder rate in city: 46.0 homicides per 100,000 people (6th highest of 1,425 U.S. counties or county equivalents)
- Avg. annual murder rate in state: 5.9 homicides per 100,000 people (25th highest of the 50 U.S. states)
- Avg. number of homicides per year in city: Approx. 15 (3.0% of homicides statewide)
- Local population: 33,365 (0.4% of state population)
- Poverty rate in city: 21.1% (9.9% statewide)
- Number of counties or county equivalents considered in state: 64
Washington: Yakima County
- Avg. annual murder rate in county: 11.3 homicides per 100,000 people (282nd highest of 1,425 U.S. counties or county equivalents)
- Avg. annual murder rate in state: 3.9 homicides per 100,000 people (18th lowest of the 50 U.S. states)
- Avg. number of homicides per year in county: Approx. 29 (9.7% of homicides statewide)
- Local population: 256,605 (3.3% of state population)
- Poverty rate in county: 15.4% (9.9% statewide)
- Number of counties or county equivalents considered in state: 22
West Virginia: McDowell County
- Avg. annual murder rate in county: 19.0 homicides per 100,000 people (98th highest of 1,425 U.S. counties or county equivalents)
- Avg. annual murder rate in state: 5.9 homicides per 100,000 people (25th lowest of the 50 U.S. states)
- Avg. number of homicides per year in county: Approx. 3 (3.3% of homicides statewide)
- Local population: 18,413 (1.0% of state population)
- Poverty rate in county: 30.9% (16.6% statewide)
- Number of counties or county equivalents considered in state: 21
Wisconsin: Milwaukee County
- Avg. annual murder rate in county: 18.1 homicides per 100,000 people (109th highest of 1,425 U.S. counties or county equivalents)
- Avg. annual murder rate in state: 4.6 homicides per 100,000 people (21st lowest of the 50 U.S. states)
- Avg. number of homicides per year in county: Approx. 168 (62.2% of homicides statewide)
- Local population: 927,656 (15.7% of state population)
- Poverty rate in county: 17.5% (10.6% statewide)
- Number of counties or county equivalents considered in state: 18
Wyoming: Fremont County
- Avg. annual murder rate in county: 7.6 homicides per 100,000 people (547th highest of 1,425 U.S. counties or county equivalents)
- Avg. annual murder rate in state: 3.4 homicides per 100,000 people (14th lowest of the 50 U.S. states)
- Avg. number of homicides per year in county: Approx. 3 (15.0% of homicides statewide)
- Local population: 39,472 (6.8% of state population)
- Poverty rate in county: 12.4% (10.7% statewide)
- Number of counties or county equivalents considered in state: 3