
jovannig / iStock via Getty Images

FPG / Getty Images

Hal Morey / Getty Images

Archive Photos / Getty Images

Michael Ochs Archives / Getty Images

FPG / Getty Images

FPG / Getty Images

FPG / Getty Images

MPI / Getty Images

FPG / Getty Images

Ben Shahn / Getty Images

Kurt Hutton / Getty Images

Archive Photos / Getty Images

Archive Photos / Getty Images

Michael Ochs Archives / Getty Images

Archive Photos / Getty Images

FPG / Getty Images

Frederic Lewis / Getty Images

Archive Photos / Getty Images

Michael Ochs Archives / Getty Images

Archive Photos / Getty Images

Archive Photos / Getty Images

James W. Welgos / Getty Images

Archive Photos / Getty Images

Graphic House / Getty Images

Michael Ochs Archives / Getty Images

Archive Photos / Getty Images

Michael Ochs Archives / Getty Images

Phil Burchman / Getty Images

Michael Ochs Archives / Getty Images

Michael Ochs Archives / Getty Images

Archive Photos / Getty Images

Harvey Meston / Getty Images

Express / Getty Images

Michael Ochs Archives / Getty Images

Michael Ochs Archives / Getty Images

Archive Photos / Getty Images

Harvey Meston / Getty Images

Archive Photos / Getty Images

Michael Ochs Archives / Getty Images

Evening Standard / Getty Images

Michael Ochs Archives / Getty Images
Harvey Meston / Getty Images

Space Frontiers / Getty Images

Archive Photos / Getty Images

Michael Ochs Archives / Getty Images

Pictorial Parade / Getty Images

Archive Photos / Getty Images

Keystone / Getty Images

Michael Ochs Archives / Getty Images

Space Frontiers / Getty Images

Tony Duffy / Getty Images

FPG / Getty Images

Gene Forte / Getty Images

Hulton Archive / Getty Images

Tony Duffy / Getty Images

Michael Ochs Archives / Getty Images

Space Frontiers / Getty Images

Getty Images / Staff

Rick Stewart / Getty Images

Getty Images / Staff

Pascal Rondeau / Getty Images

Space Frontiers / Getty Images

Public Domain / Wikimedia Commons

Public Domain / Wikimedia Commons

Public Domain / Wikimedia Commons

Phil Cole / Getty Images

Public Domain / Wikimedia Commons

Jeff J Mitchell / Getty Images

Doug Pensinger / Getty Images

Space Frontiers / Getty Images

USAF / Getty Images

NASA / Getty Images

Mark Wilson / Getty Images

Mark Wilson / Getty Images

Scott Barbour / Getty Images

Chris Jackson / Getty Images

Public Domain / Wikimedia Commons

Wathiq Khuzaie / Getty Images

David Paul Morris / Getty Images

Spencer Platt / Getty Images

Alex Wong / Getty Images

Chris Graythen / Getty Images

Majid Saeedi / Getty Images

Peter Macdiarmid / Getty Images

Michael Buckner / Getty Images

Sean Gallup / Getty Images

NASA / Getty Images

Scott Olson / Getty Images

NASA / Getty Images

Justin Sullivan / Getty Images

Anthony Kwan / Getty Images

flyparade / Getty Images


What Gas Cost the Year You Were Born (1929–2020)
Gas prices are one of the most visible indicators of inflation in the United States, and they can change quickly depending on global events, oil production, and consumer demand. Because gasoline is such an everyday expense, even small increases can have a noticeable impact on household budgets.
Americans began paying closer attention to gas prices after the Arab oil embargo of 1973–74, when the average price of gasoline jumped from about 34 cents to 84 cents per gallon and fuel shortages led to rationing in many states. Since then, prices have continued to fluctuate. Gas first topped $1 per gallon in 1980, rose above $2 in 2005, and crossed $3 for the first time in 2008.
Many factors influence the price drivers see at the pump. Oil production, refining capacity, global supply and demand, transportation costs, and even financial market activity can all play a role in determining how much gasoline costs in any given year.
Methodology:
To determine the average cost of gasoline each year since 1929, we reviewed historical data from the U.S. Department of Energy's Office of Energy Efficiency & Renewable Energy and the U.S. Energy Information Administration (EIA).
For the average U.S. gasoline price from 1929 through 1993, we used the Average Historical Annual Gasoline Pump Price report published by the Office of Energy Efficiency & Renewable Energy. Prices from 1994 through 2020 were sourced from the EIA's historical annual gasoline price data.
Additional data on annual U.S. gas consumption, oil production, crude oil imports, and the average price of a barrel of oil also came from the EIA. Per-capita gasoline consumption figures were calculated using historical U.S. Census Bureau population data compiled by USAFacts.org. Inflation adjustments were made using the Bureau of Labor Statistics' Consumer Price Index, with all prices converted to 2015 dollars.
1929
- Avg. U.S. gas prices per gallon (inflation adj.): $0.21 ($3.59 — 23. highest since 1929)
- U.S. gas consumption: N/A
- Per capita gas consumption: N/A
- Price of a barrel of oil (inflation adj.): $1.30 ($21.74 — 81. highest since 1929)
- U.S. oil production: 1.0 billion barrels — 88. most since 1929
1930
- Avg. U.S. gas prices per gallon (inflation adj.): $0.20 ($3.50 — 26. highest since 1929)
- U.S. gas consumption: N/A
- Per capita gas consumption: N/A
- Price of a barrel of oil (inflation adj.): $1.20 ($20.85 — 86. highest since 1929)
- U.S. oil production: 898.0 million barrels — 92. most since 1929
1931
- Avg. U.S. gas prices per gallon (inflation adj.): $0.17 ($3.27 — 37. highest since 1929)
- U.S. gas consumption: N/A
- Per capita gas consumption: N/A
- Price of a barrel of oil (inflation adj.): $0.70 ($12.51 — 94. highest since 1929)
- U.S. oil production: 851.1 million barrels — 93. most since 1929
1932
- Avg. U.S. gas prices per gallon (inflation adj.): $0.18 ($3.85 — 17. highest since 1929)
- U.S. gas consumption: N/A
- Per capita gas consumption: N/A
- Price of a barrel of oil (inflation adj.): $0.90 ($18.58 — 92. highest since 1929)
- U.S. oil production: 785.2 million barrels — 94. most since 1929
1933
- Avg. U.S. gas prices per gallon (inflation adj.): $0.18 ($4.05 — 13. highest since 1929)
- U.S. gas consumption: N/A
- Per capita gas consumption: N/A
- Price of a barrel of oil (inflation adj.): $0.70 ($15.08 — 93. highest since 1929)
- U.S. oil production: 905.7 million barrels — 91. most since 1929
1934
- Avg. U.S. gas prices per gallon (inflation adj.): $0.19 ($4.15 — 9. highest since 1929)
- U.S. gas consumption: N/A
- Per capita gas consumption: N/A
- Price of a barrel of oil (inflation adj.): $1.00 ($21.84 — 80. highest since 1929)
- U.S. oil production: 908.1 million barrels — 90. most since 1929
1935
- Avg. U.S. gas prices per gallon (inflation adj.): $0.19 ($4.06 — 12. highest since 1929)
- U.S. gas consumption: N/A
- Per capita gas consumption: N/A
- Price of a barrel of oil (inflation adj.): $1.00 ($20.72 — 87. highest since 1929)
- U.S. oil production: 993.9 million barrels — 89. most since 1929
1936
- Avg. U.S. gas prices per gallon (inflation adj.): $0.19 ($4.00 — 15. highest since 1929)
- U.S. gas consumption: N/A
- Per capita gas consumption: N/A
- Price of a barrel of oil (inflation adj.): $1.10 ($22.95 — 78. highest since 1929)
- U.S. oil production: 1.1 billion barrels — 87. most since 1929
1937
- Avg. U.S. gas prices per gallon (inflation adj.): $0.20 ($4.06 — 10. highest since 1929)
- U.S. gas consumption: N/A
- Per capita gas consumption: N/A
- Price of a barrel of oil (inflation adj.): $1.20 ($23.98 — 75. highest since 1929)
- U.S. oil production: 1.3 billion barrels — 84. most since 1929
1938
- Avg. U.S. gas prices per gallon (inflation adj.): $0.20 ($4.15 — 8. highest since 1929)
- U.S. gas consumption: N/A
- Per capita gas consumption: N/A
- Price of a barrel of oil (inflation adj.): $1.10 ($23.45 — 77. highest since 1929)
- U.S. oil production: 1.2 billion barrels — 86. most since 1929
1939
- Avg. U.S. gas prices per gallon (inflation adj.): $0.19 ($4.00 — 15. highest since 1929)
- U.S. gas consumption: N/A
- Per capita gas consumption: N/A
- Price of a barrel of oil (inflation adj.): $1.00 ($21.48 — 82. highest since 1929)
- U.S. oil production: 1.3 billion barrels — 85. most since 1929
1940
- Avg. U.S. gas prices per gallon (inflation adj.): $0.18 ($3.76 — 21. highest since 1929)
- U.S. gas consumption: N/A
- Per capita gas consumption: N/A
- Price of a barrel of oil (inflation adj.): $1.00 ($21.32 — 84. highest since 1929)
- U.S. oil production: 1.5 billion barrels — 81. most since 1929
1941
- Avg. U.S. gas prices per gallon (inflation adj.): $0.19 ($3.78 — 20. highest since 1929)
- U.S. gas consumption: N/A
- Per capita gas consumption: N/A
- Price of a barrel of oil (inflation adj.): $1.10 ($22.70 — 79. highest since 1929)
- U.S. oil production: 1.4 billion barrels — 82. most since 1929
1942
- Avg. U.S. gas prices per gallon (inflation adj.): $0.20 ($3.59 — 24. highest since 1929)
- U.S. gas consumption: N/A
- Per capita gas consumption: N/A
- Price of a barrel of oil (inflation adj.): $1.20 ($21.37 — 83. highest since 1929)
- U.S. oil production: 1.4 billion barrels — 83. most since 1929
1943
- Avg. U.S. gas prices per gallon (inflation adj.): $0.21 ($3.55 — 25. highest since 1929)
- U.S. gas consumption: N/A
- Per capita gas consumption: N/A
- Price of a barrel of oil (inflation adj.): $1.20 ($20.30 — 88. highest since 1929)
- U.S. oil production: 1.5 billion barrels — 80. most since 1929
1944
- Avg. U.S. gas prices per gallon (inflation adj.): $0.21 ($3.49 — 27. highest since 1929)
- U.S. gas consumption: N/A
- Per capita gas consumption: N/A
- Price of a barrel of oil (inflation adj.): $1.20 ($20.12 — 89. highest since 1929)
- U.S. oil production: 1.7 billion barrels — 79. most since 1929
1945
- Avg. U.S. gas prices per gallon (inflation adj.): $0.21 ($3.41 — 30. highest since 1929)
- U.S. gas consumption: 24.3 billion gallons — 78. most since 1945
- Per capita gas consumption: 173.9 gallons — 78. most since 1945
- Price of a barrel of oil (inflation adj.): $1.20 ($19.84 — 90. highest since 1929)
- U.S. oil production: 1.7 billion barrels — 78. most since 1929
1946
- Avg. U.S. gas prices per gallon (inflation adj.): $0.21 ($3.15 — 45. highest since 1929)
- U.S. gas consumption: 30.3 billion gallons — 77. most since 1945
- Per capita gas consumption: 214.6 gallons — 77. most since 1945
- Price of a barrel of oil (inflation adj.): $1.40 ($21.16 — 85. highest since 1929)
- U.S. oil production: 1.7 billion barrels — 77. most since 1929
1947
- Avg. U.S. gas prices per gallon (inflation adj.): $0.23 ($3.02 — 57. highest since 1929)
- U.S. gas consumption: 32.5 billion gallons — 76. most since 1945
- Per capita gas consumption: 225.4 gallons — 76. most since 1945
- Price of a barrel of oil (inflation adj.): $1.90 ($25.33 — 70. highest since 1929)
- U.S. oil production: 1.9 billion barrels — 72. most since 1929
1948
- Avg. U.S. gas prices per gallon (inflation adj.): $0.26 ($3.16 — 43. highest since 1929)
- U.S. gas consumption: 35.1 billion gallons — 75. most since 1945
- Per capita gas consumption: 239 gallons — 75. most since 1945
- Price of a barrel of oil (inflation adj.): $2.60 ($31.57 — 44. highest since 1929)
- U.S. oil production: 2.0 billion barrels — 66. most since 1929
1949
- Avg. U.S. gas prices per gallon (inflation adj.): $0.27 ($3.32 — 33. highest since 1929)
- U.S. gas consumption: 36.9 billion gallons — 74. most since 1945
- Per capita gas consumption: 247.7 gallons — 74. most since 1945
- Price of a barrel of oil (inflation adj.): $2.50 ($31.23 — 46. highest since 1929)
- U.S. oil production: 1.8 billion barrels — 75. most since 1929
1950
- Avg. U.S. gas prices per gallon (inflation adj.): $0.27 ($3.28 — 35. highest since 1929)
- U.S. gas consumption: 40.1 billion gallons — 73. most since 1945
- Per capita gas consumption: 263.3 gallons — 73. most since 1945
- Price of a barrel of oil (inflation adj.): $2.50 ($30.48 — 49. highest since 1929)
- U.S. oil production: 2.0 billion barrels — 69. most since 1929
1951
- Avg. U.S. gas prices per gallon (inflation adj.): $0.27 ($3.04 — 53. highest since 1929)
- U.S. gas consumption: 45.8 billion gallons — 71. most since 1945
- Per capita gas consumption: 295.5 gallons — 71. most since 1945
- Price of a barrel of oil (inflation adj.): $2.50 ($28.48 — 56. highest since 1929)
- U.S. oil production: 2.2 billion barrels — 59. most since 1929
1952
- Avg. U.S. gas prices per gallon (inflation adj.): $0.27 ($2.98 — 61. highest since 1929)
- U.S. gas consumption: 45.4 billion gallons — 72. most since 1945
- Per capita gas consumption: 288.2 gallons — 72. most since 1945
- Price of a barrel of oil (inflation adj.): $2.50 ($27.94 — 61. highest since 1929)
- U.S. oil production: 2.3 billion barrels — 57. most since 1929
1953
- Avg. U.S. gas prices per gallon (inflation adj.): $0.29 ($3.18 — 41. highest since 1929)
- U.S. gas consumption: 47.7 billion gallons — 70. most since 1945
- Per capita gas consumption: 297.6 gallons — 70. most since 1945
- Price of a barrel of oil (inflation adj.): $2.70 ($29.38 — 53. highest since 1929)
- U.S. oil production: 2.4 billion barrels — 54. most since 1929
1954
- Avg. U.S. gas prices per gallon (inflation adj.): $0.29 ($3.16 — 44. highest since 1929)
- U.S. gas consumption: 49.0 billion gallons — 69. most since 1945
- Per capita gas consumption: 300.3 gallons — 69. most since 1945
- Price of a barrel of oil (inflation adj.): $2.80 ($30.24 — 51. highest since 1929)
- U.S. oil production: 2.3 billion barrels — 56. most since 1929
1955
- Avg. U.S. gas prices per gallon (inflation adj.): $0.29 ($3.17 — 42. highest since 1929)
- U.S. gas consumption: 53.1 billion gallons — 68. most since 1945
- Per capita gas consumption: 320 gallons — 68. most since 1945
- Price of a barrel of oil (inflation adj.): $2.80 ($30.25 — 50. highest since 1929)
- U.S. oil production: 2.5 billion barrels — 48. most since 1929
1956
- Avg. U.S. gas prices per gallon (inflation adj.): $0.30 ($3.23 — 39. highest since 1929)
- U.S. gas consumption: 54.5 billion gallons — 67. most since 1945
- Per capita gas consumption: 322.9 gallons — 66. most since 1945
- Price of a barrel of oil (inflation adj.): $2.80 ($30.02 — 52. highest since 1929)
- U.S. oil production: 2.6 billion barrels — 43. most since 1929
1957
- Avg. U.S. gas prices per gallon (inflation adj.): $0.31 ($3.23 — 38. highest since 1929)
- U.S. gas consumption: 55.4 billion gallons — 66. most since 1945
- Per capita gas consumption: 322.2 gallons — 67. most since 1945
- Price of a barrel of oil (inflation adj.): $3.10 ($32.18 — 43. highest since 1929)
- U.S. oil production: 2.6 billion barrels — 44. most since 1929
1958
- Avg. U.S. gas prices per gallon (inflation adj.): $0.30 ($3.04 — 54. highest since 1929)
- U.S. gas consumption: 56.9 billion gallons — 65. most since 1945
- Per capita gas consumption: 325.3 gallons — 65. most since 1945
- Price of a barrel of oil (inflation adj.): $3.00 ($30.48 — 48. highest since 1929)
- U.S. oil production: 2.4 billion barrels — 49. most since 1929
1959
- Avg. U.S. gas prices per gallon (inflation adj.): $0.31 ($3.12 — 47. highest since 1929)
- U.S. gas consumption: 59.2 billion gallons — 64. most since 1945
- Per capita gas consumption: 332.7 gallons — 64. most since 1945
- Price of a barrel of oil (inflation adj.): $2.90 ($29.16 — 54. highest since 1929)
- U.S. oil production: 2.6 billion barrels — 46. most since 1929
1960
- Avg. U.S. gas prices per gallon (inflation adj.): $0.31 ($3.06 — 51. highest since 1929)
- U.S. gas consumption: 61.0 billion gallons — 63. most since 1945
- Per capita gas consumption: 337.7 gallons — 62. most since 1945
- Price of a barrel of oil (inflation adj.): $2.90 ($28.47 — 57. highest since 1929)
- U.S. oil production: 2.6 billion barrels — 45. most since 1929
1961
- Avg. U.S. gas prices per gallon (inflation adj.): $0.31 ($3.03 — 56. highest since 1929)
- U.S. gas consumption: 62.0 billion gallons — 62. most since 1945
- Per capita gas consumption: 337.4 gallons — 63. most since 1945
- Price of a barrel of oil (inflation adj.): $2.90 ($28.29 — 58. highest since 1929)
- U.S. oil production: 2.6 billion barrels — 42. most since 1929
1962
- Avg. U.S. gas prices per gallon (inflation adj.): $0.31 ($3.00 — 59. highest since 1929)
- U.S. gas consumption: 64.4 billion gallons — 61. most since 1945
- Per capita gas consumption: 345.1 gallons — 61. most since 1945
- Price of a barrel of oil (inflation adj.): $2.90 ($28.10 — 59. highest since 1929)
- U.S. oil production: 2.7 billion barrels — 40. most since 1929
1963
- Avg. U.S. gas prices per gallon (inflation adj.): $0.30 ($2.87 — 66. highest since 1929)
- U.S. gas consumption: 66.4 billion gallons — 60. most since 1945
- Per capita gas consumption: 351.1 gallons — 60. most since 1945
- Price of a barrel of oil (inflation adj.): $2.90 ($27.64 — 62. highest since 1929)
- U.S. oil production: 2.8 billion barrels — 36. most since 1929
1964
- Avg. U.S. gas prices per gallon (inflation adj.): $0.30 ($2.83 — 68. highest since 1929)
- U.S. gas consumption: 67.7 billion gallons — 59. most since 1945
- Per capita gas consumption: 352.7 gallons — 59. most since 1945
- Price of a barrel of oil (inflation adj.): $2.90 ($27.19 — 64. highest since 1929)
- U.S. oil production: 2.8 billion barrels — 34. most since 1929
1965
- Avg. U.S. gas prices per gallon (inflation adj.): $0.31 ($2.88 — 65. highest since 1929)
- U.S. gas consumption: 70.4 billion gallons — 58. most since 1945
- Per capita gas consumption: 362.3 gallons — 58. most since 1945
- Price of a barrel of oil (inflation adj.): $2.90 ($26.57 — 65. highest since 1929)
- U.S. oil production: 2.8 billion barrels — 33. most since 1929
1966
- Avg. U.S. gas prices per gallon (inflation adj.): $0.32 ($2.89 — 64. highest since 1929)
- U.S. gas consumption: 73.7 billion gallons — 57. most since 1945
- Per capita gas consumption: 375 gallons — 56. most since 1945
- Price of a barrel of oil (inflation adj.): $2.90 ($26.01 — 67. highest since 1929)
- U.S. oil production: 3.0 billion barrels — 29. most since 1929
1967
- Avg. U.S. gas prices per gallon (inflation adj.): $0.33 ($2.89 — 63. highest since 1929)
- U.S. gas consumption: 76.0 billion gallons — 56. most since 1945
- Per capita gas consumption: 382.5 gallons — 55. most since 1945
- Price of a barrel of oil (inflation adj.): $2.90 ($25.59 — 69. highest since 1929)
- U.S. oil production: 3.2 billion barrels — 17. most since 1929
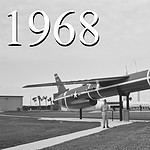
1968
- Avg. U.S. gas prices per gallon (inflation adj.): $0.34 ($2.86 — 67. highest since 1929)
- U.S. gas consumption: 80.9 billion gallons — 55. most since 1945
- Per capita gas consumption: 402.9 gallons — 54. most since 1945
- Price of a barrel of oil (inflation adj.): $2.90 ($24.72 — 71. highest since 1929)
- U.S. oil production: 3.3 billion barrels — 13. most since 1929
1969
- Avg. U.S. gas prices per gallon (inflation adj.): $0.35 ($2.79 — 70. highest since 1929)
- U.S. gas consumption: 84.7 billion gallons — 54. most since 1945
- Per capita gas consumption: 418 gallons — 51. most since 1945
- Price of a barrel of oil (inflation adj.): $3.10 ($24.64 — 72. highest since 1929)
- U.S. oil production: 3.4 billion barrels — 11. most since 1929
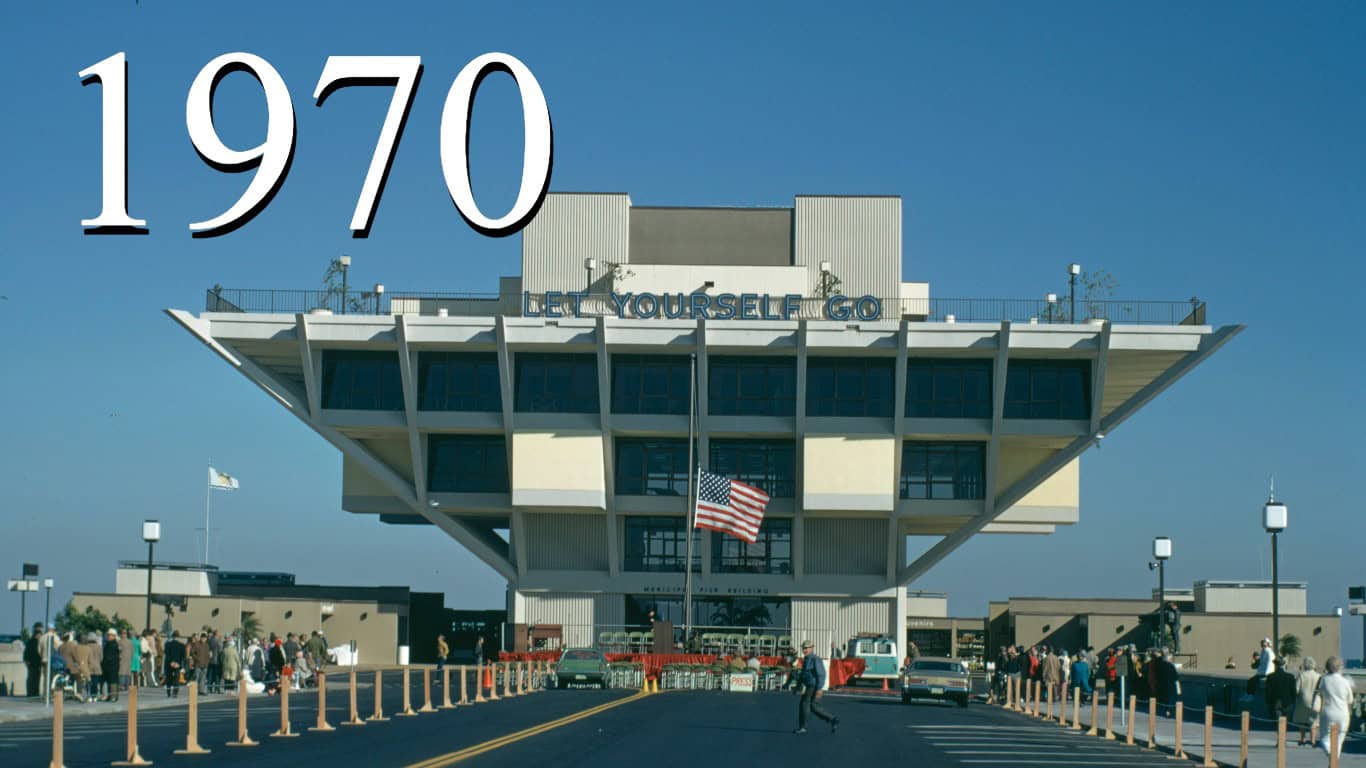
1970
- Avg. U.S. gas prices per gallon (inflation adj.): $0.36 ($2.72 — 72. highest since 1929)
- U.S. gas consumption: 88.7 billion gallons — 53. most since 1945
- Per capita gas consumption: 432.5 gallons — 46. most since 1945
- Price of a barrel of oil (inflation adj.): $3.20 ($23.99 — 74. highest since 1929)
- U.S. oil production: 3.5 billion barrels — 6. most since 1929
1971
- Avg. U.S. gas prices per gallon (inflation adj.): $0.36 ($2.60 — 73. highest since 1929)
- U.S. gas consumption: 92.2 billion gallons — 52. most since 1945
- Per capita gas consumption: 444 gallons — 33. most since 1945
- Price of a barrel of oil (inflation adj.): $3.40 ($24.50 — 73. highest since 1929)
- U.S. oil production: 3.5 billion barrels — 8. most since 1929
1972
- Avg. U.S. gas prices per gallon (inflation adj.): $0.36 ($2.52 — 79. highest since 1929)
- U.S. gas consumption: 98.0 billion gallons — 51. most since 1945
- Per capita gas consumption: 467 gallons — 16. most since 1945
- Price of a barrel of oil (inflation adj.): $3.40 ($23.73 — 76. highest since 1929)
- U.S. oil production: 3.5 billion barrels — 7. most since 1929
1973
- Avg. U.S. gas prices per gallon (inflation adj.): $0.39 ($2.57 — 76. highest since 1929)
- U.S. gas consumption: 102.3 billion gallons — 45. most since 1945
- Per capita gas consumption: 482.8 gallons — 4. most since 1945
- Price of a barrel of oil (inflation adj.): $3.90 ($25.64 — 68. highest since 1929)
- U.S. oil production: 3.4 billion barrels — 12. most since 1929
1974
- Avg. U.S. gas prices per gallon (inflation adj.): $0.53 ($3.15 — 46. highest since 1929)
- U.S. gas consumption: 100.2 billion gallons — 50. most since 1945
- Per capita gas consumption: 468.6 gallons — 14. most since 1945
- Price of a barrel of oil (inflation adj.): $6.90 ($40.78 — 33. highest since 1929)
- U.S. oil production: 3.2 billion barrels — 19. most since 1929
1975
- Avg. U.S. gas prices per gallon (inflation adj.): $0.57 ($3.10 — 49. highest since 1929)
- U.S. gas consumption: 102.3 billion gallons — 44. most since 1945
- Per capita gas consumption: 473.8 gallons — 10. most since 1945
- Price of a barrel of oil (inflation adj.): $7.70 ($41.72 — 30. highest since 1929)
- U.S. oil production: 3.1 billion barrels — 27. most since 1929
1976
- Avg. U.S. gas prices per gallon (inflation adj.): $0.59 ($3.03 — 55. highest since 1929)
- U.S. gas consumption: 107.3 billion gallons — 41. most since 1945
- Per capita gas consumption: 491.9 gallons — 3. most since 1945
- Price of a barrel of oil (inflation adj.): $8.20 ($42.12 — 29. highest since 1929)
- U.S. oil production: 3.0 billion barrels — 32. most since 1929
1977
- Avg. U.S. gas prices per gallon (inflation adj.): $0.62 ($2.99 — 60. highest since 1929)
- U.S. gas consumption: 110.0 billion gallons — 38. most since 1945
- Per capita gas consumption: 499.6 gallons — 2. most since 1945
- Price of a barrel of oil (inflation adj.): $8.60 ($41.39 — 32. highest since 1929)
- U.S. oil production: 3.0 billion barrels — 30. most since 1929
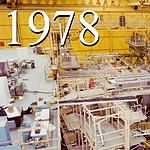
1978
- Avg. U.S. gas prices per gallon (inflation adj.): $0.63 ($2.83 — 69. highest since 1929)
- U.S. gas consumption: 113.6 billion gallons — 31. most since 1945
- Per capita gas consumption: 510.5 gallons — 1. most since 1945
- Price of a barrel of oil (inflation adj.): $9.00 ($40.40 — 34. highest since 1929)
- U.S. oil production: 3.2 billion barrels — 20. most since 1929
1979
- Avg. U.S. gas prices per gallon (inflation adj.): $0.86 ($3.47 — 29. highest since 1929)
- U.S. gas consumption: 107.8 billion gallons — 39. most since 1945
- Per capita gas consumption: 479.2 gallons — 5. most since 1945
- Price of a barrel of oil (inflation adj.): $12.60 ($50.95 — 24. highest since 1929)
- U.S. oil production: 3.1 billion barrels — 26. most since 1929
1980
- Avg. U.S. gas prices per gallon (inflation adj.): $1.19 ($4.23 — 6. highest since 1929)
- U.S. gas consumption: 101.1 billion gallons — 47. most since 1945
- Per capita gas consumption: 445 gallons — 30. most since 1945
- Price of a barrel of oil (inflation adj.): $21.60 ($76.68 — 14. highest since 1929)
- U.S. oil production: 3.1 billion barrels — 24. most since 1929
1981
- Avg. U.S. gas prices per gallon (inflation adj.): $1.31 ($4.22 — 7. highest since 1929)
- U.S. gas consumption: 101.0 billion gallons — 48. most since 1945
- Per capita gas consumption: 440.1 gallons — 36. most since 1945
- Price of a barrel of oil (inflation adj.): $31.80 ($102.28 — 6. highest since 1929)
- U.S. oil production: 3.1 billion barrels — 25. most since 1929
1982
- Avg. U.S. gas prices per gallon (inflation adj.): $1.22 ($3.70 — 22. highest since 1929)
- U.S. gas consumption: 100.2 billion gallons — 49. most since 1945
- Per capita gas consumption: 432.7 gallons — 45. most since 1945
- Price of a barrel of oil (inflation adj.): $28.50 ($86.49 — 11. highest since 1929)
- U.S. oil production: 3.2 billion barrels — 23. most since 1929
1983
- Avg. U.S. gas prices per gallon (inflation adj.): $1.16 ($3.41 — 31. highest since 1929)
- U.S. gas consumption: 101.5 billion gallons — 46. most since 1945
- Per capita gas consumption: 434.2 gallons — 44. most since 1945
- Price of a barrel of oil (inflation adj.): $26.20 ($76.95 — 12. highest since 1929)
- U.S. oil production: 3.2 billion barrels — 21. most since 1929
1984
- Avg. U.S. gas prices per gallon (inflation adj.): $1.13 ($3.18 — 40. highest since 1929)
- U.S. gas consumption: 102.9 billion gallons — 43. most since 1945
- Per capita gas consumption: 436.2 gallons — 42. most since 1945
- Price of a barrel of oil (inflation adj.): $25.90 ($72.90 — 16. highest since 1929)
- U.S. oil production: 3.2 billion barrels — 15. most since 1929
1985
- Avg. U.S. gas prices per gallon (inflation adj.): $1.12 ($3.05 — 52. highest since 1929)
- U.S. gas consumption: 104.7 billion gallons — 42. most since 1945
- Per capita gas consumption: 440.1 gallons — 35. most since 1945
- Price of a barrel of oil (inflation adj.): $24.10 ($65.52 — 19. highest since 1929)
- U.S. oil production: 3.3 billion barrels — 14. most since 1929
1986
- Avg. U.S. gas prices per gallon (inflation adj.): $0.86 ($2.30 — 86. highest since 1929)
- U.S. gas consumption: 107.8 billion gallons — 40. most since 1945
- Per capita gas consumption: 449.1 gallons — 27. most since 1945
- Price of a barrel of oil (inflation adj.): $12.50 ($33.40 — 41. highest since 1929)
- U.S. oil production: 3.2 billion barrels — 22. most since 1929
1987
- Avg. U.S. gas prices per gallon (inflation adj.): $0.90 ($2.32 — 85. highest since 1929)
- U.S. gas consumption: 110.5 billion gallons — 36. most since 1945
- Per capita gas consumption: 455.9 gallons — 22. most since 1945
- Price of a barrel of oil (inflation adj.): $15.40 ($39.67 — 35. highest since 1929)
- U.S. oil production: 3.0 billion barrels — 28. most since 1929
1988
- Avg. U.S. gas prices per gallon (inflation adj.): $0.90 ($2.23 — 90. highest since 1929)
- U.S. gas consumption: 112.8 billion gallons — 32. most since 1945
- Per capita gas consumption: 461.3 gallons — 19. most since 1945
- Price of a barrel of oil (inflation adj.): $12.60 ($31.12 — 47. highest since 1929)
- U.S. oil production: 3.0 billion barrels — 31. most since 1929
1989
- Avg. U.S. gas prices per gallon (inflation adj.): $1.00 ($2.36 — 82. highest since 1929)
- U.S. gas consumption: 112.3 billion gallons — 33. most since 1945
- Per capita gas consumption: 455.1 gallons — 23. most since 1945
- Price of a barrel of oil (inflation adj.): $15.90 ($37.43 — 36. highest since 1929)
- U.S. oil production: 2.8 billion barrels — 35. most since 1929
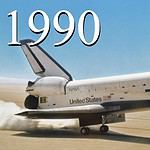
1990
- Avg. U.S. gas prices per gallon (inflation adj.): $1.15 ($2.58 — 75. highest since 1929)
- U.S. gas consumption: 110.9 billion gallons — 35. most since 1945
- Per capita gas consumption: 444.6 gallons — 32. most since 1945
- Price of a barrel of oil (inflation adj.): $20.00 ($44.85 — 27. highest since 1929)
- U.S. oil production: 2.7 billion barrels — 39. most since 1929
1991
- Avg. U.S. gas prices per gallon (inflation adj.): $1.14 ($2.45 — 80. highest since 1929)
- U.S. gas consumption: 110.2 billion gallons — 37. most since 1945
- Per capita gas consumption: 437 gallons — 41. most since 1945
- Price of a barrel of oil (inflation adj.): $16.50 ($35.54 — 39. highest since 1929)
- U.S. oil production: 2.7 billion barrels — 38. most since 1929
1992
- Avg. U.S. gas prices per gallon (inflation adj.): $1.13 ($2.36 — 83. highest since 1929)
- U.S. gas consumption: 111.7 billion gallons — 34. most since 1945
- Per capita gas consumption: 438.1 gallons — 39. most since 1945
- Price of a barrel of oil (inflation adj.): $16.00 ($33.35 — 42. highest since 1929)
- U.S. oil production: 2.6 billion barrels — 41. most since 1929
1993
- Avg. U.S. gas prices per gallon (inflation adj.): $1.11 ($2.25 — 89. highest since 1929)
- U.S. gas consumption: 114.6 billion gallons — 30. most since 1945
- Per capita gas consumption: 444.6 gallons — 31. most since 1945
- Price of a barrel of oil (inflation adj.): $14.30 ($28.86 — 55. highest since 1929)
- U.S. oil production: 2.5 billion barrels — 47. most since 1929
1994
- Avg. U.S. gas prices per gallon (inflation adj.): $1.08 ($2.13 — 92. highest since 1929)
- U.S. gas consumption: 116.5 billion gallons — 29. most since 1945
- Per capita gas consumption: 447.6 gallons — 28. most since 1945
- Price of a barrel of oil (inflation adj.): $13.20 ($26.05 — 66. highest since 1929)
- U.S. oil production: 2.4 billion barrels — 50. most since 1929
1995
- Avg. U.S. gas prices per gallon (inflation adj.): $1.16 ($2.22 — 91. highest since 1929)
- U.S. gas consumption: 119.4 billion gallons — 28. most since 1945
- Per capita gas consumption: 454.3 gallons — 25. most since 1945
- Price of a barrel of oil (inflation adj.): $14.60 ($28.07 — 60. highest since 1929)
- U.S. oil production: 2.4 billion barrels — 51. most since 1929
1996
- Avg. U.S. gas prices per gallon (inflation adj.): $1.25 ($2.32 — 84. highest since 1929)
- U.S. gas consumption: 121.3 billion gallons — 27. most since 1945
- Per capita gas consumption: 457.3 gallons — 21. most since 1945
- Price of a barrel of oil (inflation adj.): $18.50 ($34.43 — 40. highest since 1929)
- U.S. oil production: 2.4 billion barrels — 53. most since 1929
1997
- Avg. U.S. gas prices per gallon (inflation adj.): $1.24 ($2.27 — 87. highest since 1929)
- U.S. gas consumption: 122.9 billion gallons — 26. most since 1945
- Per capita gas consumption: 458.9 gallons — 20. most since 1945
- Price of a barrel of oil (inflation adj.): $17.20 ($31.42 — 45. highest since 1929)
- U.S. oil production: 2.4 billion barrels — 55. most since 1929
1998
- Avg. U.S. gas prices per gallon (inflation adj.): $1.07 ($1.92 — 94. highest since 1929)
- U.S. gas consumption: 126.5 billion gallons — 24. most since 1945
- Per capita gas consumption: 468.2 gallons — 15. most since 1945
- Price of a barrel of oil (inflation adj.): $10.90 ($19.52 — 91. highest since 1929)
- U.S. oil production: 2.3 billion barrels — 58. most since 1929
1999
- Avg. U.S. gas prices per gallon (inflation adj.): $1.18 ($2.07 — 93. highest since 1929)
- U.S. gas consumption: 129.2 billion gallons — 23. most since 1945
- Per capita gas consumption: 474 gallons — 9. most since 1945
- Price of a barrel of oil (inflation adj.): $15.60 ($27.33 — 63. highest since 1929)
- U.S. oil production: 2.1 billion barrels — 60. most since 1929
2000
- Avg. U.S. gas prices per gallon (inflation adj.): $1.52 ($2.59 — 74. highest since 1929)
- U.S. gas consumption: 130.2 billion gallons — 22. most since 1945
- Per capita gas consumption: 461.6 gallons — 18. most since 1945
- Price of a barrel of oil (inflation adj.): $26.70 ($45.41 — 26. highest since 1929)
- U.S. oil production: 2.1 billion barrels — 61. most since 1929
2001
- Avg. U.S. gas prices per gallon (inflation adj.): $1.46 ($2.41 — 81. highest since 1929)
- U.S. gas consumption: 132.0 billion gallons — 21. most since 1945
- Per capita gas consumption: 463.2 gallons — 17. most since 1945
- Price of a barrel of oil (inflation adj.): $21.80 ($36.09 — 38. highest since 1929)
- U.S. oil production: 2.1 billion barrels — 62. most since 1929
2002
- Avg. U.S. gas prices per gallon (inflation adj.): $1.39 ($2.25 — 88. highest since 1929)
- U.S. gas consumption: 135.6 billion gallons — 15. most since 1945
- Per capita gas consumption: 471.6 gallons — 13. most since 1945
- Price of a barrel of oil (inflation adj.): $22.50 ($36.62 — 37. highest since 1929)
- U.S. oil production: 2.1 billion barrels — 63. most since 1929
2003
- Avg. U.S. gas prices per gallon (inflation adj.): $1.60 ($2.55 — 78. highest since 1929)
- U.S. gas consumption: 137.0 billion gallons — 13. most since 1945
- Per capita gas consumption: 472.1 gallons — 12. most since 1945
- Price of a barrel of oil (inflation adj.): $27.60 ($43.83 — 28. highest since 1929)
- U.S. oil production: 2.1 billion barrels — 65. most since 1929
2004
- Avg. U.S. gas prices per gallon (inflation adj.): $1.90 ($2.94 — 62. highest since 1929)
- U.S. gas consumption: 140.0 billion gallons — 9. most since 1945
- Per capita gas consumption: 478 gallons — 6. most since 1945
- Price of a barrel of oil (inflation adj.): $36.80 ($56.97 — 22. highest since 1929)
- U.S. oil production: 2.0 billion barrels — 68. most since 1929
2005
- Avg. U.S. gas prices per gallon (inflation adj.): $2.31 ($3.47 — 28. highest since 1929)
- U.S. gas consumption: 140.4 billion gallons — 8. most since 1945
- Per capita gas consumption: 475.1 gallons — 8. most since 1945
- Price of a barrel of oil (inflation adj.): $50.30 ($75.34 — 15. highest since 1929)
- U.S. oil production: 1.9 billion barrels — 71. most since 1929
2006
- Avg. U.S. gas prices per gallon (inflation adj.): $2.62 ($3.80 — 19. highest since 1929)
- U.S. gas consumption: 141.8 billion gallons — 6. most since 1945
- Per capita gas consumption: 475.4 gallons — 7. most since 1945
- Price of a barrel of oil (inflation adj.): $59.70 ($86.65 — 10. highest since 1929)
- U.S. oil production: 1.9 billion barrels — 73. most since 1929
2007
- Avg. U.S. gas prices per gallon (inflation adj.): $2.84 ($4.01 — 14. highest since 1929)
- U.S. gas consumption: 142.3 billion gallons — 5. most since 1945
- Per capita gas consumption: 472.6 gallons — 11. most since 1945
- Price of a barrel of oil (inflation adj.): $66.50 ($93.89 — 9. highest since 1929)
- U.S. oil production: 1.9 billion barrels — 74. most since 1929
2008
- Avg. U.S. gas prices per gallon (inflation adj.): $3.30 ($4.48 — 4. highest since 1929)
- U.S. gas consumption: 138.2 billion gallons — 10. most since 1945
- Per capita gas consumption: 454.4 gallons — 24. most since 1945
- Price of a barrel of oil (inflation adj.): $94.00 ($127.83 — 1. highest since 1929)
- U.S. oil production: 1.8 billion barrels — 76. most since 1929
2009
- Avg. U.S. gas prices per gallon (inflation adj.): $2.41 ($3.28 — 34. highest since 1929)
- U.S. gas consumption: 137.9 billion gallons — 11. most since 1945
- Per capita gas consumption: 449.6 gallons — 26. most since 1945
- Price of a barrel of oil (inflation adj.): $56.40 ($76.87 — 13. highest since 1929)
- U.S. oil production: 2.0 billion barrels — 70. most since 1929
2010
- Avg. U.S. gas prices per gallon (inflation adj.): $2.84 ($3.80 — 18. highest since 1929)
- U.S. gas consumption: 137.9 billion gallons — 12. most since 1945
- Per capita gas consumption: 445.7 gallons — 29. most since 1945
- Price of a barrel of oil (inflation adj.): $74.70 ($100.27 — 7. highest since 1929)
- U.S. oil production: 2.0 billion barrels — 67. most since 1929
2011
- Avg. U.S. gas prices per gallon (inflation adj.): $3.58 ($4.65 — 2. highest since 1929)
- U.S. gas consumption: 134.2 billion gallons — 19. most since 1945
- Per capita gas consumption: 430.6 gallons — 47. most since 1945
- Price of a barrel of oil (inflation adj.): $95.70 ($124.55 — 2. highest since 1929)
- U.S. oil production: 2.1 billion barrels — 64. most since 1929
2012
- Avg. U.S. gas prices per gallon (inflation adj.): $3.68 ($4.69 — 1. highest since 1929)
- U.S. gas consumption: 133.5 billion gallons — 20. most since 1945
- Per capita gas consumption: 425.2 gallons — 50. most since 1945
- Price of a barrel of oil (inflation adj.): $94.50 ($120.48 — 4. highest since 1929)
- U.S. oil production: 2.4 billion barrels — 52. most since 1929
2013
- Avg. U.S. gas prices per gallon (inflation adj.): $3.58 ($4.49 — 3. highest since 1929)
- U.S. gas consumption: 135.6 billion gallons — 16. most since 1945
- Per capita gas consumption: 428.9 gallons — 49. most since 1945
- Price of a barrel of oil (inflation adj.): $96.00 ($120.59 — 3. highest since 1929)
- U.S. oil production: 2.7 billion barrels — 37. most since 1929
2014
- Avg. U.S. gas prices per gallon (inflation adj.): $3.44 ($4.25 — 5. highest since 1929)
- U.S. gas consumption: 136.8 billion gallons — 14. most since 1945
- Per capita gas consumption: 429.5 gallons — 48. most since 1945
- Price of a barrel of oil (inflation adj.): $87.40 ($108.03 — 5. highest since 1929)
- U.S. oil production: 3.2 billion barrels — 18. most since 1929
2015
- Avg. U.S. gas prices per gallon (inflation adj.): $2.52 ($3.11 — 48. highest since 1929)
- U.S. gas consumption: 140.7 billion gallons — 7. most since 1945
- Per capita gas consumption: 438.7 gallons — 38. most since 1945
- Price of a barrel of oil (inflation adj.): $44.40 ($54.81 — 23. highest since 1929)
- U.S. oil production: 3.4 billion barrels — 9. most since 1929
2016
- Avg. U.S. gas prices per gallon (inflation adj.): $2.25 ($2.74 — 71. highest since 1929)
- U.S. gas consumption: 143.2 billion gallons — 1. most since 1945
- Per capita gas consumption: 443.3 gallons — 34. most since 1945
- Price of a barrel of oil (inflation adj.): $38.30 ($46.69 — 25. highest since 1929)
- U.S. oil production: 3.2 billion barrels — 16. most since 1929
2017
- Avg. U.S. gas prices per gallon (inflation adj.): $2.53 ($3.02 — 58. highest since 1929)
- U.S. gas consumption: 143.0 billion gallons — 3. most since 1945
- Per capita gas consumption: 439.8 gallons — 37. most since 1945
- Price of a barrel of oil (inflation adj.): $48.10 ($57.37 — 21. highest since 1929)
- U.S. oil production: 3.4 billion barrels — 10. most since 1929
2018
- Avg. U.S. gas prices per gallon (inflation adj.): $2.81 ($3.28 — 36. highest since 1929)
- U.S. gas consumption: 143.0 billion gallons — 2. most since 1945
- Per capita gas consumption: 437.6 gallons — 40. most since 1945
- Price of a barrel of oil (inflation adj.): $61.40 ($71.56 — 17. highest since 1929)
- U.S. oil production: 4.0 billion barrels — 5. most since 1929
2019
- Avg. U.S. gas prices per gallon (inflation adj.): $2.69 ($3.08 — 50. highest since 1929)
- U.S. gas consumption: 142.7 billion gallons — 4. most since 1945
- Per capita gas consumption: 434.7 gallons — 43. most since 1945
- Price of a barrel of oil (inflation adj.): $55.60 ($63.63 — 20. highest since 1929)
- U.S. oil production: 4.5 billion barrels — 1. most since 1929
2020
- Avg. U.S. gas prices per gallon (inflation adj.): $2.26 ($2.55 — 77. highest since 1929)
- U.S. gas consumption: 123.7 billion gallons — 25. most since 1945
- Per capita gas consumption: 373.2 gallons — 57. most since 1945
- Price of a barrel of oil (inflation adj.): $36.90 ($41.68 — 31. highest since 1929)
- U.S. oil production: 4.1 billion barrels — 3. most since 1929