
Restaurant chains have been around for more than a century in America. The first one, in fact, traces its origins back to the 1870s. This was Harvey House, a group of restaurants and hotels established by a British-born railway agent named Fred Harvey, who recognized the need for hospitality businesses along the nation’s railroad lines.
Harvey opened his first three places, cafes with inns attached, in 1876 — two in Kansas and one in Colorado. The chain eventually grew into more than 80 locations, not counting 30 Harvey-branded dining cars. The chain shrunk along with the decline in railway travel, but Harvey’s company was bought in 1968 by the Xanterra Travel Collection, which is the country’s largest national and state park concessionaire.
The oldest restaurant chain that still exists debuted with a roadside root beer stand opened in California’s Central Valley in 1919 by one Roy W. Allen. The stand gave birth to the A&W restaurants (the name drawn from the initials of Allen and his business partner, Frank Wright), now a 506-unit operation in 36 states. The first hamburger chain, White Castle — famed for its sliders — appeared just two years later, in Wichita, KS, and now has 350 locations.
A&W and White Castle were just the beginning, of course. According to the food business digest site FoodIndustry.com, as of 2023, there were about 349,000 chain restaurant businesses around the country, constituting almost half of the total number of restaurants. Almost 21,000 of those chain businesses are Subway stores; it’s the nation’s largest chain in number of units, followed by McDonald’s with about 13,500.
Some U.S. cities have a much larger proportion of chain restaurants than others. To determine those cities where the most restaurants are chains, 24/7 Tempo reviewed data from “Measuring McCities: Landscapes of Chain and Independent Restaurants in the United States,” a project of the Friendly Cities Lab at Georgia Tech University.
All the cities on this list of places with the most chains compared to their total restaurant population count more than 58% of their eating places as chains — and in the No. 1 city, Jackson, TN, you might have to do some looking to find an independent restaurant, as almost 70% of its restaurants are chains.
To determine the cities where the majority of restaurants are chains, 24/7 Tempo reviewed data on over 750,000 restaurants from “Measuring McCities: Landscapes of Chain and Independent Restaurants in the United States,” a project of the Friendly Cities Lab at Georgia Tech University. Cities were ranked based on the number of chain restaurants as a percentage of all restaurants within their boundaries. Chain restaurants were defined as those with more than five similarly named restaurant establishments nationwide. Raw data on restaurant locations came from LeadsDeposit in April 2021 and were geocoded using the Google Geocoding API.
Restaurant locations were then aggregated to the city level using spatial place boundaries from the U.S. Census Bureau. Supplemental data on median household income, median home value, and total population are from the Census Bureau’s 2022 American Community Survey and are five-year estimates. Only cities with at least 150 geocoded restaurant locations were considered. (Click here to see the most popular fast-food chains in all states.)
50. Bossier City, LA

- Chains as share of all restaurants: 58.2% (tie)
- Median household income: $54,100
- Median home value: $187,000
- Total population: 62,971
49. The Woodlands, TX

- Chains as share of all restaurants: 58.2% (tie)
- Median household income: $142,384
- Median home value: $456,400
- Total population: 118,402
48. North Little Rock, AR

- Chains as share of all restaurants: 58.2% (tie)
- Median household income: $49,166
- Median home value: $165,600
- Total population: 64,454
47. McKinney, TX
- Chains as share of all restaurants: 58.4%
- Median household income: $113,286
- Median home value: $400,400
- Total population: 196,160
46. Fayetteville, NC
- Chains as share of all restaurants: 58.5%
- Median household income: $53,424
- Median home value: $158,500
- Total population: 208,697
45. Killeen, TX

- Chains as share of all restaurants: 58.6%
- Median household income: $57,086
- Median home value: $175,400
- Total population: 153,708
44. Hampton, VA
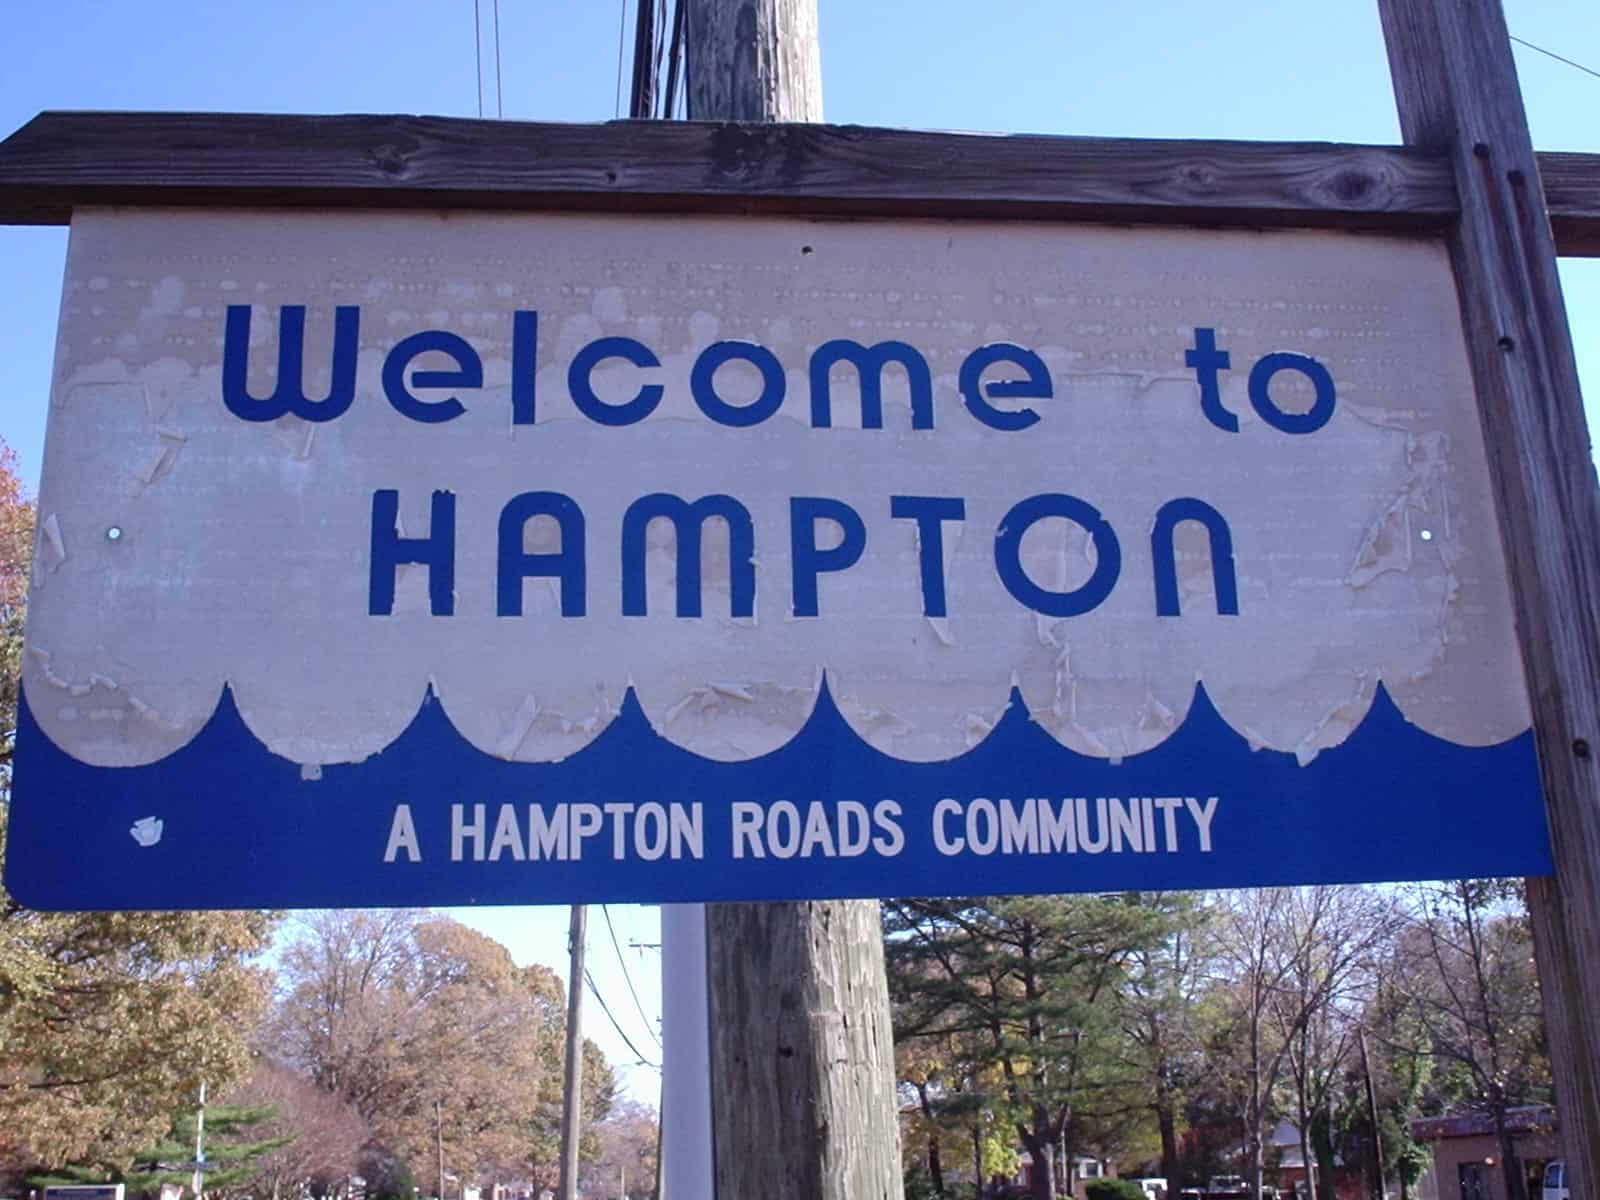
- Chains as share of all restaurants: 58.7%
- Median household income: $64,430
- Median home value: $219,800
- Total population: 137,217
43. Fairfield, CA

- Chains as share of all restaurants: 58.8% (tie)
- Median household income: $98,857
- Median home value: $546,200
- Total population: 119,420
42. Ontario, CA

- Chains as share of all restaurants: 58.8% (tie)
- Median household income: $78,070
- Median home value: $513,000
- Total population: 176,326
41. Fishers, IN

- Chains as share of all restaurants: 59.0%
- Median household income: $126,548
- Median home value: $339,000
- Total population: 99,041
40. West Valley City, UT
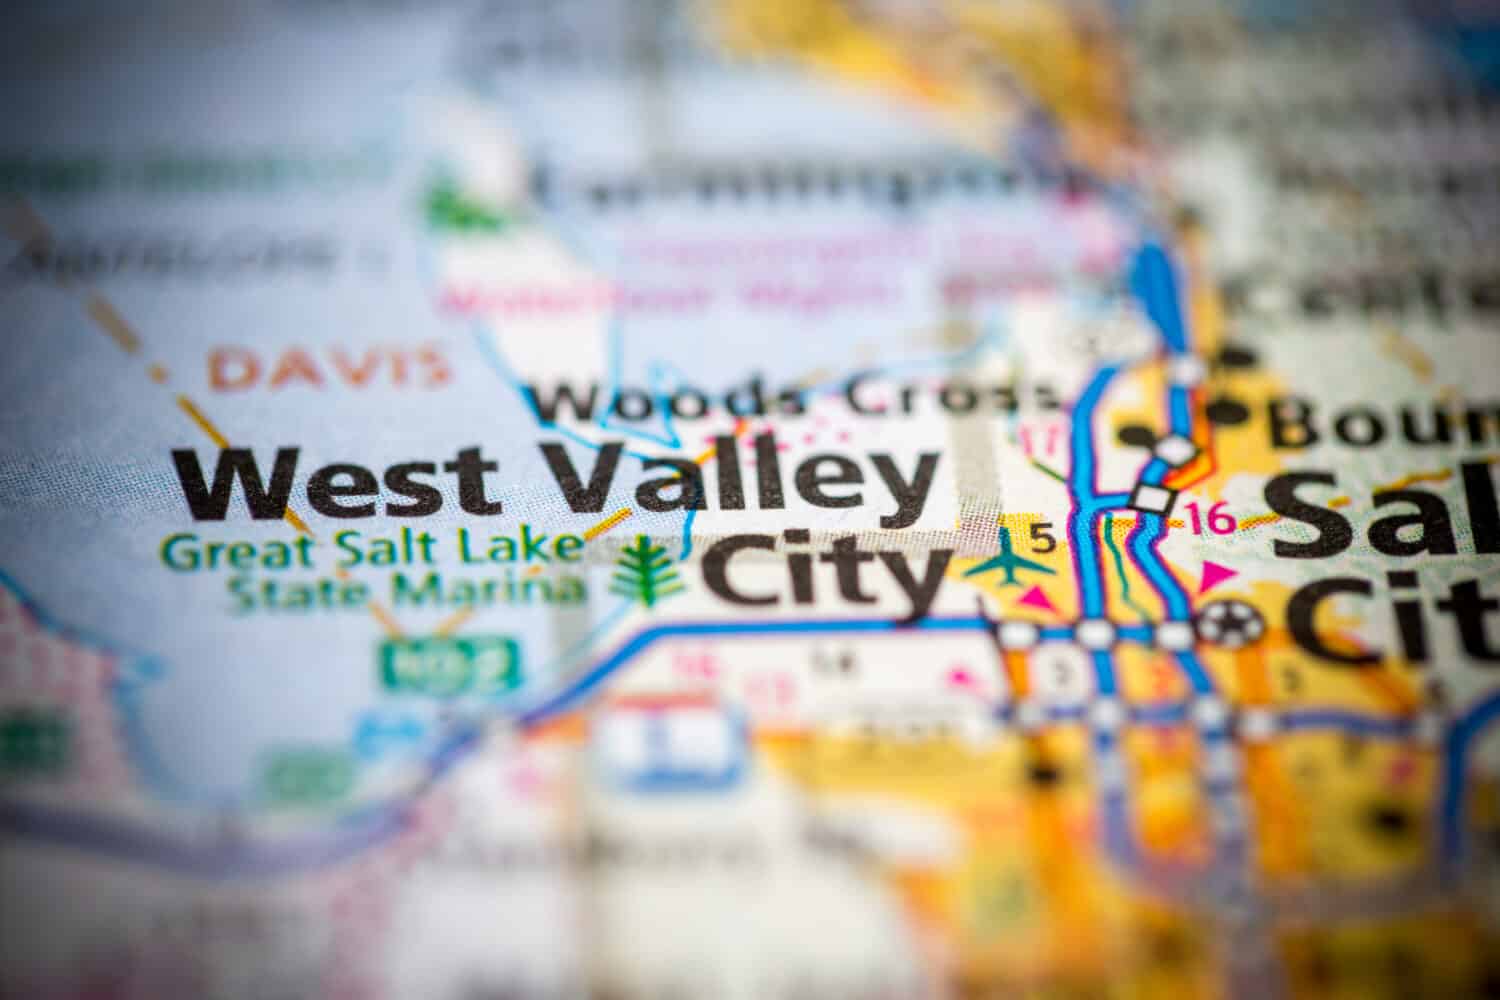
- Chains as share of all restaurants: 59.4%
- Median household income: $81,719
- Median home value: $333,600
- Total population: 138,868
39. Round Rock, TX

- Chains as share of all restaurants: 59.5%
- Median household income: $91,888
- Median home value: $337,500
- Total population: 120,465
38. Sioux City, IA

- Chains as share of all restaurants: 59.6%
- Median household income: $64,250
- Median home value: $149,800
- Total population: 85,469
37. Allen, TX
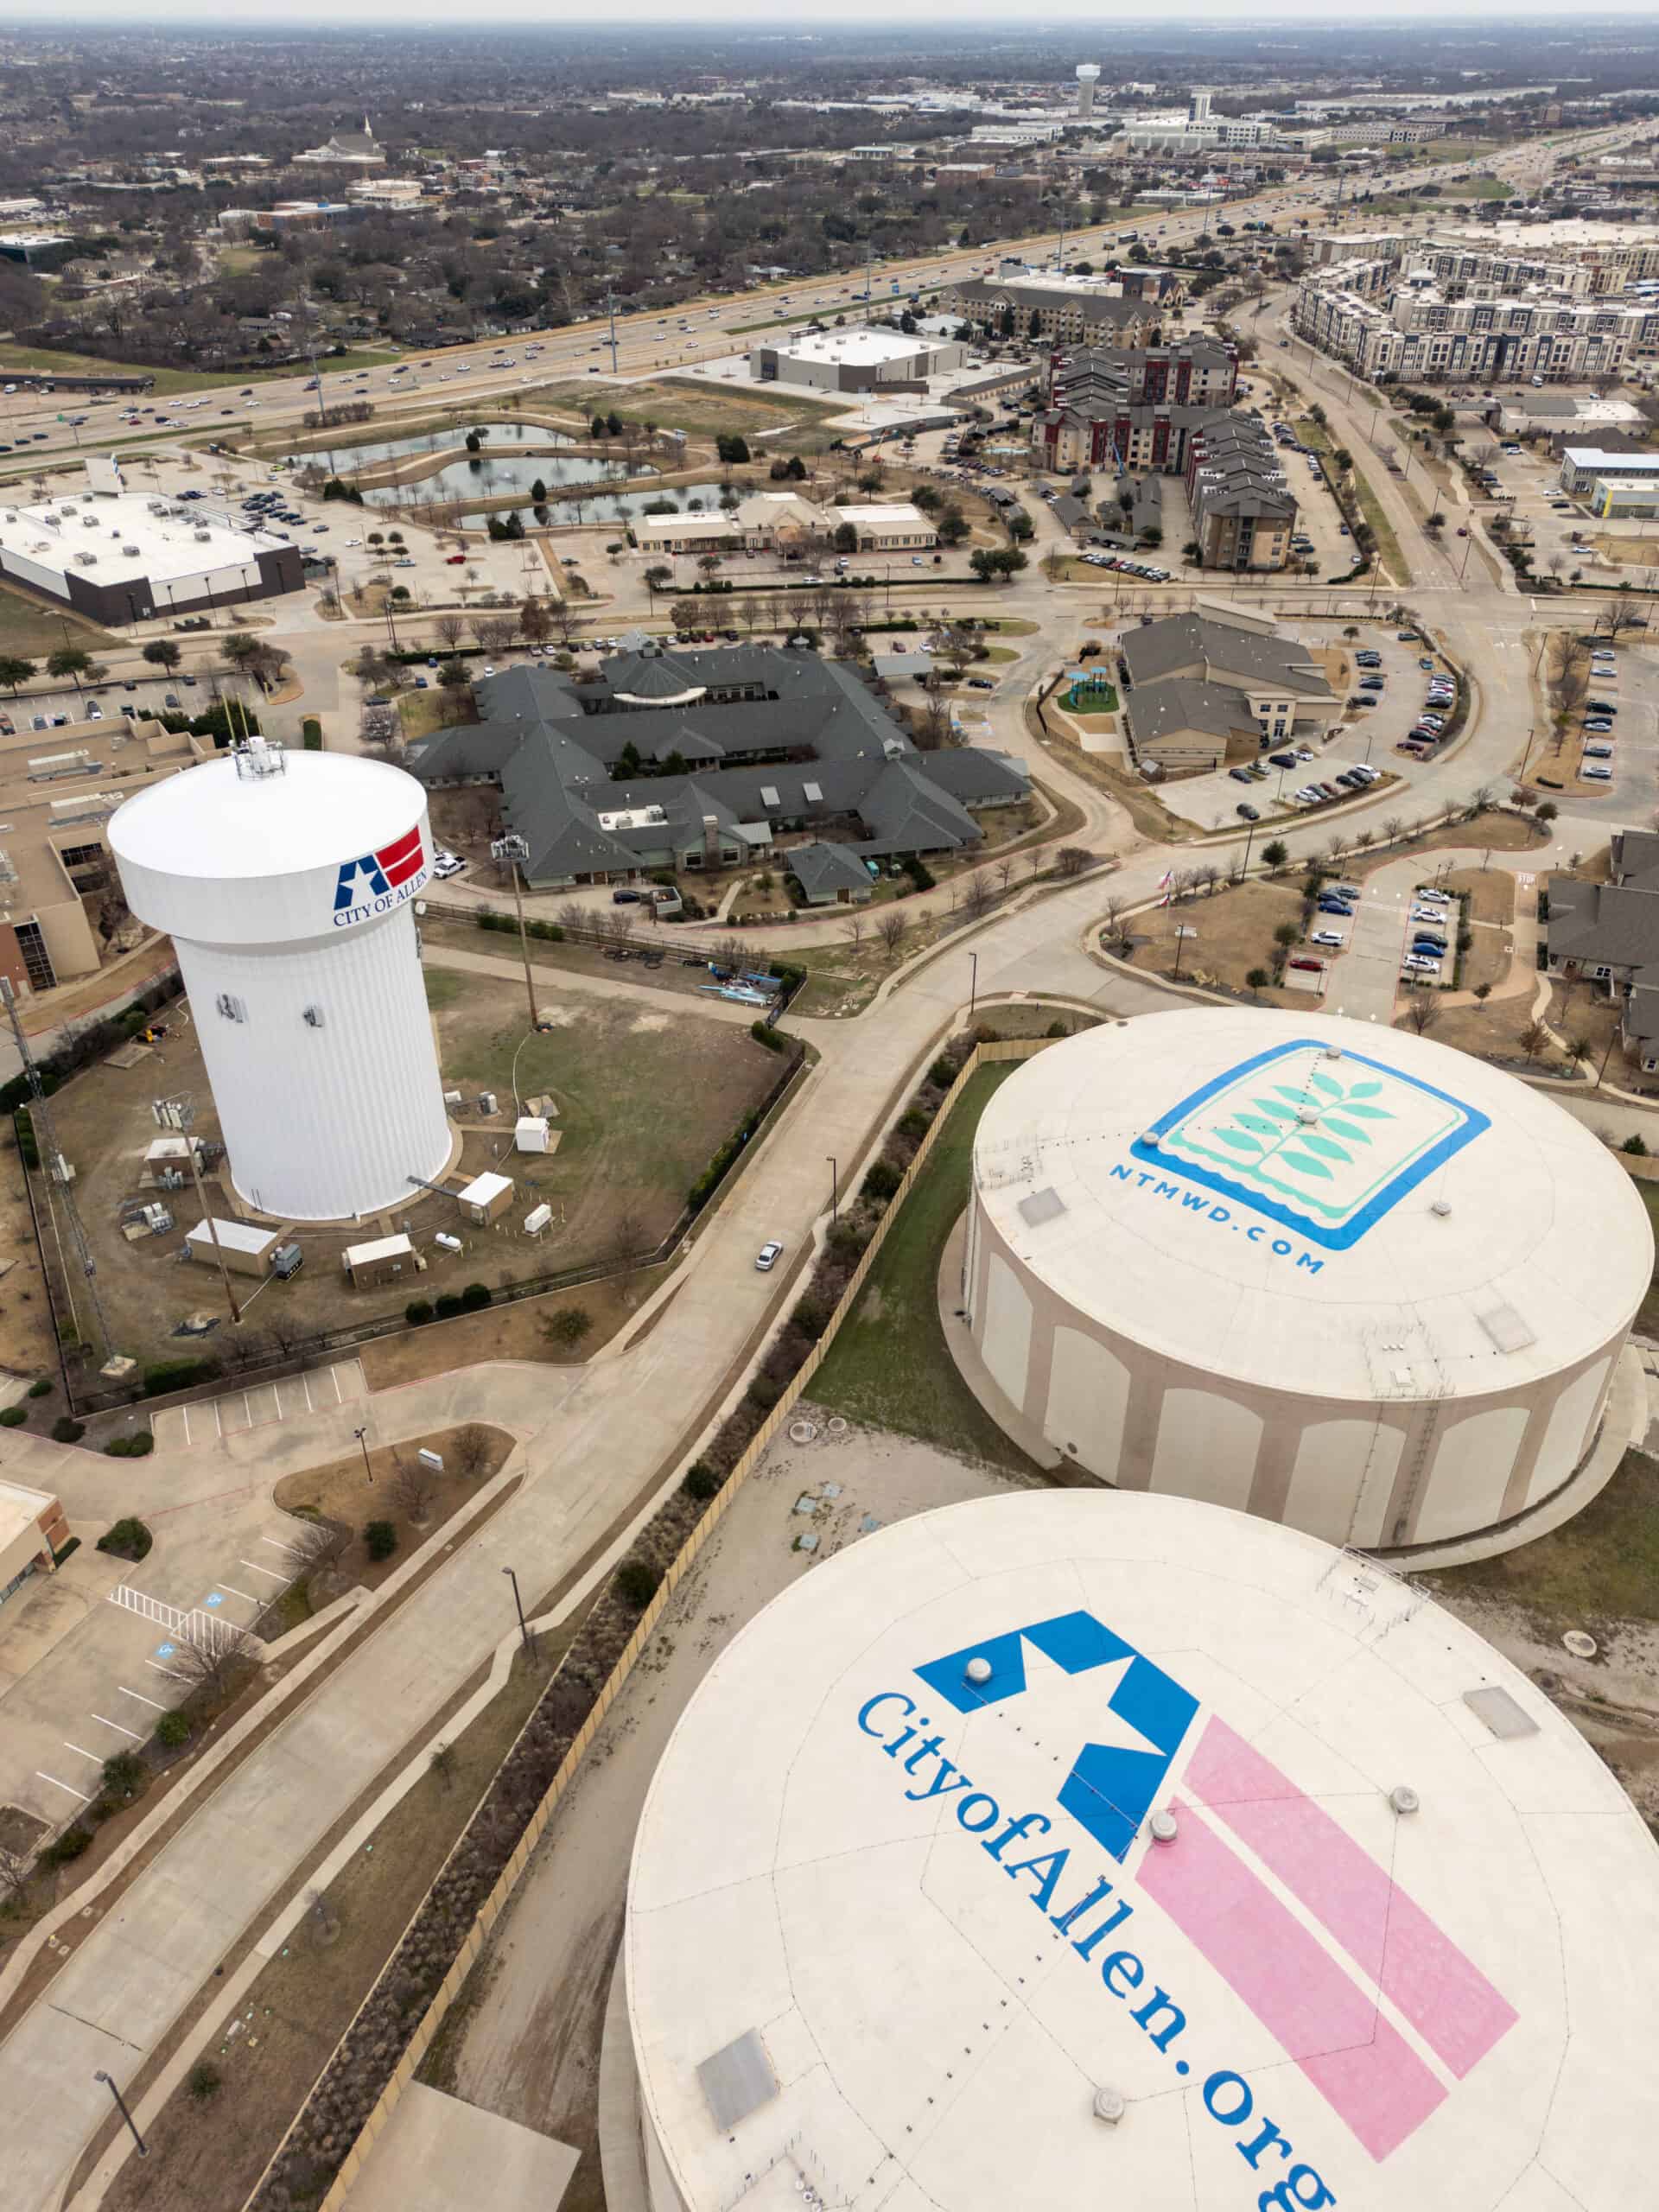
- Chains as share of all restaurants: 59.7% (tie)
- Median household income: $121,259
- Median home value: $390,200
- Total population: 105,444
36. Mishawaka, IN

- Chains as share of all restaurants: 59.7% (tie)
- Median household income: $51,543
- Median home value: $128,200
- Total population: 50,899
35. Hickory, NC
- Chains as share of all restaurants: 59.8%
- Median household income: $58,251
- Median home value: $233,800
- Total population: 43,352
34. Greenville, NC
- Chains as share of all restaurants: 59.9% (tie)
- Median household income: $47,485
- Median home value: $192,900
- Total population: 87,894
33. Sioux Falls, SD

- Chains as share of all restaurants: 59.9% (tie)
- Median household income: $71,785
- Median home value: $250,000
- Total population: 193,401
32. Gastonia, NC

- Chains as share of all restaurants: 60.0% (tie)
- Median household income: $58,047
- Median home value: $219,700
- Total population: 80,615
31. Yuma, AZ
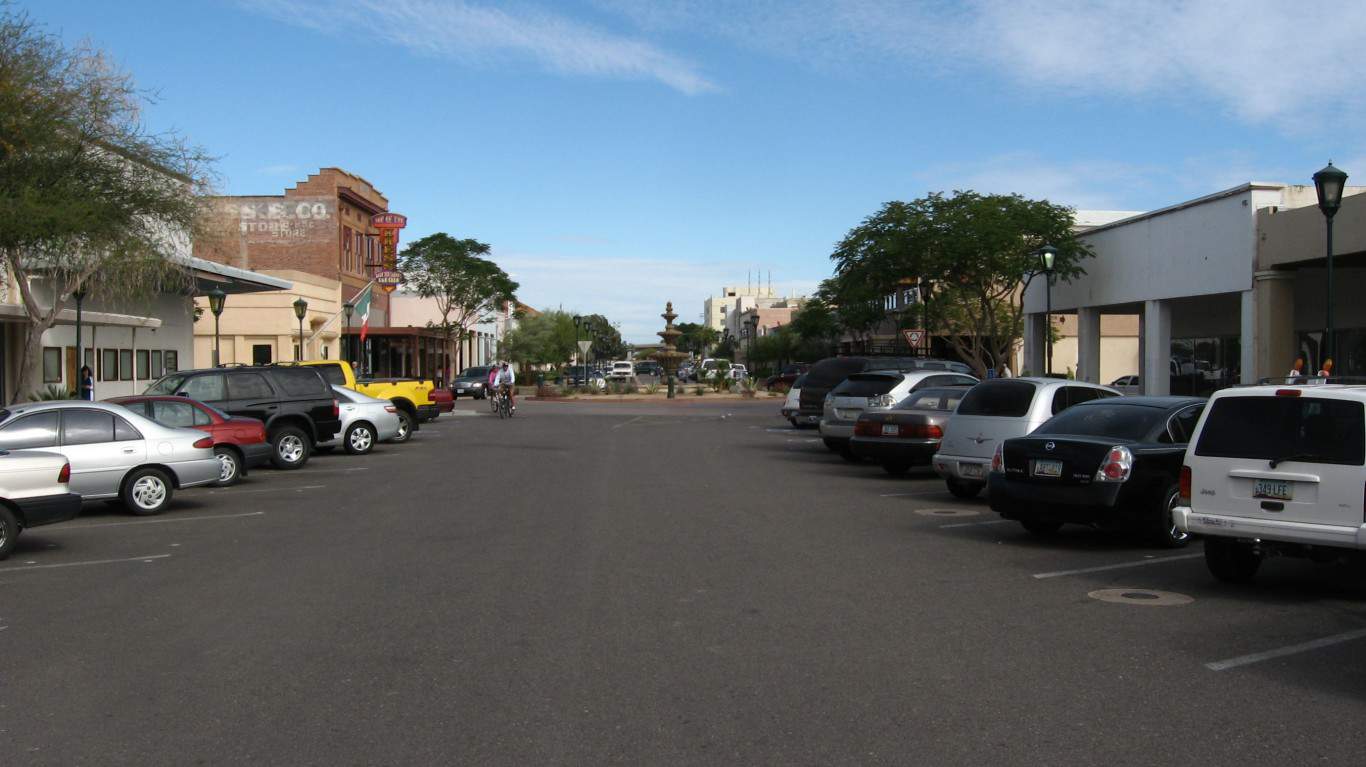
- Chains as share of all restaurants: 60.0% (tie)
- Median household income: $59,312
- Median home value: $186,500
- Total population: 96,314
30. Lakewood, CO
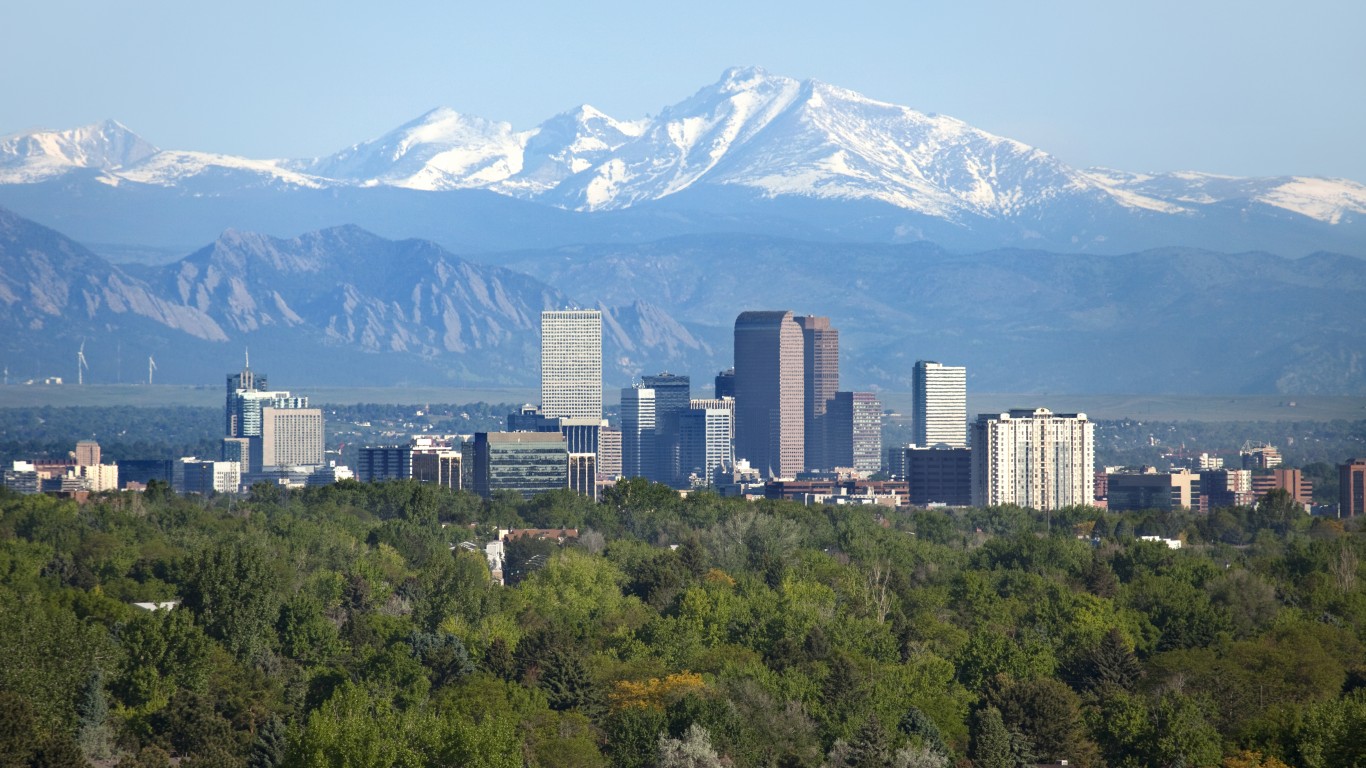
- Chains as share of all restaurants: 60.0% (tie)
- Median household income: $82,786
- Median home value: $494,100
- Total population: 156,149
29. Hattiesburg, MS
- Chains as share of all restaurants: 60.0% (tie)
- Median household income: $41,024
- Median home value: $146,600
- Total population: 48,466
28. Wichita Falls, TX
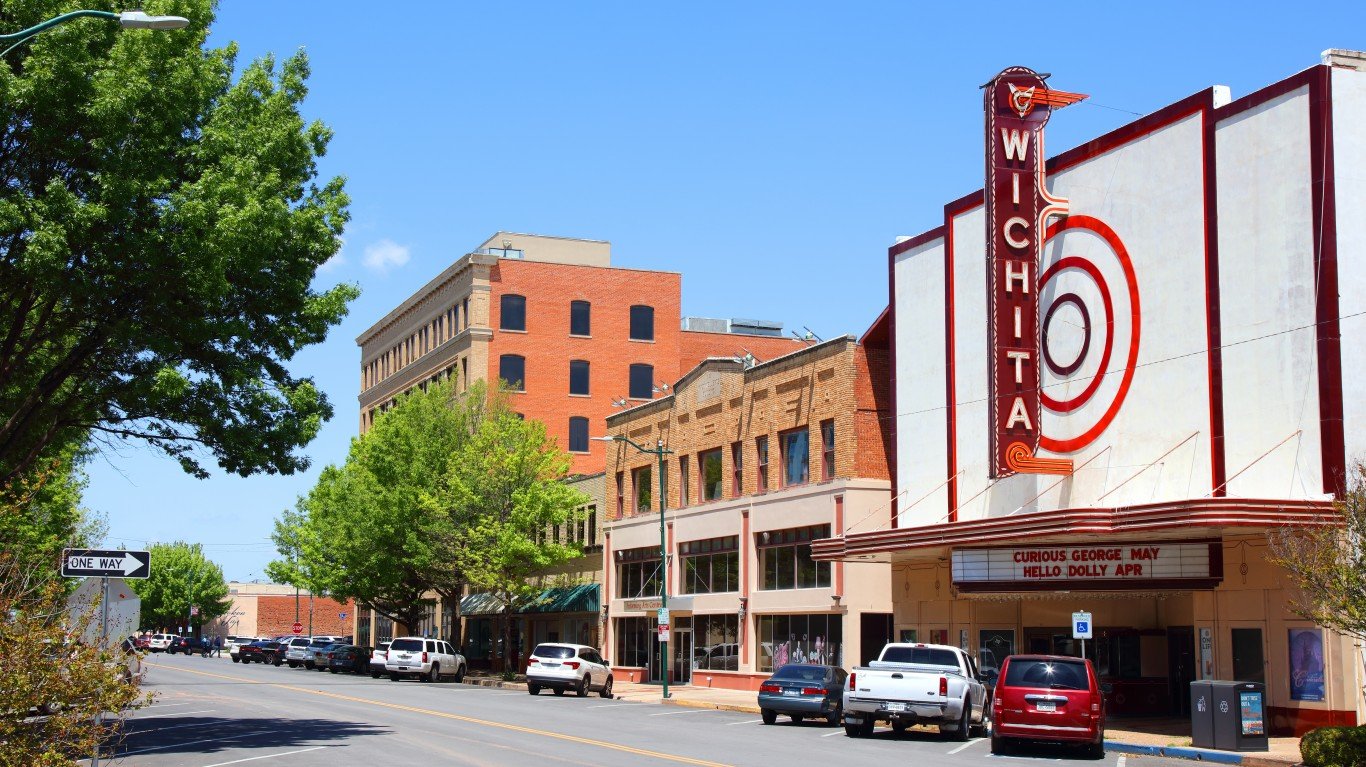
- Chains as share of all restaurants: 60.1%
- Median household income: $55,584
- Median home value: $128,800
- Total population: 102,482
27. Rock Hill, SC
- Chains as share of all restaurants: 60.2%
- Median household income: $60,807
- Median home value: $232,500
- Total population: 74,170
26. Kingsport, TN
- Chains as share of all restaurants: 60.4%
- Median household income: $48,228
- Median home value: $181,600
- Total population: 55,415
25. Grand Prairie, TX
- Chains as share of all restaurants: 60.5%
- Median household income: $76,626
- Median home value: $242,900
- Total population: 197,279
24. Palmdale, CA

- Chains as share of all restaurants: 60.6%
- Median household income: $78,414
- Median home value: $397,500
- Total population: 166,895
23. Chesapeake, VA
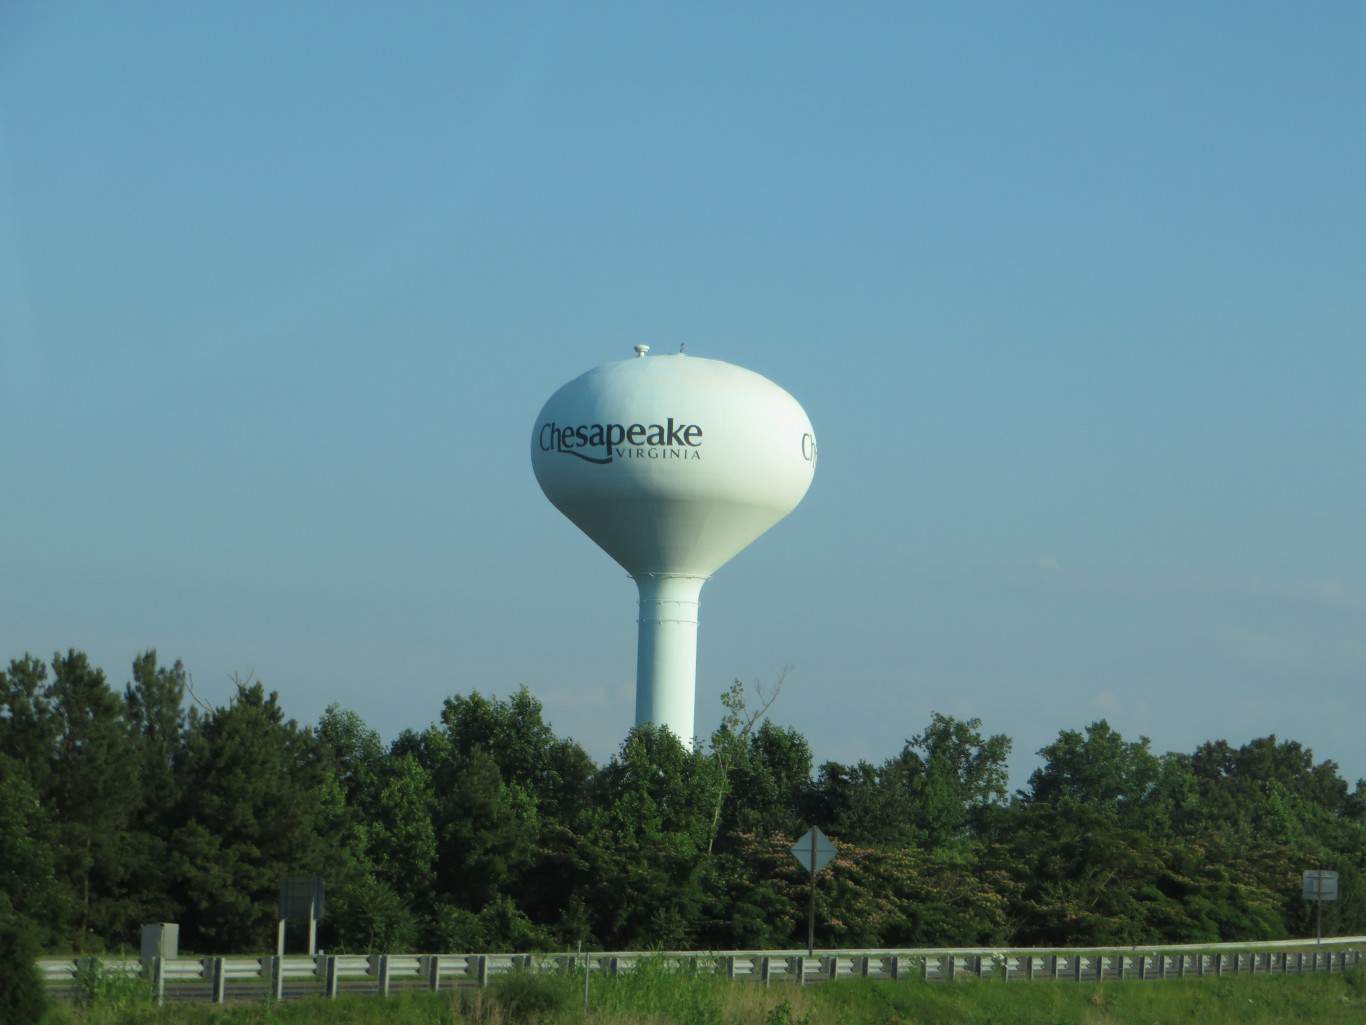
- Chains as share of all restaurants: 60.7% (tie)
- Median household income: $92,703
- Median home value: $339,500
- Total population: 249,377
22. Moreno Valley, CA
- Chains as share of all restaurants: 60.7% (tie)
- Median household income: $82,637
- Median home value: $421,400
- Total population: 209,578
21. Victorville, CA

- Chains as share of all restaurants: 60.9%
- Median household income: $65,746
- Median home value: $300,600
- Total population: 134,417
20. Lubbock, TX

- Chains as share of all restaurants: 61.0%
- Median household income: $58,734
- Median home value: $181,600
- Total population: 258,190
19. Jonesboro, AR

- Chains as share of all restaurants: 61.1%
- Median household income: $51,124
- Median home value: $196,100
- Total population: 78,379
18. Tyler, TX

- Chains as share of all restaurants: 61.6%
- Median household income: $63,056
- Median home value: $205,200
- Total population: 106,440
17. Murfreesboro, TN
- Chains as share of all restaurants: 61.9%
- Median household income: $70,451
- Median home value: $327,400
- Total population: 153,487
16. North Las Vegas

- NVChains as share of all restaurants: 62.1%
- Median household income: $71,774
- Median home value: $340,200
- Total population: 264,022
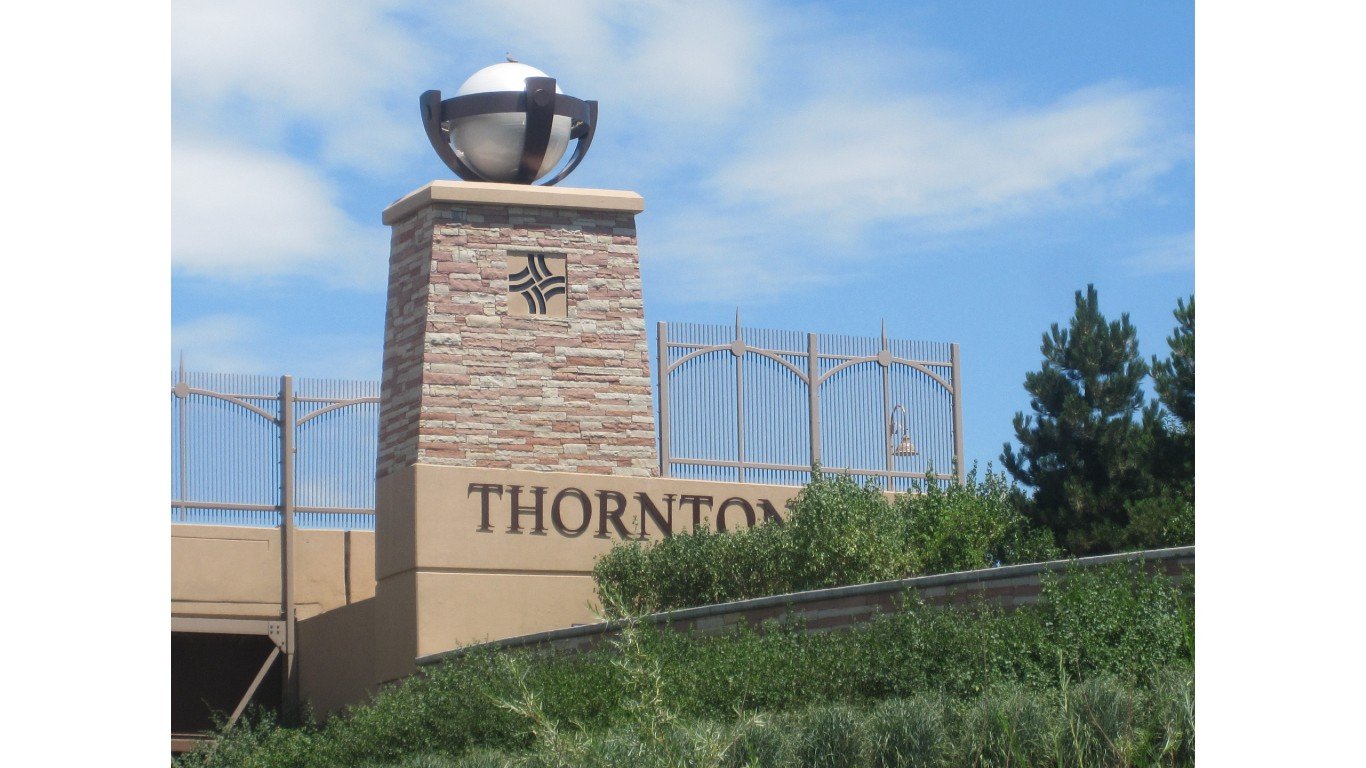
15. Thornton, CO
- Chains as share of all restaurants: 62.2%
- Median household income: $95,064
- Median home value: $445,200
- Total population: 141,799
14. Concord, NC

- Chains as share of all restaurants: 62.3%
- Median household income: $83,480
- Median home value: $288,100
- Total population: 105,335
13. Mesquite, TX
- Chains as share of all restaurants: 62.7%
- Median household income: $69,649
- Median home value: $208,800
- Total population: 149,439
12. Bowling Green, KY
- Chains as share of all restaurants: 62.8%
- Median household income: $47,118
- Median home value: $215,300
- Total population: 72,385
11. Louisville/Jefferson County metro government (balance), KY

- Chains as share of all restaurants: 63.2%
- Median household income: $63,114
- Median home value: $204,800
- Total population: 629,176
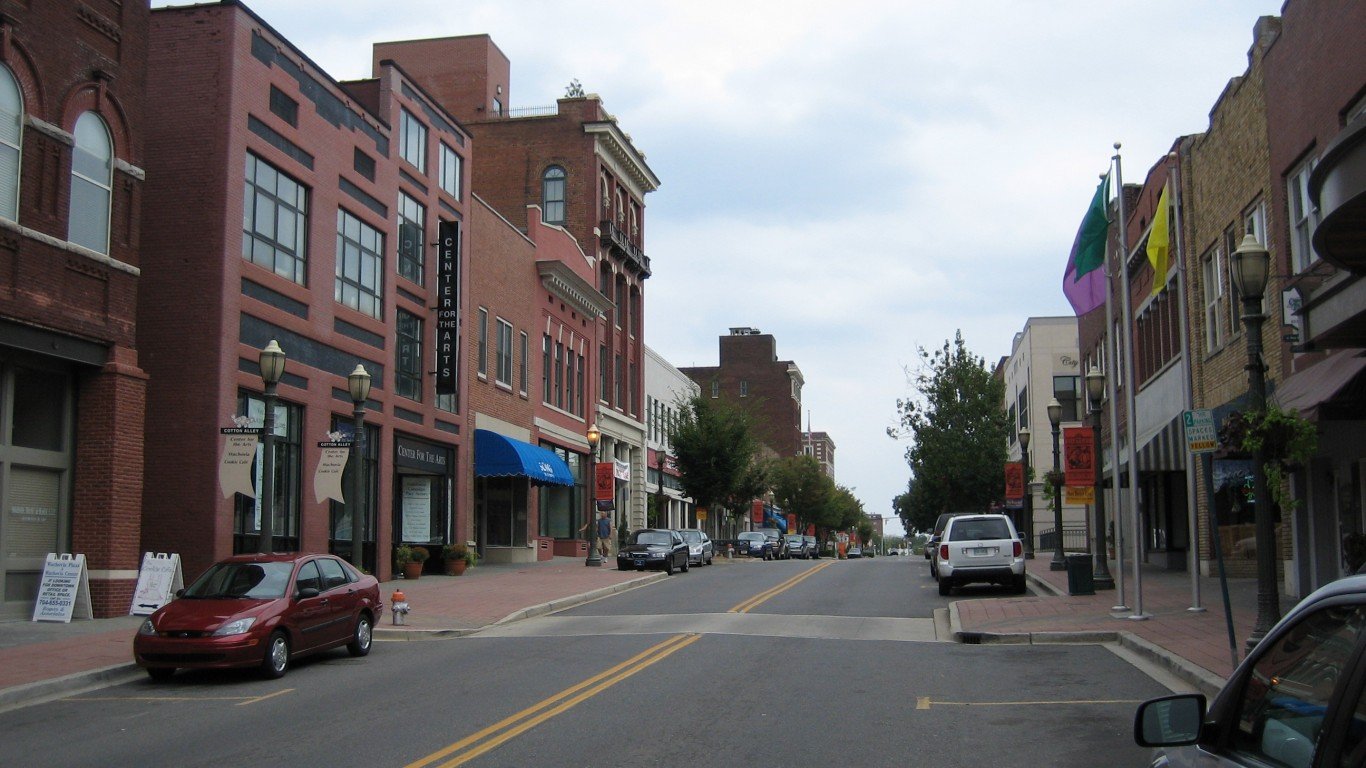
10. Tuscaloosa, AL
- Chains as share of all restaurants: 63.3%
- Median household income: $47,257
- Median home value: $228,300
- Total population: 105,797
9. Joplin, MO
- Chains as share of all restaurants: 63.6%
- Median household income: $50,996
- Median home value: $147,000
- Total population: 51,848
8. Fontana, CA
- Chains as share of all restaurants: 63.7%
- Median household income: $93,230
- Median home value: $506,600
- Total population: 209,279
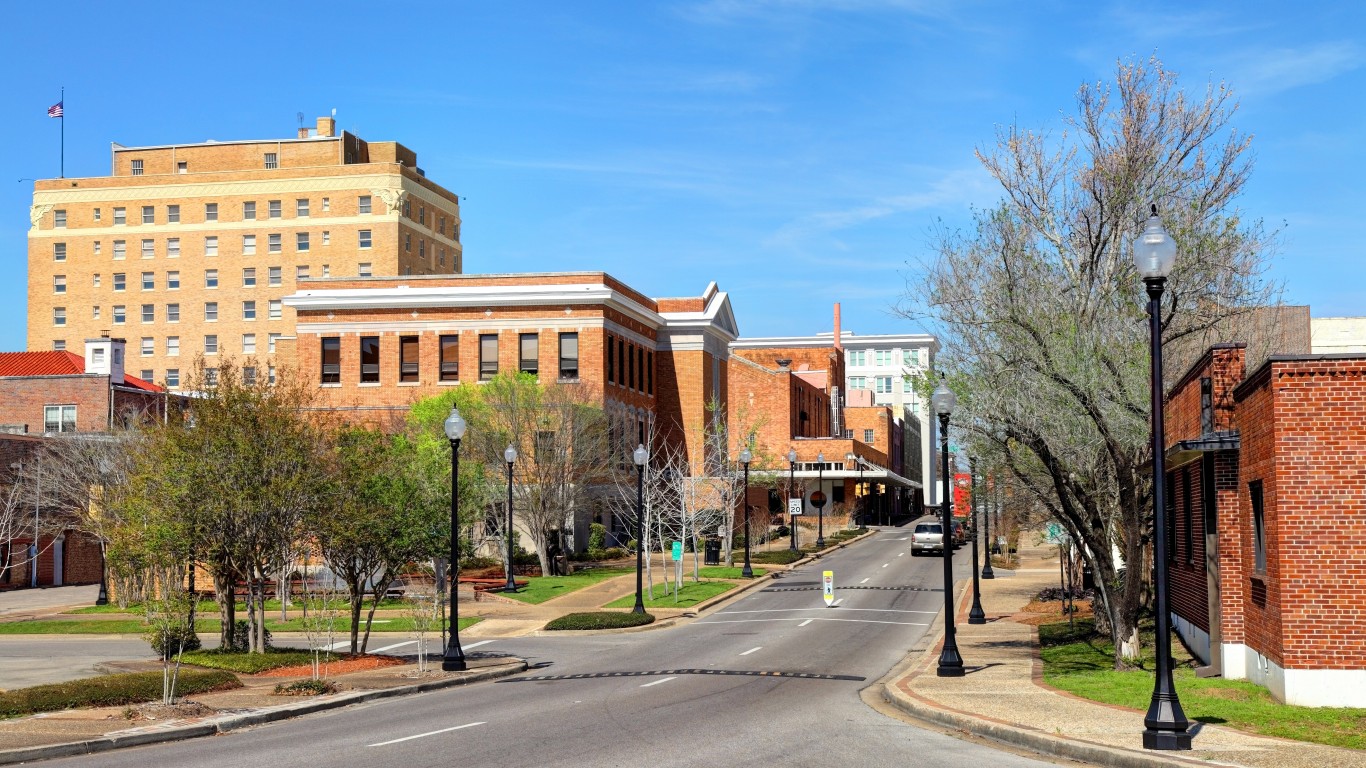
7. Dothan, AL
- Chains as share of all restaurants: 64.2%
- Median household income: $53,704
- Median home value: $175,900
- Total population: 70,699
6. Independence, MO

- Chains as share of all restaurants: 64.4%
- Median household income: $57,415
- Median home value: $150,800
- Total population: 122,218
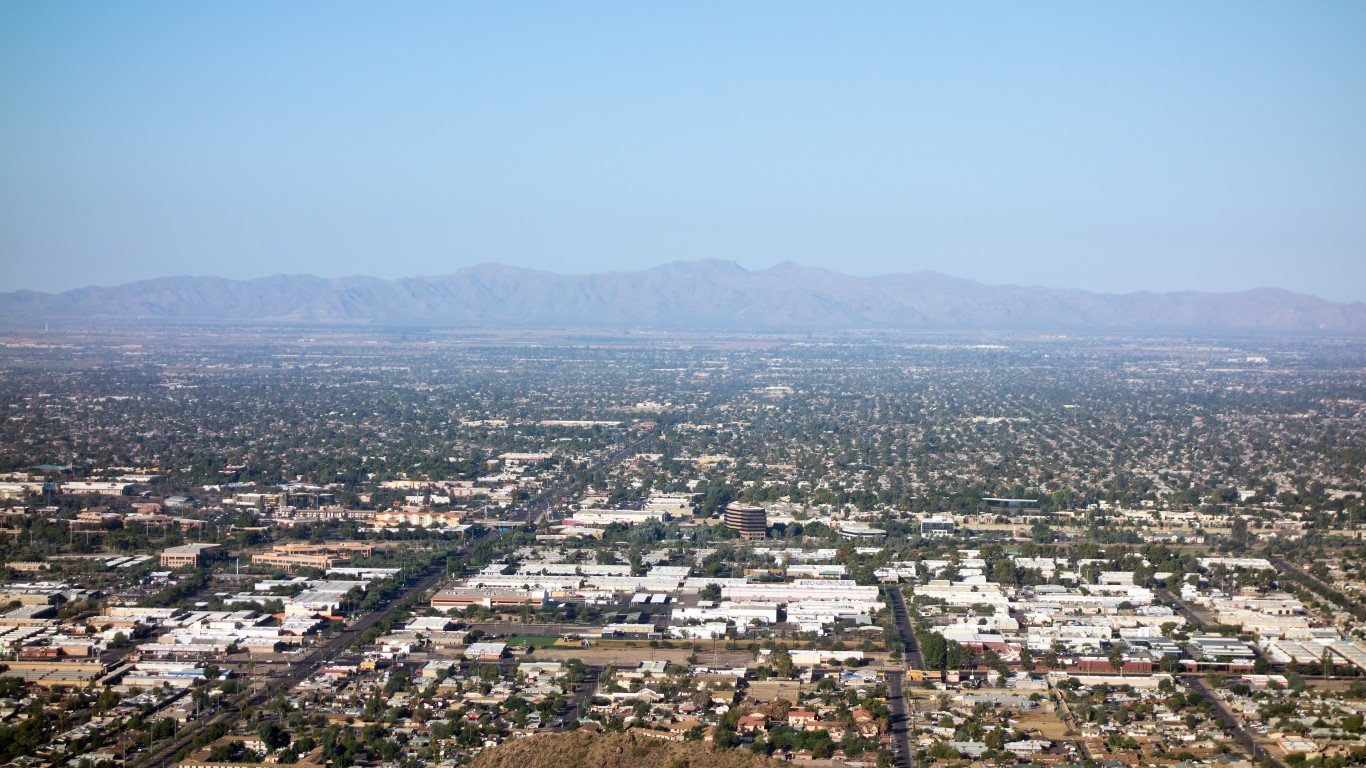
5. Peoria, AZ
- Chains as share of all restaurants: 64.9%
- Median household income: $86,759
- Median home value: $383,600
- Total population: 191,292
4. Pasadena, TX

- Chains as share of all restaurants: 65.2%
- Median household income: $64,698
- Median home value: $171,600
- Total population: 150,620
3. Jacksonville, NC

- Chains as share of all restaurants: 67.4%
- Median household income: $50,185
- Median home value: $176,200
- Total population: 71,908
2. Olathe, KS
- Chains as share of all restaurants: 67.6%
- Median household income: $108,077
- Median home value: $317,900
- Total population: 142,114
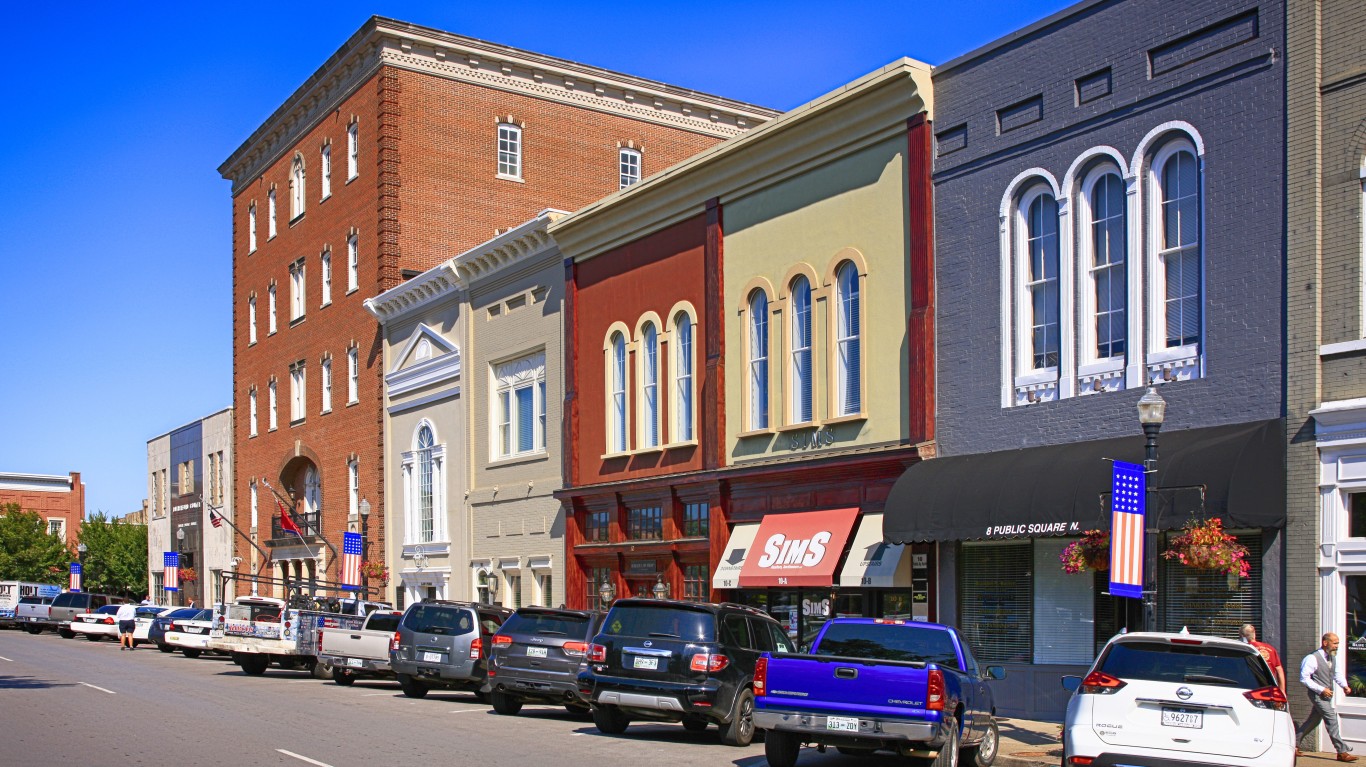
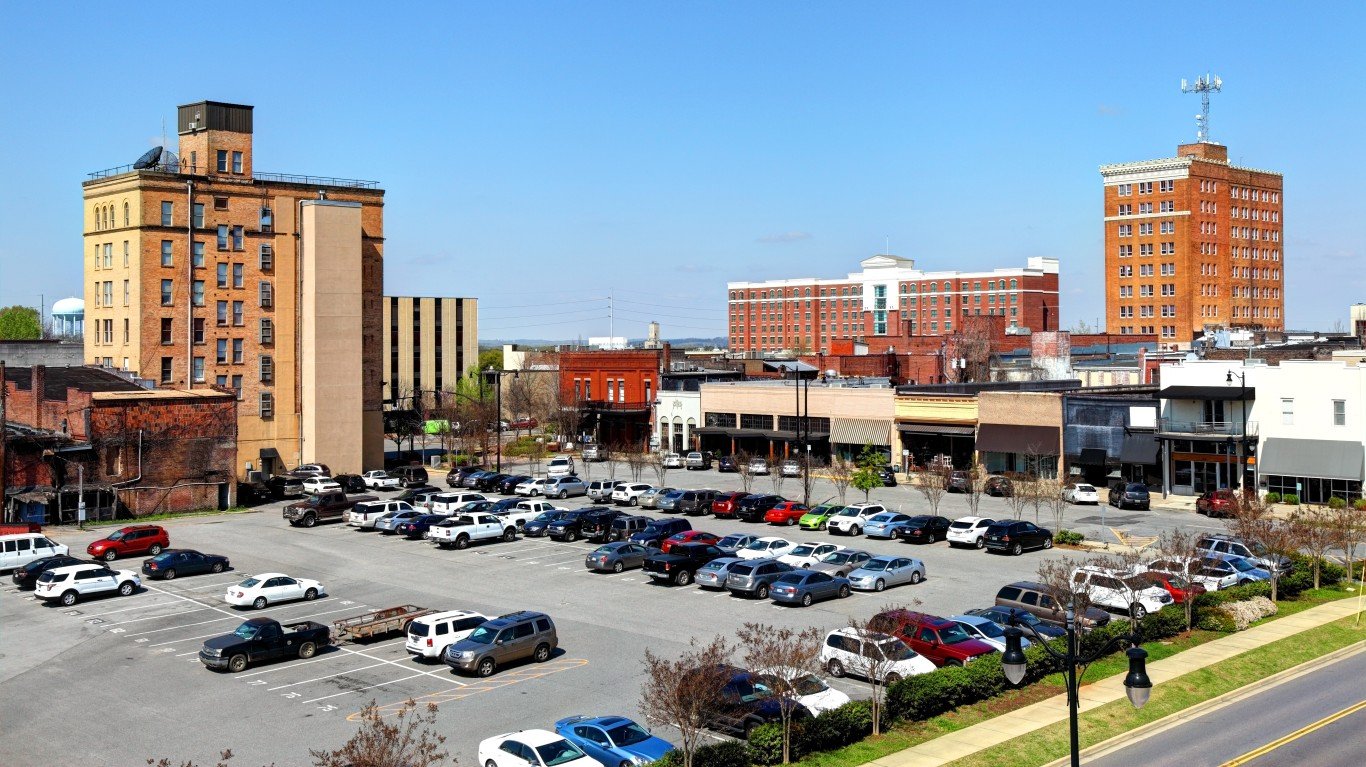
1. Jackson, TN

- Chains as share of all restaurants: 68.6%
- Median household income: $48,058
- Median home value: $169,300
- Total population: 67,993