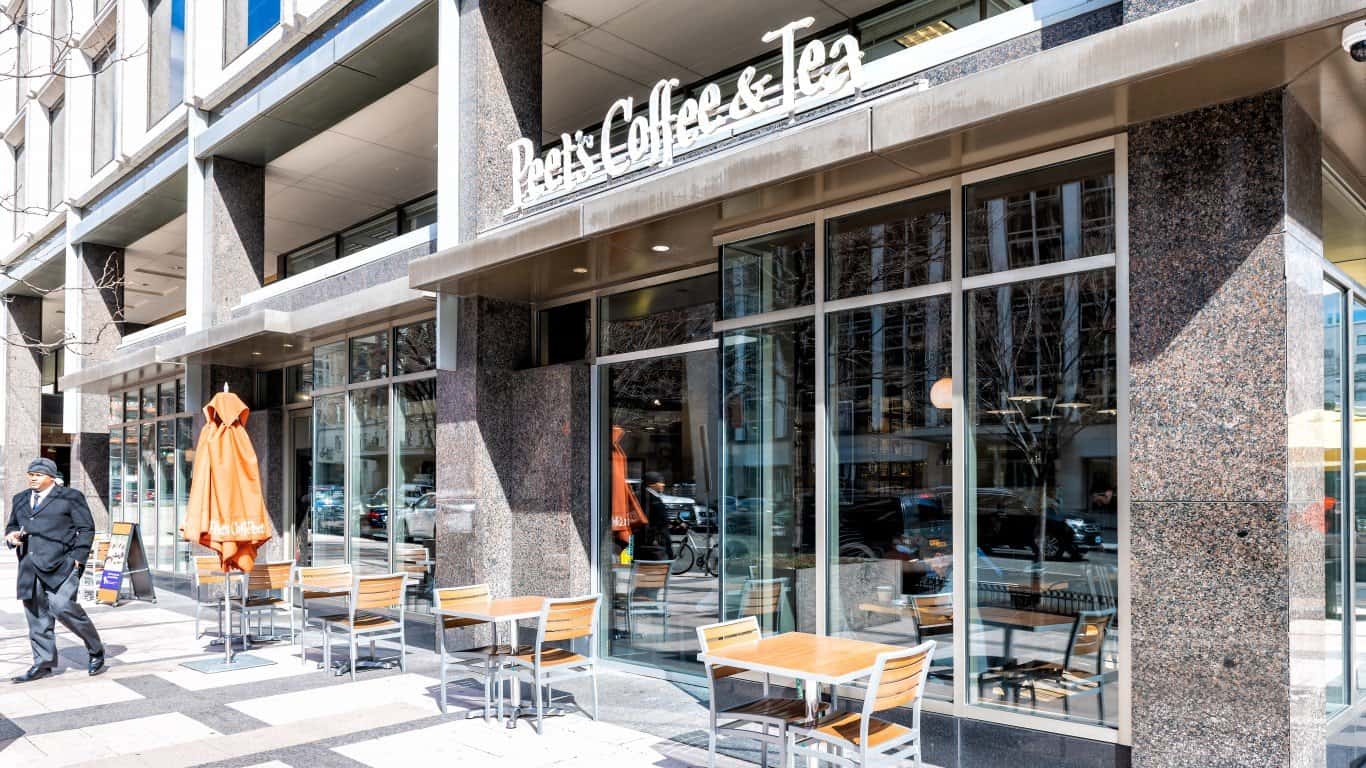
Chain restaurants are a fact of life in America, an unavoidable feature of the urban (and often rural) landscape. The food business digest site FoodIndustry.com estimates that as of last year, there were about 349,000 chain restaurant units across the nation, accounting for almost half of the total number of restaurants. The largest chains in terms of number of locations are Subway, with almost 21,000 units and McDonald’s with about 13,500.
Some cities around the U.S. limit the number of chain units allowed to open, and some jurisdictions ban them altogether. In addition, there is growing opposition around the country to drive-thru locations, which add to air pollution and may cause traffic problems in some places.
The non-profit Institute for Local Self-Reliance, a national community-oriented research and advocacy organization, which states its mission as building “local power to fight corporate control,” notes that “A growing number of cities and towns are enacting policies that restrict the proliferation of ‘formula businesses’ — stores and restaurants that have standardized services, décor, methods of operation, and other features that make them virtually identical to businesses elsewhere.” They are not opposed to chains per se, but to cookie-cutter operations that don’t take into consideration local aesthetics and sensibilities.
They would no doubt be unhappy with those many cities around the country where more than half the restaurants are chain operations. On the other hand, there are also places where the percentage of chains compared to independent eateries is well under 15%.
To determine those cities where the smallest percentage of restaurants are chains, 24/7 Tempo reviewed data from “Measuring McCities: Landscapes of Chain and Independent Restaurants in the United States,” a project of the Friendly Cities Lab at Georgia Tech University.
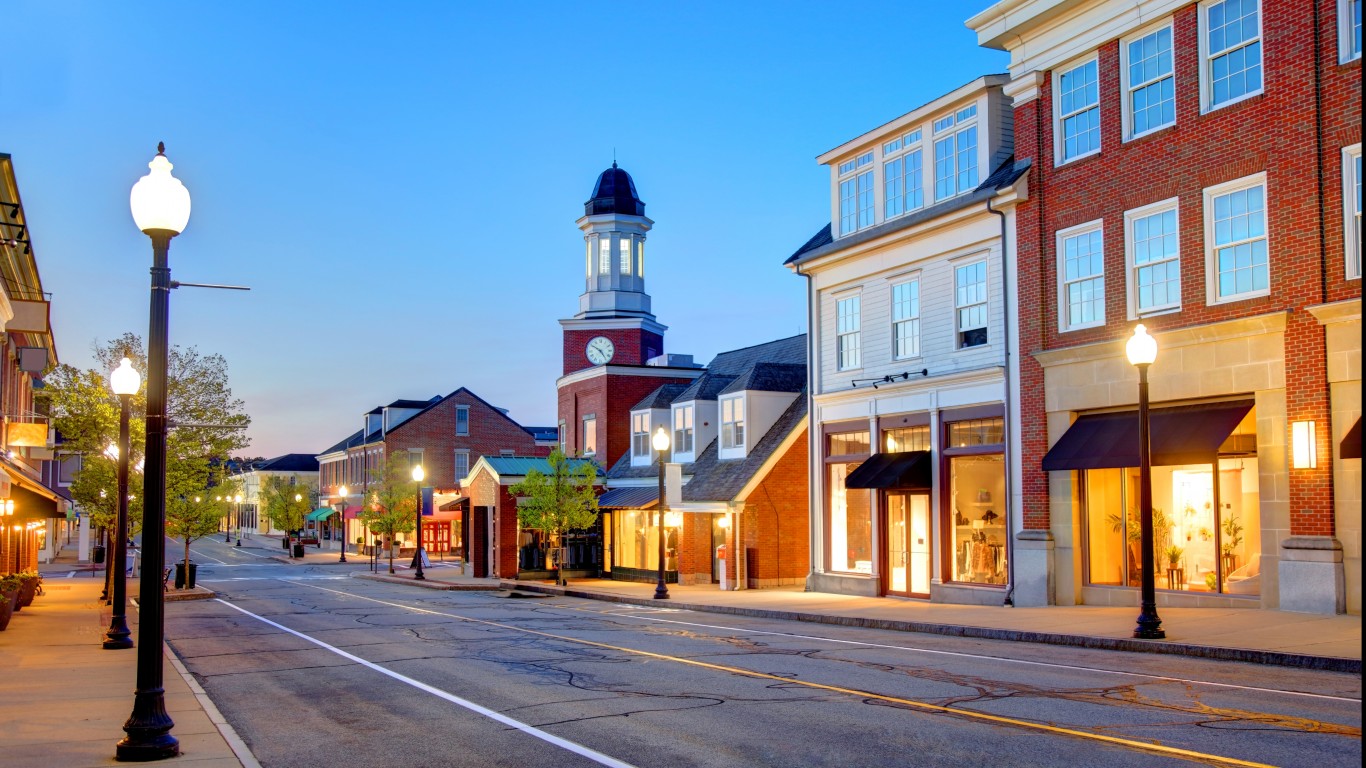
Perhaps not surprisingly, many of the cities on this list are affluent communities, like Santa Barbara and Palm Springs, CA; Coral Gables and Naples, Florida; Hoboken, NJ; and Barnstable Town, MA. Nine of the 50 places on this list, in fact, are in California — a state known for its progressive policies. Hilton Head Island, SC, though, is the city where you might have the hardest time finding a chain restaurant, as only 11.5% of the eating establishments there qualify.
Scroll below to see the cities where the smallest percentage of restaurants are chains:
To determine the cities where the smallest percentage of restaurants are chains, 24/7 Tempo reviewed data on over 750,000 restaurants from “Measuring McCities: Landscapes of Chain and Independent Restaurants in the United States,” a project of the Friendly Cities Lab at Georgia Tech University. Cities were ranked based on the number of chain restaurants as a percentage of all restaurants within their boundaries. Chain restaurants were defined as those with more than five similarly named restaurant establishments nationwide. Raw data on restaurant locations came from LeadsDeposit in April 2021 and were geocoded using the Google Geocoding API. Restaurant locations were then aggregated to the city level using spatial place boundaries from the U.S. Census Bureau. Supplemental data on median household income, median home value, and total population are from the Census Bureau’s 2022 American Community Survey and are five-year estimates. Only cities with at least 150 geocoded restaurant locations were considered.
50. Barnstable Town, MA
- Chains as share of all restaurants: 26.0%
- Median household income: $94,387
- Median home value: $498,700
- Total population: 48,922
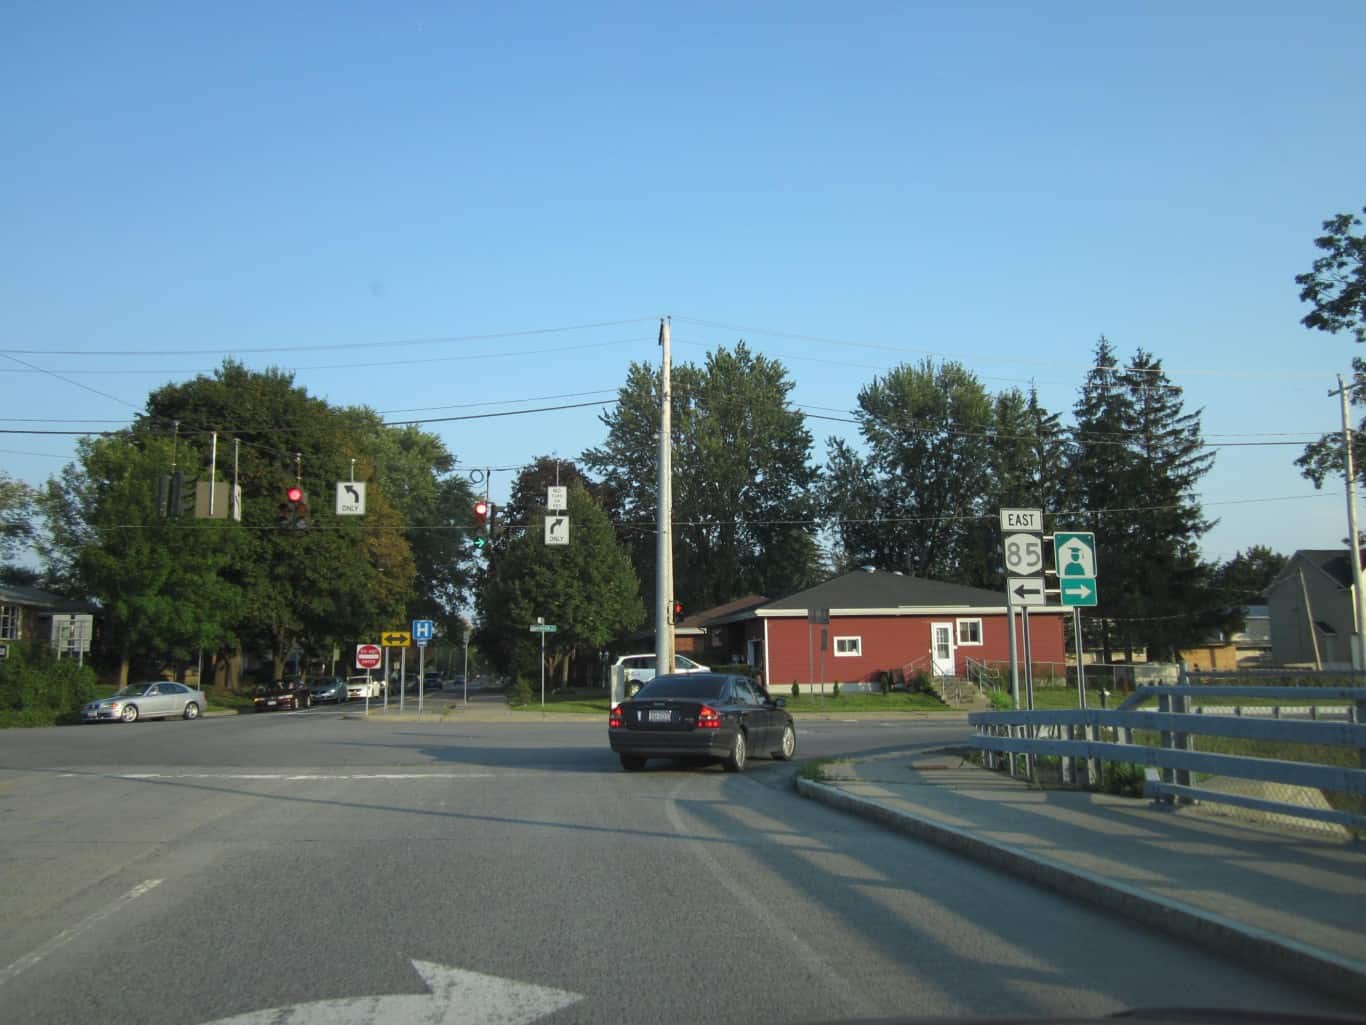
49. Syracuse, NY
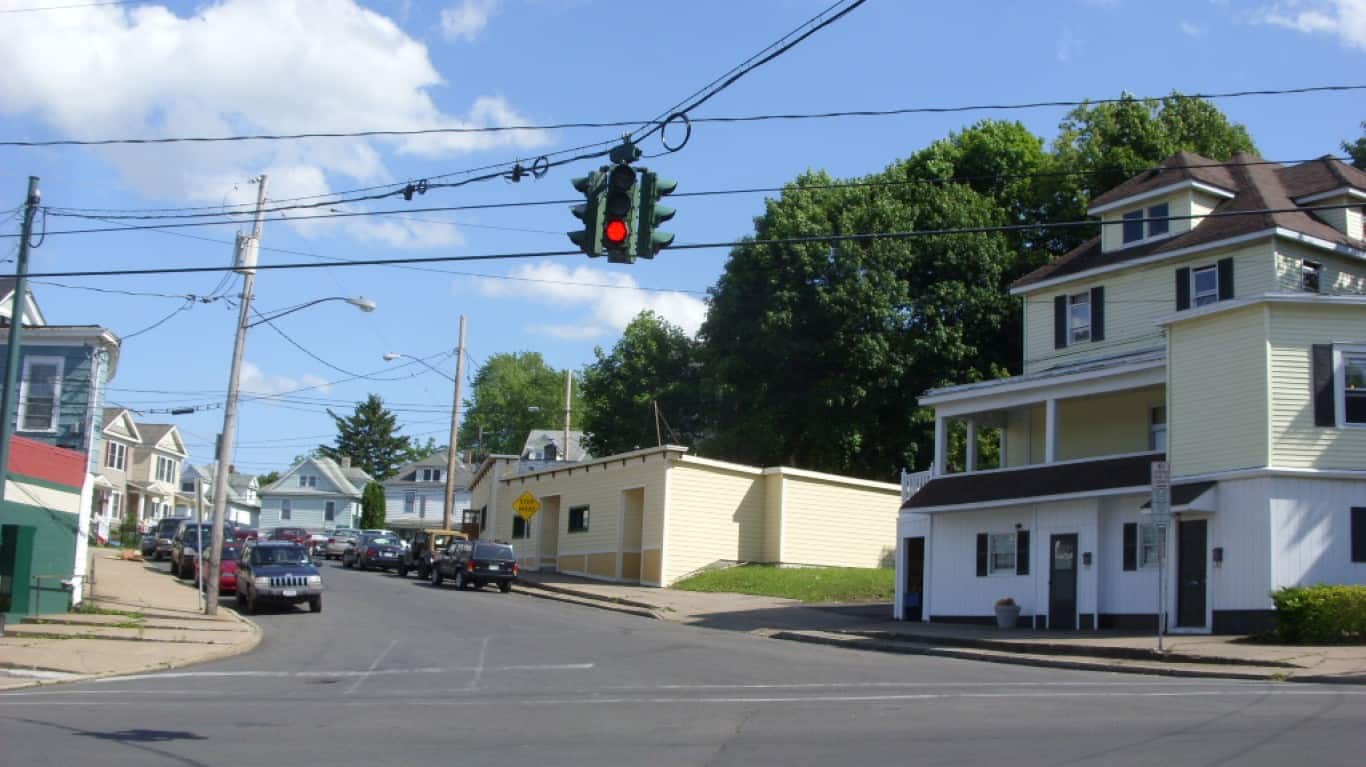
- Chains as share of all restaurants: 25.8%
- Median household income: $43,584
- Median home value: $117,900
- Total population: 146,134
48. Richmond, VA
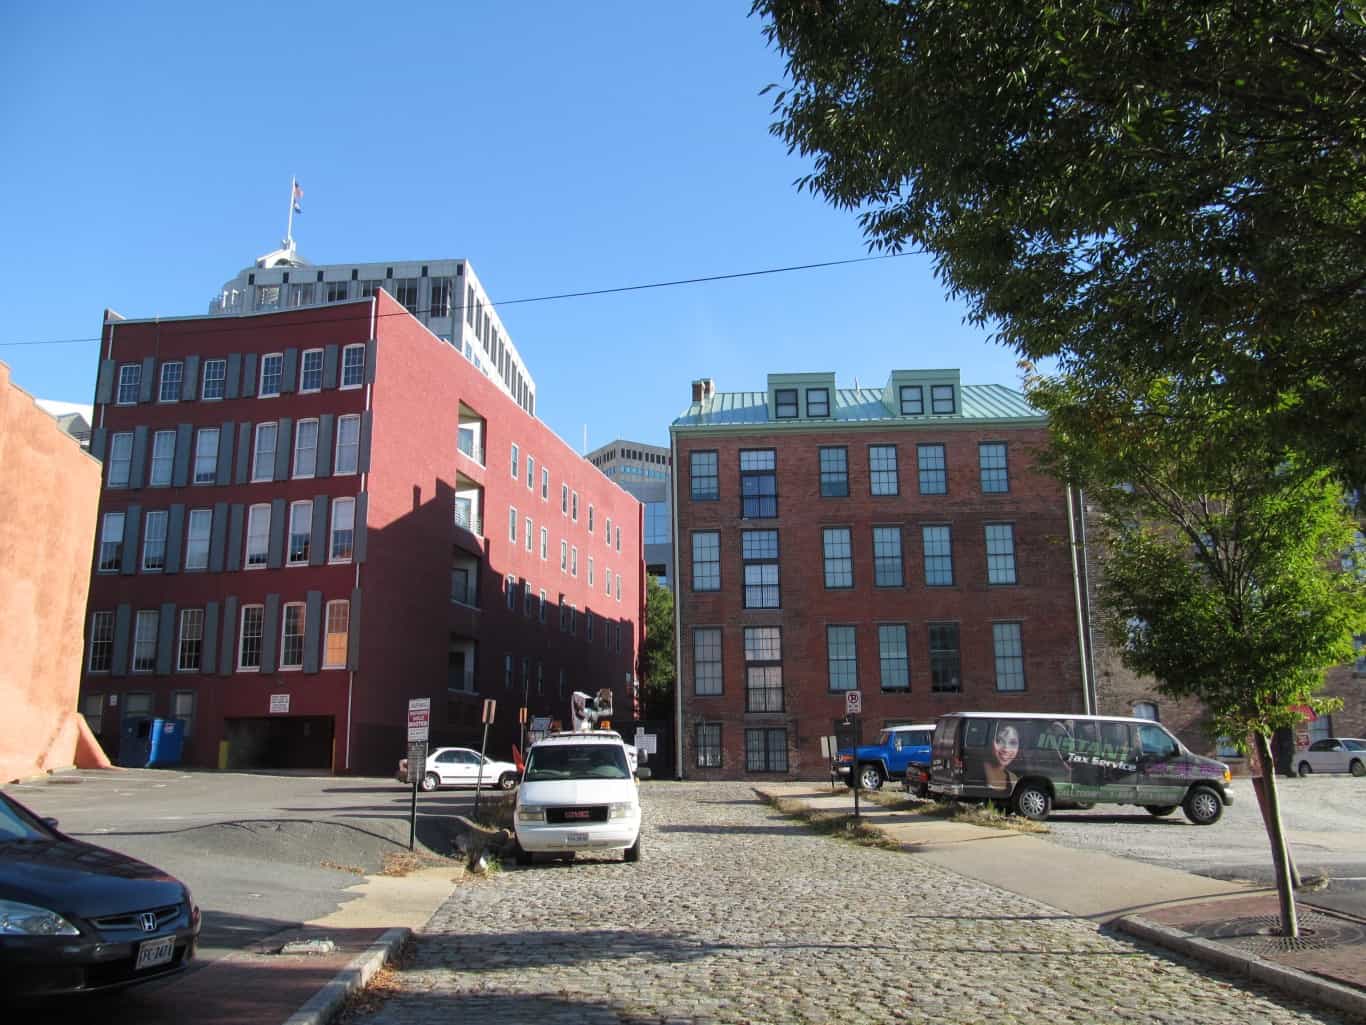
- Chains as share of all restaurants: 25.7%
- Median household income: $59,606
- Median home value: $308,300
- Total population: 227,171
47. Charlottesville, VA
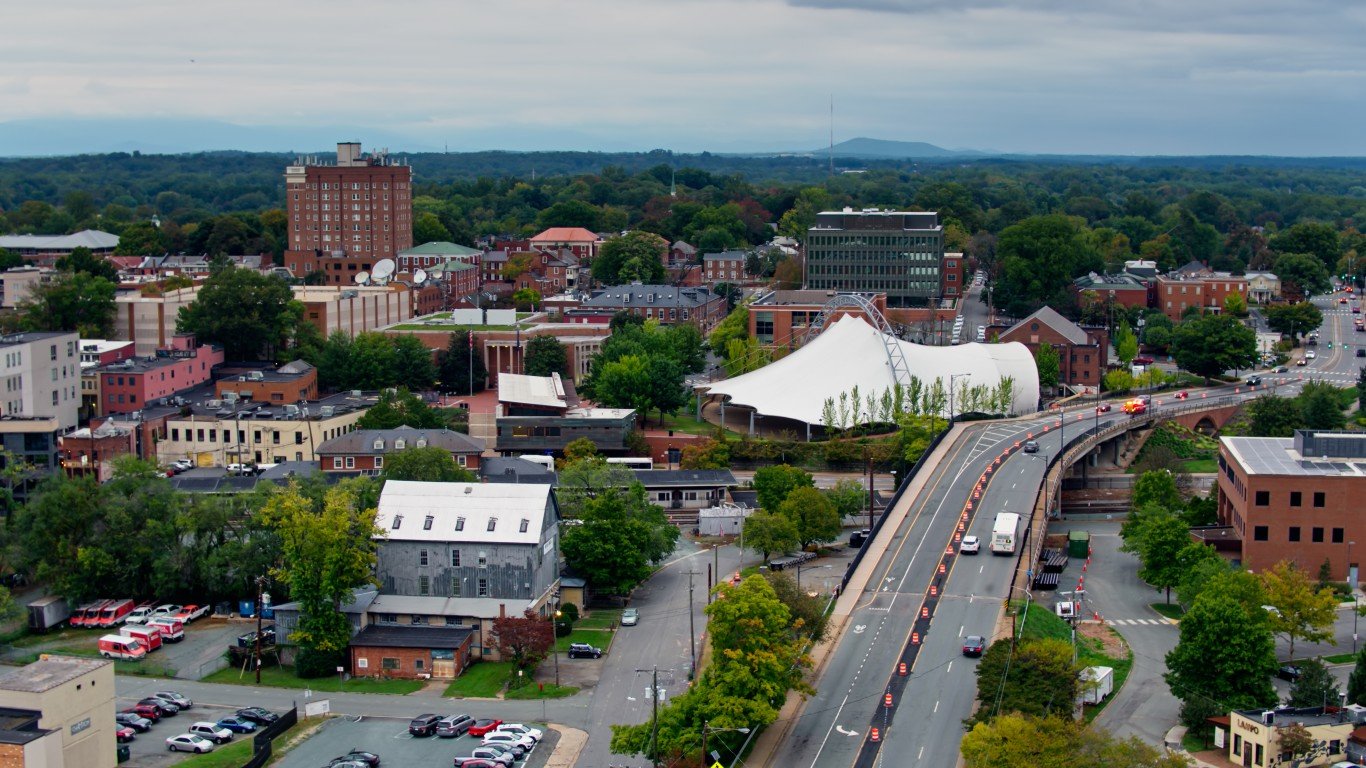
- Chains as share of all restaurants: 25.6%
- Median household income: $67,177
- Median home value: $398,400
- Total population: 46,289
46. White Plains, NY

- Chains as share of all restaurants: 25.5%
- Median household income: $109,551
- Median home value: $612,800
- Total population: 59,421
45. Naples, FL
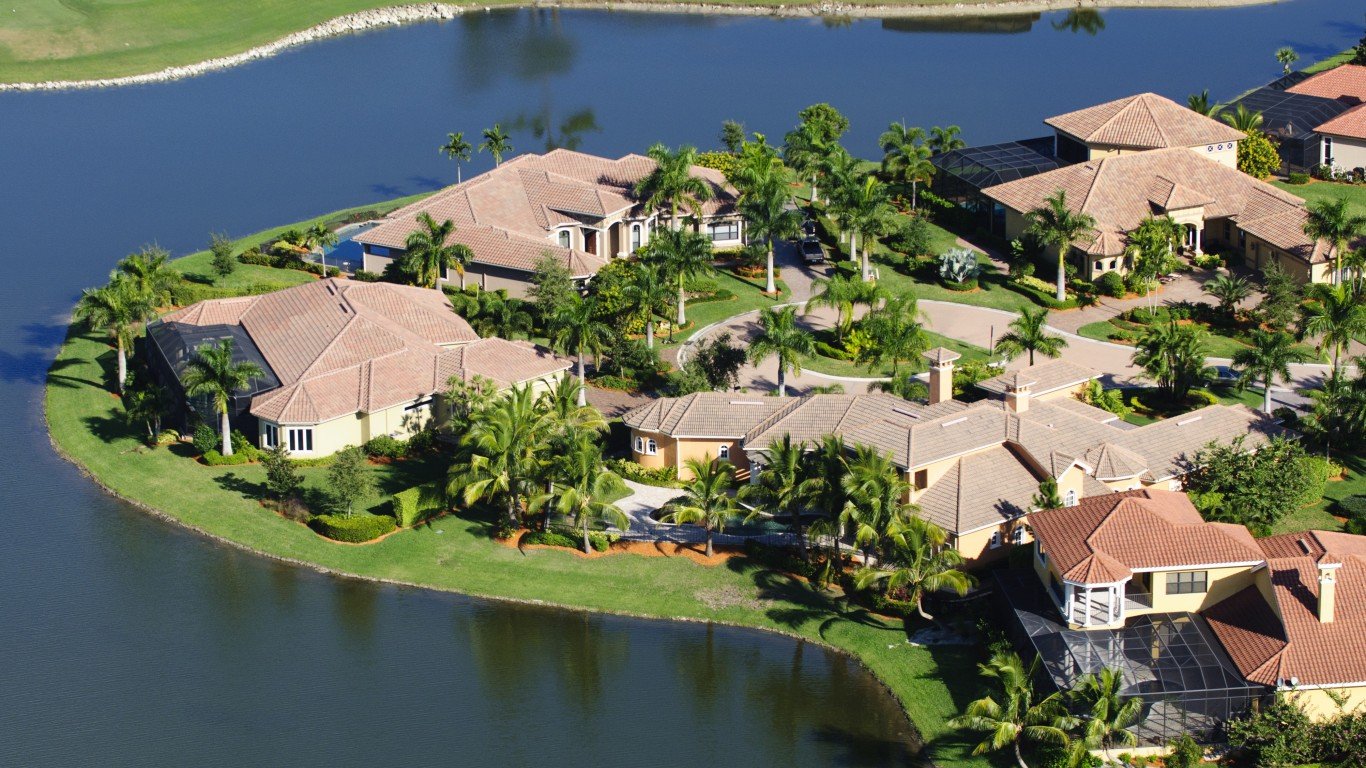
- Chains as share of all restaurants: 25.4% (tie)
- Median household income: $135,657
- Median home value: $1,200,100
- Total population: 19,315
44. Jersey City, NJ

- Chains as share of all restaurants: 25.4% (tie)
- Median household income: $91,151
- Median home value: $500,100
- Total population: 287,899
43. Palm Springs, CA

- Chains as share of all restaurants: 25.0% (tie)
- Median household income: $67,451
- Median home value: $504,700
- Total population: 44,935
42. Santa Fe, NM

- Chains as share of all restaurants: 25.0% (tie)
- Median household income: $67,663
- Median home value: $370,600
- Total population: 87,617
41. Providence, RI

- Chains as share of all restaurants: 24.9% (tie)
- Median household income: $61,365
- Median home value: $293,000
- Total population: 189,715
40. Charleston, SC
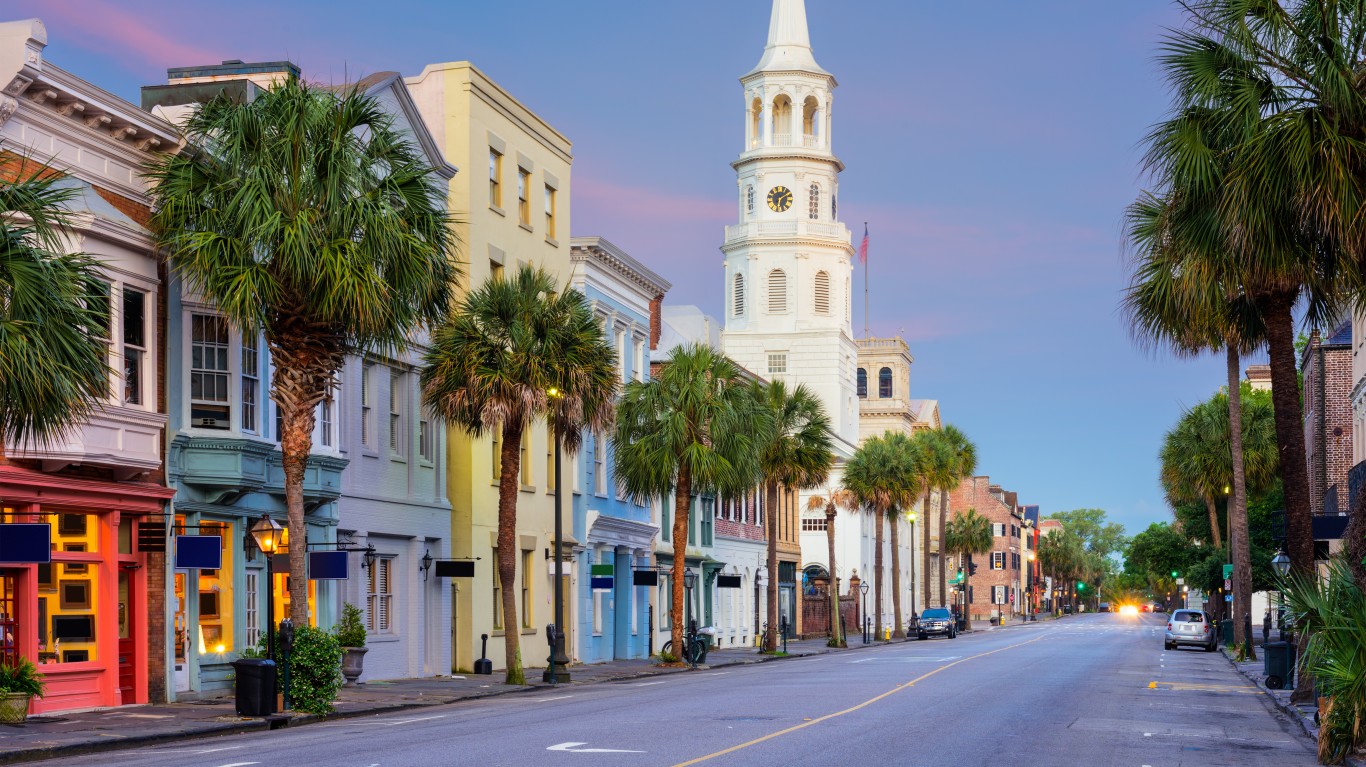
- Chains as share of all restaurants: 24.9% (tie)
- Median household income: $83,891
- Median home value: $438,900
- Total population: 149,960
39. Albany, NY
- Chains as share of all restaurants: 24.9% (tie)
- Median household income: $54,736
- Median home value: $213,400
- Total population: 99,692
38. Philadelphia, PA

- Chains as share of all restaurants: 24.8%
- Median household income: $57,537
- Median home value: $215,500
- Total population: 1,593,208
37. St. Louis, MO

- Chains as share of all restaurants: 24.5%
- Median household income: $52,941
- Median home value: $174,100
- Total population: 298,018
36. Scranton, PA
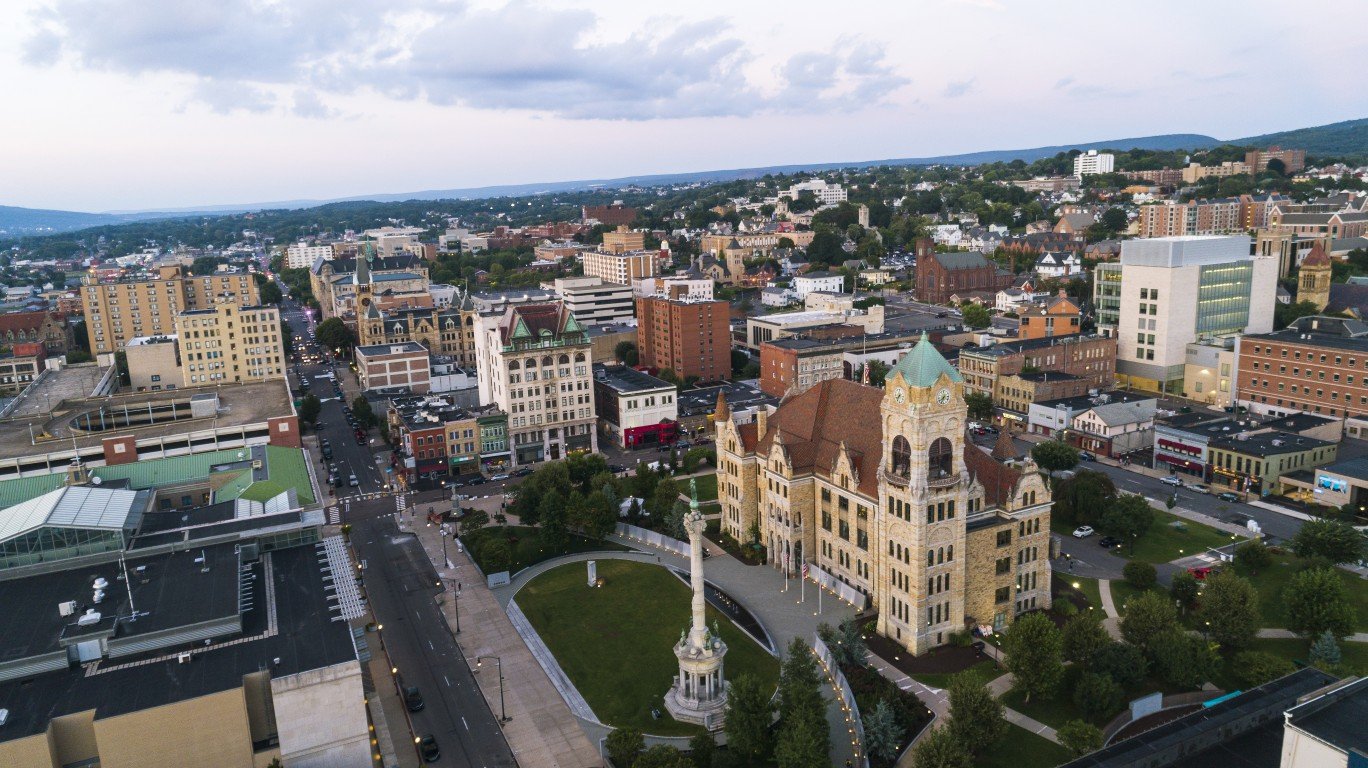
- Chains as share of all restaurants: 24.4%
- Median household income: $48,776
- Median home value: $125,700
- Total population: 76,119
35. Minneapolis, MN

- Chains as share of all restaurants: 24.2%
- Median household income: $76,332
- Median home value: $328,700
- Total population: 426,877
34. Santa Barbara, CA
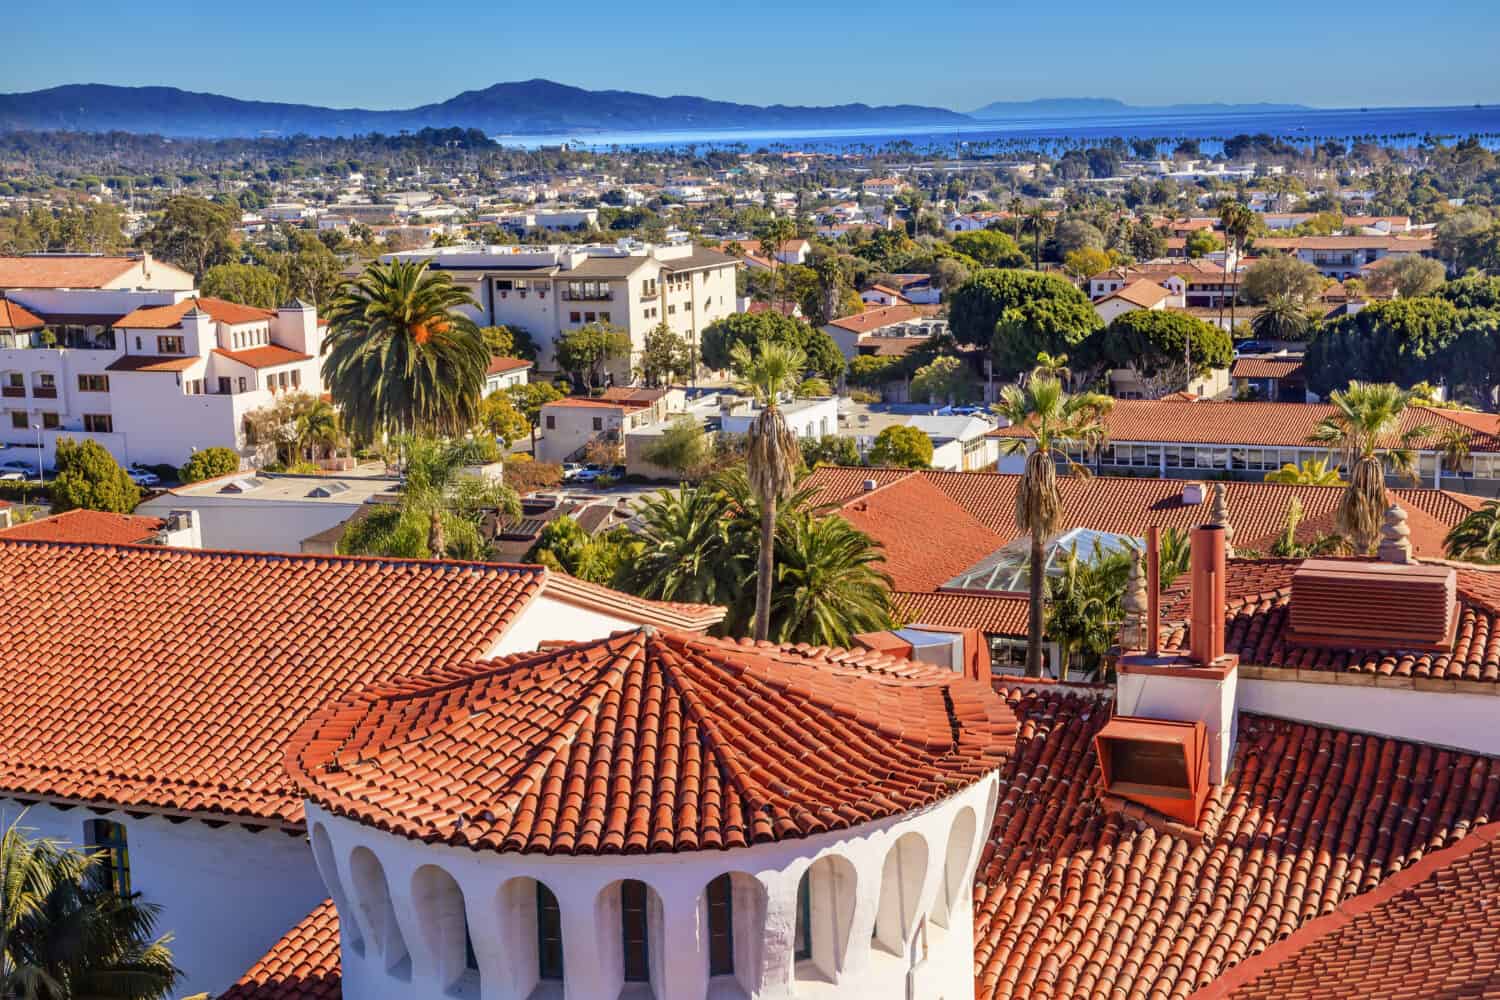
- Chains as share of all restaurants: 24.0%
- Median household income: $98,346
- Median home value: $1,346,800
- Total population: 88,640
33. Boulder, CO

- Chains as share of all restaurants: 23.9%
- Median household income: $80,243
- Median home value: $919,700
- Total population: 106,598
32. Paterson, NJ

- Chains as share of all restaurants: 23.6%
- Median household income: $52,092
- Median home value: $314,100
- Total population: 157,864
31. Pittsburgh, PA

- Chains as share of all restaurants: 23.5%
- Median household income: $60,187
- Median home value: $171,800
- Total population: 303,843
30. Coral Gables, FL
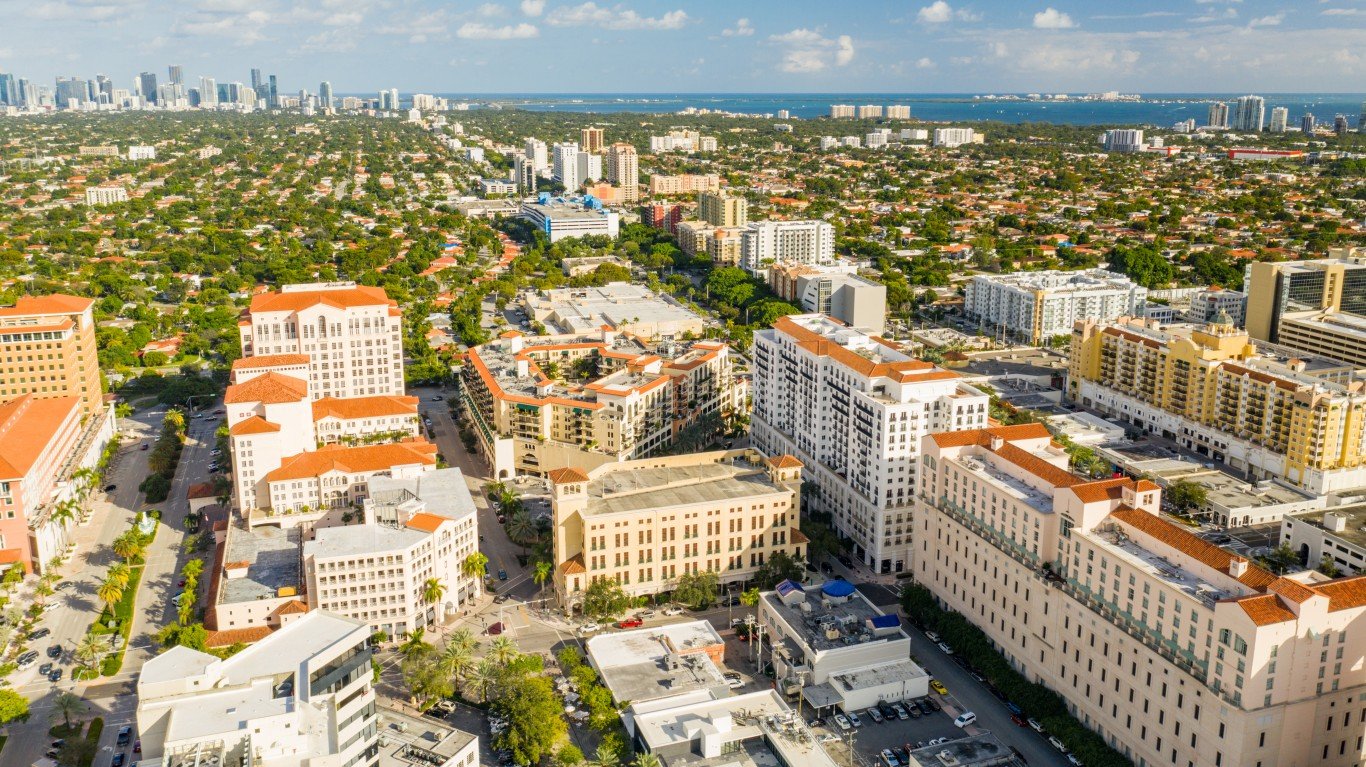
- Chains as share of all restaurants: 23.3%
- Median household income: $118,203
- Median home value: $952,000
- Total population: 49,696
29. Norwalk, CT

- Chains as share of all restaurants: 23.2% (tie)
- Median household income: $97,879
- Median home value: $491,800
- Total population: 91,050
28. Bridgeport, CT

- Chains as share of all restaurants: 23.2% (tie)
- Median household income: $54,440
- Median home value: $227,200
- Total population: 148,470
27. Buffalo, NY
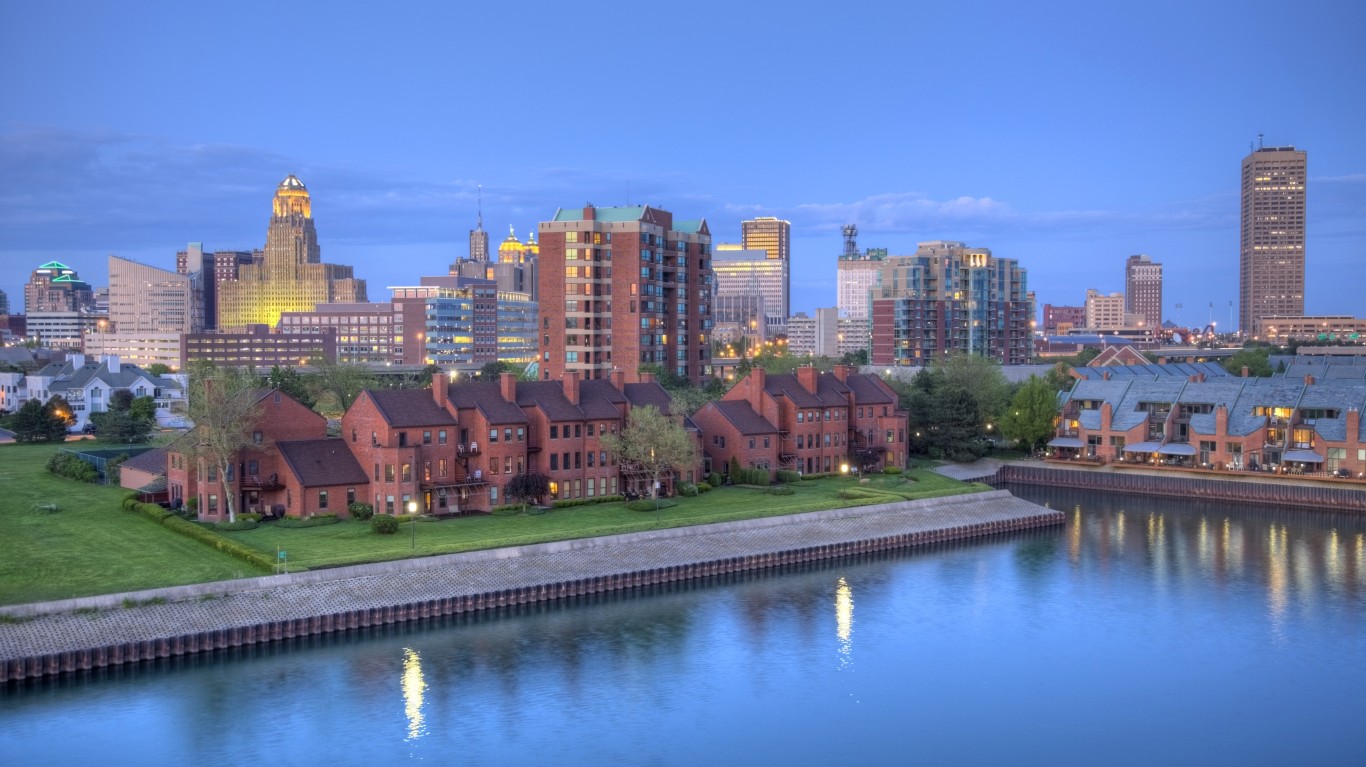
- Chains as share of all restaurants: 23.1%
- Median household income: $46,184
- Median home value: $132,100
- Total population: 276,688
26. New York, NY

- Chains as share of all restaurants: 23.0%
- Median household income: $76,607
- Median home value: $732,100
- Total population: 8,622,467
25. New Haven, CT

- Chains as share of all restaurants: 22.3%
- Median household income: $54,305
- Median home value: $236,500
- Total population: 135,736
24. San Luis Obispo, CA
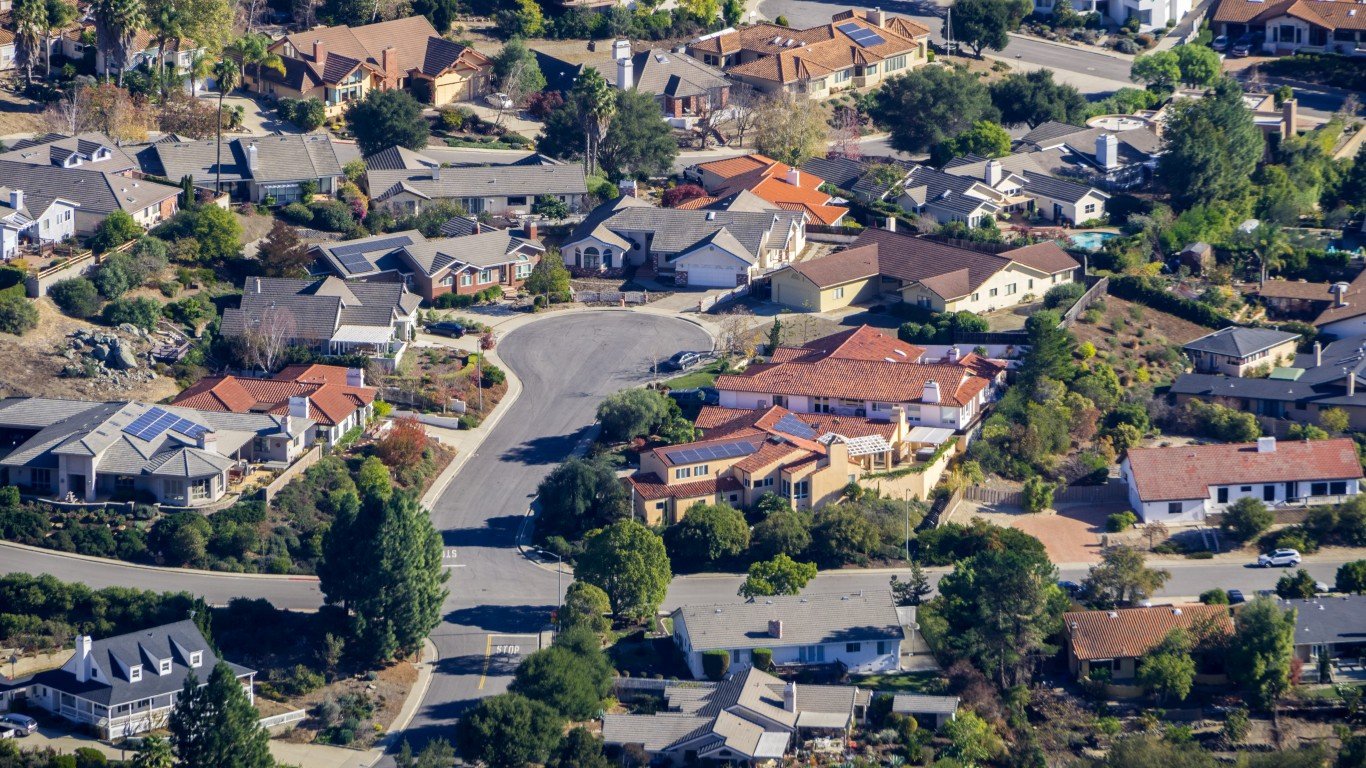
- Chains as share of all restaurants: 22.2%
- Median household income: $65,000
- Median home value: $841,700
- Total population: 47,529
23. Stamford, CT

- Chains as share of all restaurants: 22.1%
- Median household income: $100,718
- Median home value: $584,700
- Total population: 135,413
22. Miami, FL

- Chains as share of all restaurants: 21.6%
- Median household income: $54,858
- Median home value: $433,900
- Total population: 443,665
21. Urban Honolulu, HI

- Chains as share of all restaurants: 21.2%
- Median household income: $82,772
- Median home value: $805,500
- Total population: 348,547
20. Portland, OR

- Chains as share of all restaurants: 20.5%
- Median household income: $85,876
- Median home value: $523,100
- Total population: 646,101
19. Santa Cruz, CA
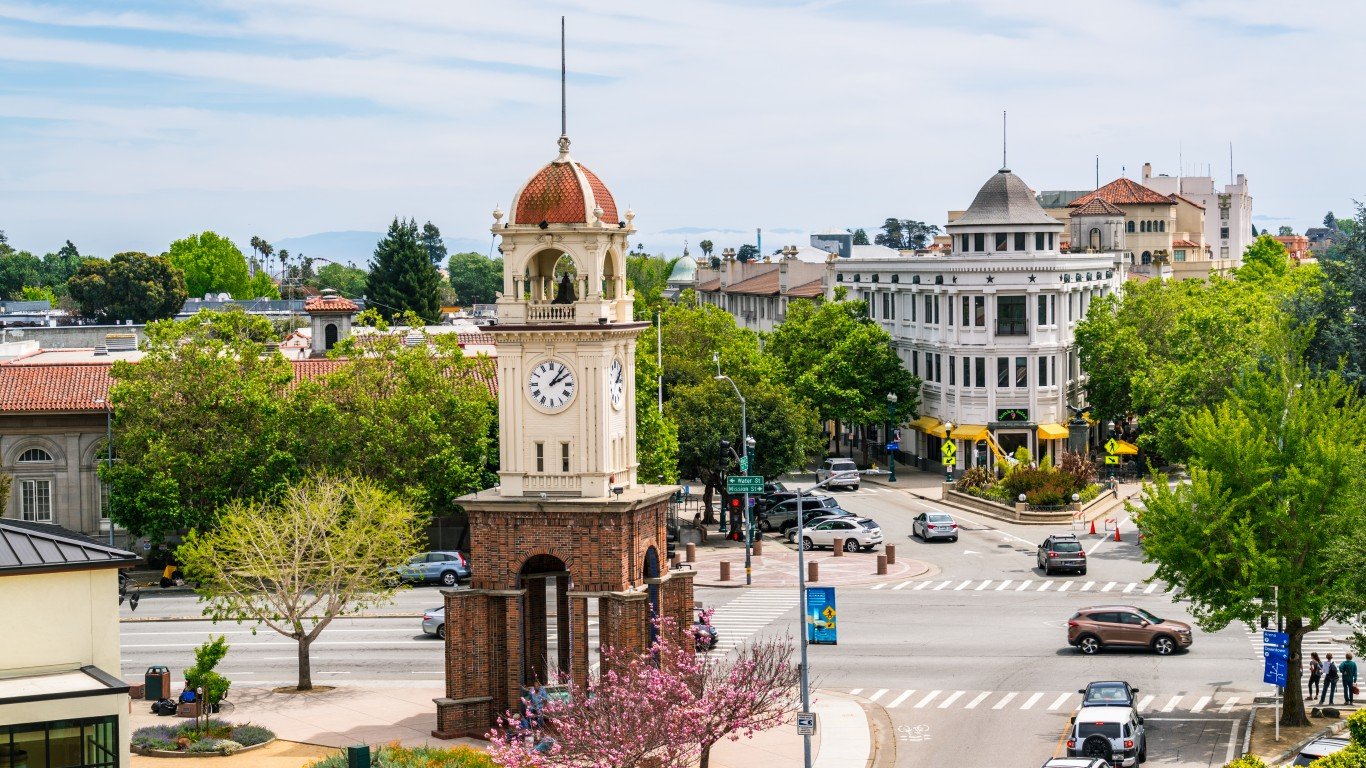
- Chains as share of all restaurants: 20.3% (tie)
- Median household income: $105,491
- Median home value: $1,116,100
- Total population: 61,367
18. New Orleans, LA

- Chains as share of all restaurants: 20.3% (tie)
- Median household income: $51,116
- Median home value: $281,500
- Total population: 380,408
17. Hoboken, NJ
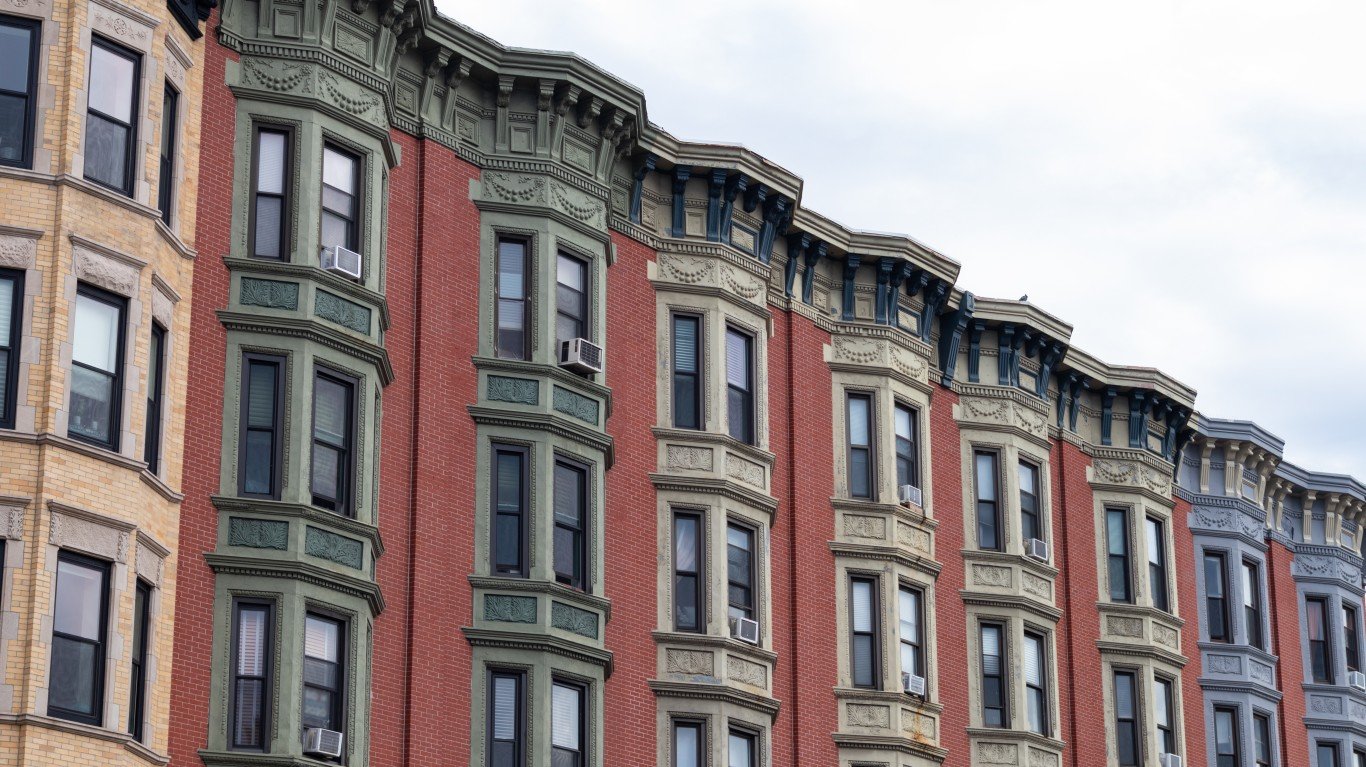
- Chains as share of all restaurants: 20.3% (tie)
- Median household income: $168,137
- Median home value: $859,300
- Total population: 58,754
16. Sarasota, FL

- Chains as share of all restaurants: 20.2% (tie)
- Median household income: $68,870
- Median home value: $372,000
- Total population: 55,508
15. Oakland, CA
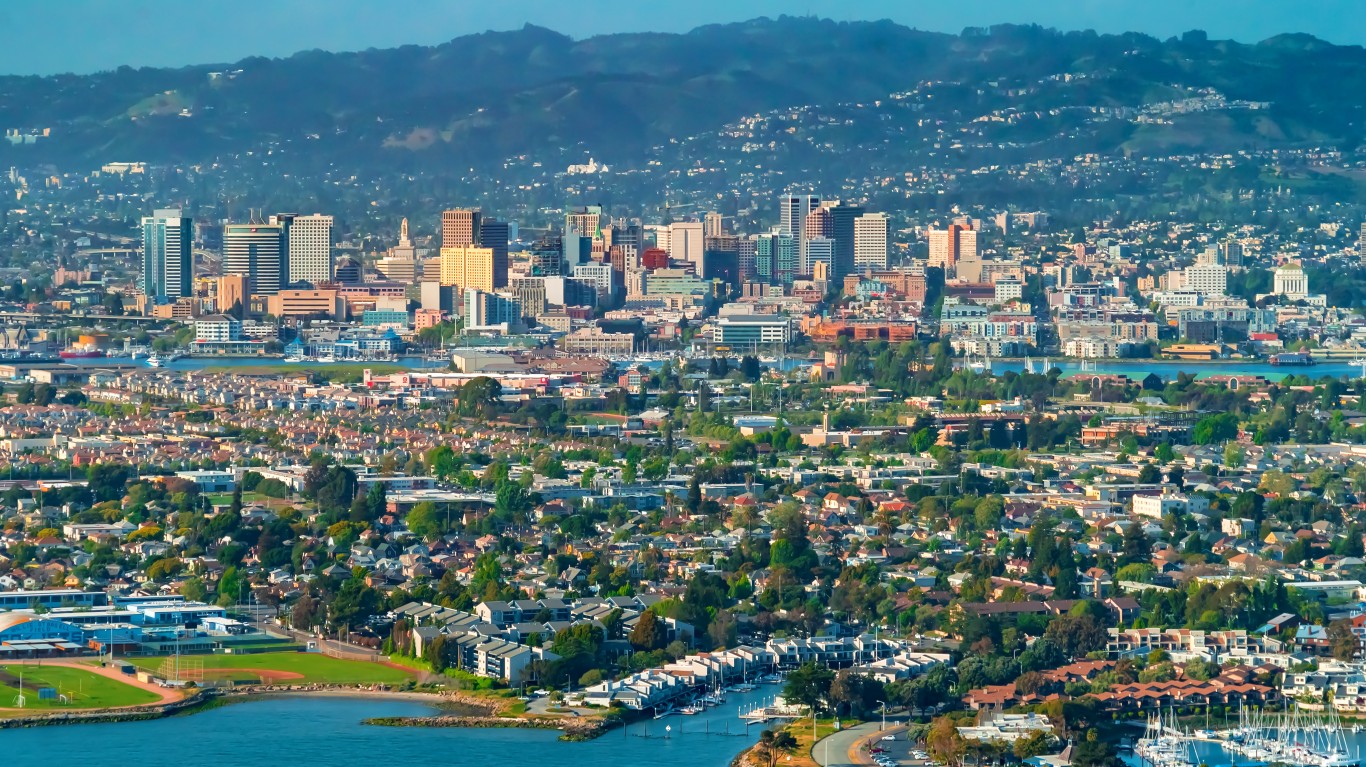
- Chains as share of all restaurants: 20.2% (tie)
- Median household income: $94,389
- Median home value: $883,800
- Total population: 437,825
14. West Hollywood, CA

- Chains as share of all restaurants: 19.9%
- Median household income: $89,034
- Median home value: $898,900
- Total population: 35,358
13. Atlantic City, NJ

- Chains as share of all restaurants: 19.3%
- Median household income: $35,188
- Median home value: $174,200
- Total population: 38,487
12. Rochester, NY

- Chains as share of all restaurants: 18.8%
- Median household income: $44,156
- Median home value: $111,400
- Total population: 210,992
11. Hilo, HI

- Chains as share of all restaurants: 18.2% (tie)
- Median household income: $75,589
- Median home value: $417,600
- Total population: 47,627
10. Seattle, WA

- Chains as share of all restaurants: 18.2% (tie)
- Median household income: $116,068
- Median home value: $879,900
- Total population: 734,603
9. St. Augustine, FL

- Chains as share of all restaurants: 17.6% (tie)
- Median household income: $72,806
- Median home value: $355,400
- Total population: 14,642
8. Somerville, MA

- Chains as share of all restaurants: 17.6% (tie)
- Median household income: $120,778
- Median home value: $860,500
- Total population: 80,464
7. Beverly Hills, CA
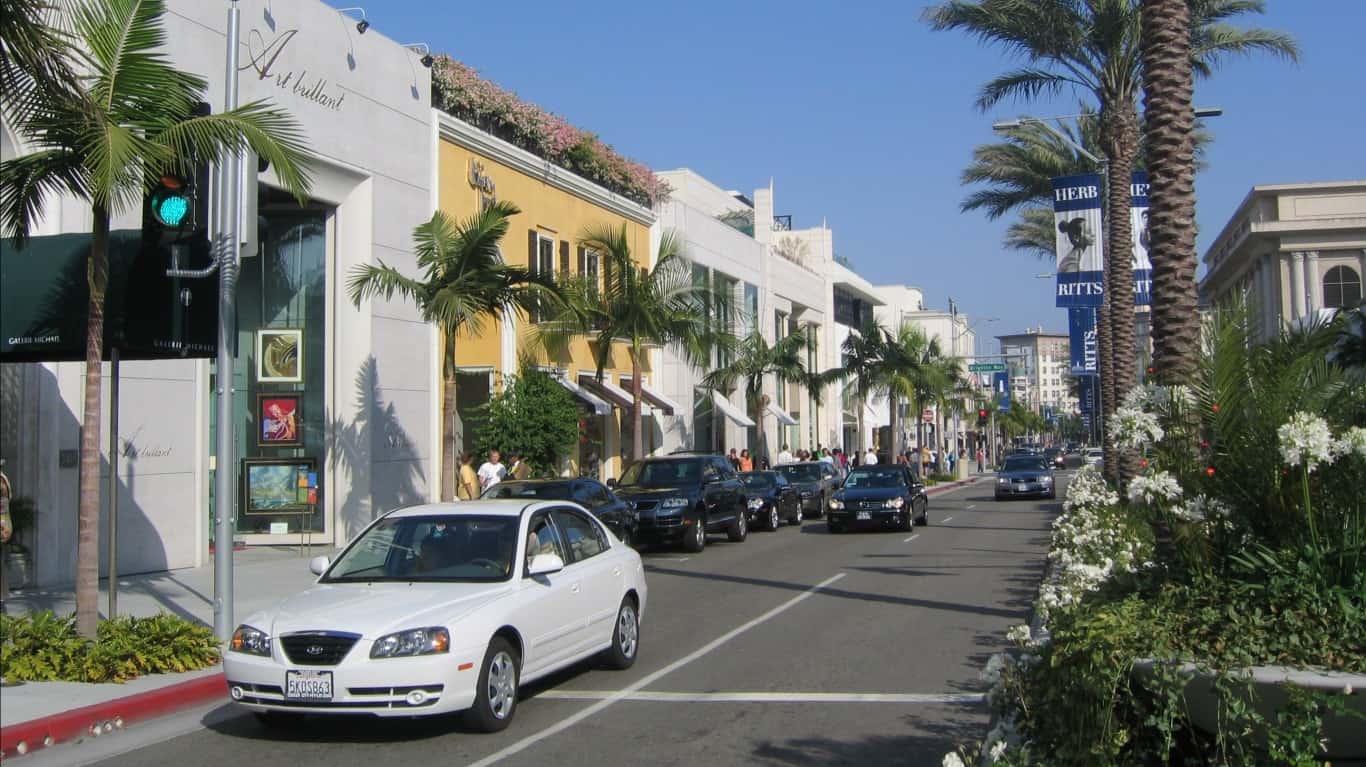
- Chains as share of all restaurants: 16.8%
- Median household income: $116,771
- Median home value: $2,000,000
- Total population: 32,406
6. Berkeley, CA

- Chains as share of all restaurants: 15.3%
- Median household income: $104,716
- Median home value: $1,280,300
- Total population: 121,385
5. San Francisco, CA

- Chains as share of all restaurants: 15.0%
- Median household income: $136,689
- Median home value: $1,348,700
- Total population: 851,036
4. Portland, ME

- Chains as share of all restaurants: 14.0%
- Median household income: $71,498
- Median home value: $411,600
- Total population: 68,280
3. Miami Beach, FL
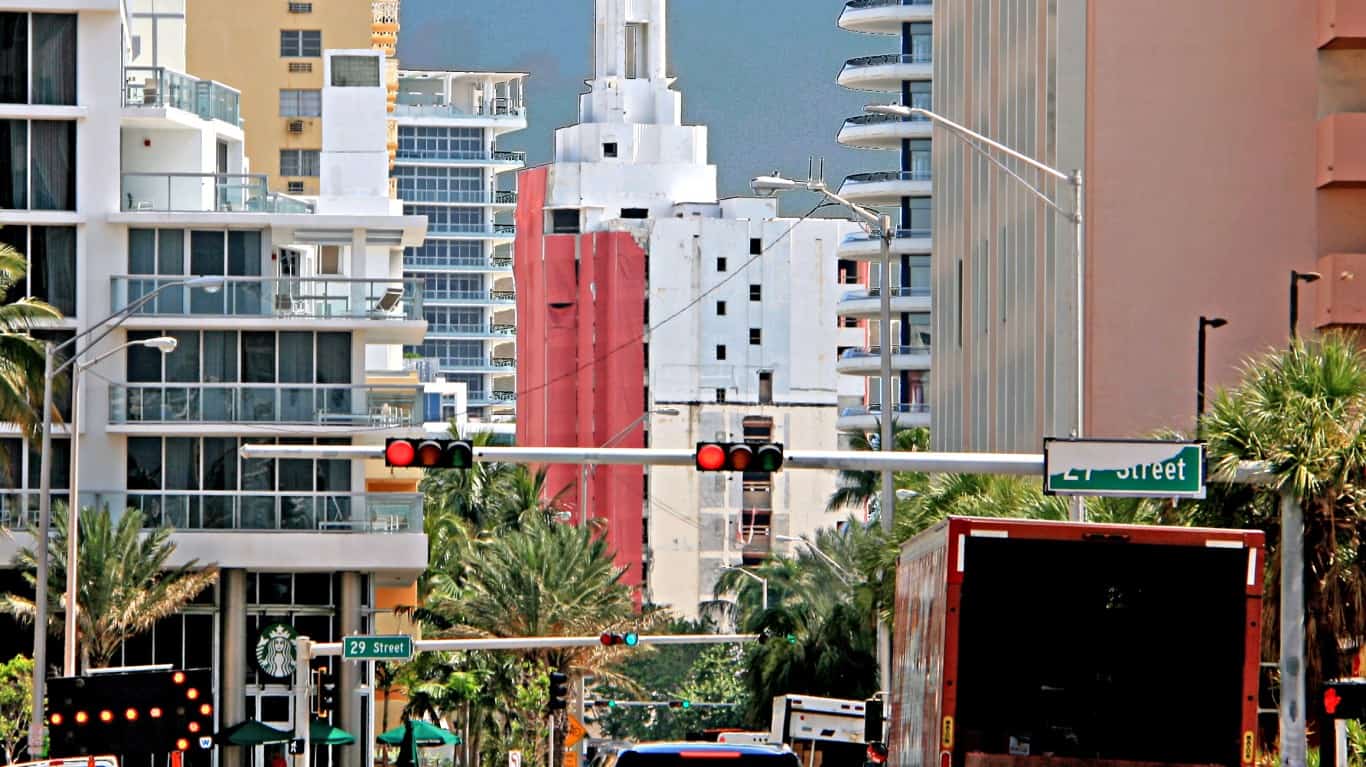
- Chains as share of all restaurants: 13.3%
- Median household income: $65,116
- Median home value: $532,300
- Total population: 82,400
2. Key West, FL

- Chains as share of all restaurants: 12.1%
- Median household income: $80,828
- Median home value: $814,200
- Total population: 26,078
1. Hilton Head Island, SC

- Chains as share of all restaurants: 11.5%
- Median household income: $93,694
- Median home value: $589,000
- Total population: 37,708