
Rawf8 / iStock via Getty Images

Stefan Zaklin / Getty Images

Getty Images / Getty Images News via Getty Images

Douglas Rissing / iStock via Getty Images
Roger L. Wollenberg-Pool / Getty Images

KIVILCIM PINAR / Getty Images

PRUDENCIOALVAREZ / iStock via Getty Images
Mr Doomits / Shutterstock.com

Dan Rentea / iStock via Getty Images

Melinda Nagy / Shutterstock.com


Fundamental Trust Issues: This Institution Ranks Lowest Among Americans
Over the years, many polls have shown exactly what Americans think about the nation's various institutions, from banks, higher education, and the political system to organized religion, the medical system, and big business and, well, it's not good.Since the 1960s, when rankings tended on the higher side, there has been a steady decline, with the peak of trust in 1964, and it's been declining ever since.
The Gallup Poll is an American multinational analytics and advisory company that became known for its public opinion polls. Founded by George Gallup in 1935 as the American Institute of Public Opinion (later becoming Gallup), the first poll took place when the Social Security Act passed after 89% of Americans admitted they'd support an "old-age pension for the needy."
Overall, Americans' confidence and trust in their institutions remain at a historic low, with one in particular at an all-time low. Only one agency saw an increase from 2023: law enforcement. Democrats, Independents, and Republicans reported higher confidence in this particular institution at 45%, 49%, and 62%, respectively, compared to the previous year's approval ratings of 40%, 37%, and 60%.
This post was updated July 13th, 2025, to reflect additional information.
Americans Trust This Institution the Least: The U.S. Congress
While there are few institutions Americans trust, the loss of trust in the U.S. Congress is evident. More than half of Americans responding to the 2024 Gallup Poll reported having little trust in Congress. Check out the exact percentages below, ranked by percentage from high to low.
- 57% have "Very Little" trust;
- 31% have "Some" trust;
- 5% have "Quite a Lot" of trust;
- 4% have a "Great Deal" of trust;
- 3% have no trust at all.
Who Makes Up the Congress?
Who is behind the mistrust? The U.S. Congress is made up of two senators from each state (100 in all) and the 435 voting members of the House of Representatives.
Representatives:Elections for House members run every two years, and those elected officials must be at least 25 years old and can be immigrants as long as they've been U.S. citizens for seven years or more. Voters choose new representatives every two years because these elected officials are supposed to listen closely to the constituents and influence policies based on what the people want.
Senators:Every six years, elections for senators take place. Senators must have been U.S. citizens for nine years or longer and must be 30 or older. They have longer terms because they're more experienced and know how to avoid making policies based on current trends versus years of political experience. They still listen to constituents but they focus on needs that aren't going to diminish as trends change.
Does Trust in Congress Vary by Political Affiliation?
If you look at those trust ratings from the angle of the different partisans, it's not much different.
- 11% of Independents have "Quite a Lot" or "Great Deal" of trust in the Congress;
- 10% of Democrats have "Quite a Lot" or "Great Deal" of trust in the Congress;
- 4% of Republicans have "Quite a Lot" or "Great Deal" of trust in the Congress.
Is This a New Trend?
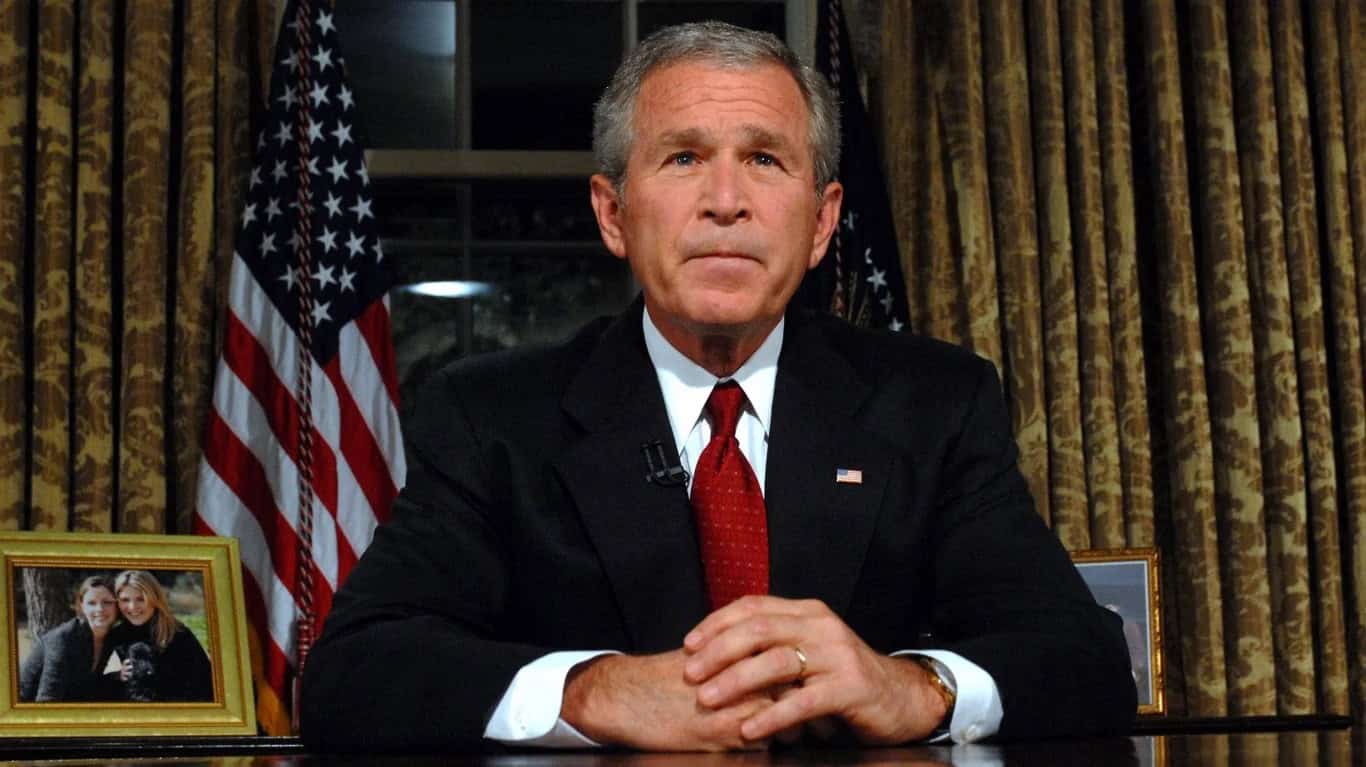
Looking at Pew Research's National Election Study, it has been a very long time since the public trust in the government has been high. It was nearly 80% with Eisenhower, Kennedy, and Johnson. Since then, the highest it has been was in 2001 with George W. Bush. It has declined since Ford and hasn't regained much ground. Under both Obama and Trump, using moving averages, public trust reached the lowest point at 17%.
Racial Impact on Trust Levels
Pew Research also found that Asian, Black, and Hispanic adults had higher levels of trust at 36%, 27%, and 30%, respectively. Trust levels among white adults were much lower at 19%.
What Leads to the Mistrust?
The Gallup Poll results on "Congress and the Public" narrow down some areas where Americans are frustrated. When asked if Congress is in touch with the average American, 79% felt they were out of touch.
Between 1995 and 2015, the belief that Congress members were corrupt increased from 50% to 52%. No updates to these results have occurred during the Trump or Biden administrations.
In 2015, 69% of Americans felt that Congressmen and women did more for special interest groups than their constituents.
What Do Americans Want?
With the results of the Gallup Poll, the top 15 answers to "What is the most important thing you want your representative in Congress to do when Congress begins its new session?" were:
- Balance the budget
- Bring troops home
- Create jobs
- Follow through on campaign promises
- Get along
- Improve the economy
- Improve the education system
- Improve foreign policy
- Improve healthcare
- Listen to the people
- Lower taxes
- Pass immigration reform
- Pass some kind of legislation
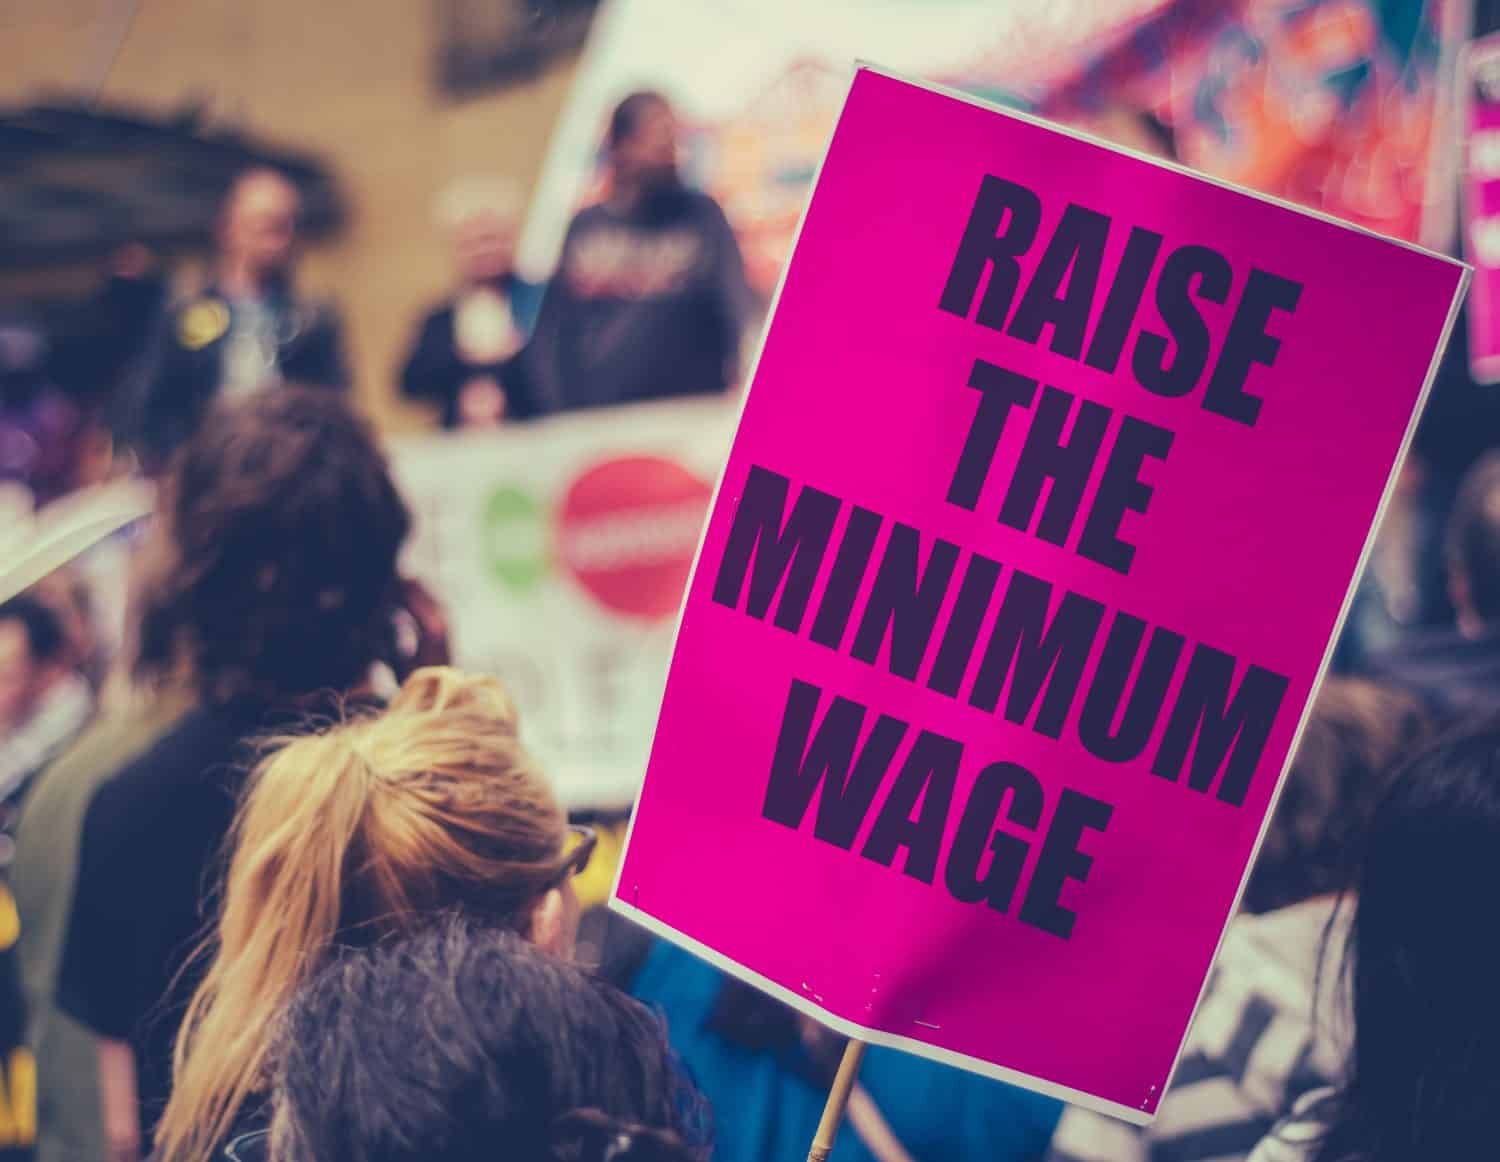
- Raise the minimum wage
- Stop terrorism
Few of those have changed. The minimum wage remains $7.25 an hour, where it has been since July 24, 2009. Bickering between parties remains high. Healthcare costs continue to skyrocket, except for prescription drug prices that did drop for some patients because of the Biden administration's Inflation Reduction Act. Most things on this list haven't changed at all since people started asking Congress to listen to the voters.
How Did the Other Institutions Do?
Overall, confidence reached 28%, down from 33% before the pandemic. It's a far cry from the peak of 43% in 2004.
The following percentages are in order of "Great Deal," "Quite a Lot," "Some," "Very Little," or "None," and the institutions are also in alphabetical order. Any variation from 100% is due to Americans with no opinion either way.
- Small Business: 36%, 32%, 25%, and 6% (No one responded "None")
- Military: 34%, 27%, 27%, 11%, and 1%
- Higher Education: 18%, 18%, 32%, 30%, and 2%
- Medical System: 17%, 19%, 34%, 29%, and 1%
- Church/Organized Religion: 17%, 15%, 35%, 30% and 2%
- U.S. Supreme Court: 13%, 17%, 31%, 35%, and 3%
- Public Schools: 13%, 16%, 36%, 32%, and 2%
- Organized Labor: 12%, 16%, 43%, 25%, and 2%
- Large Tech Companies: 14%, 13%, 39%, 31%, and 1%
- Banks: 12%, 15%, 47%, 25%, and 1%
- Presidency: 13%, 13%, 23%, 46%, and 4%
- Criminal Justice System: 8%, 13%, 34%, 42%, and 3%
- Newspapers: 7%, 11%, 31%, 45%, and 3%
- Big Business: 6%, 10%, 42%, 41%, and 1%
- TV News: 6%, 6%, 32%, 51%, and 5%
Other Factors Behind Shifts in American Trust
A Gallup Poll only paints a small picture of what has Americans feeling down and wanting change. Explore the other factors causing a decline in American pride.