
miodrag ignjatovic / Getty Images

DenisTangneyJr / iStock via Getty Images


Davel5957 / iStock via Getty Images

DenisTangneyJr / iStock via Getty Images

Sean Pavone / iStock via Getty Images

DenisTangneyJr / iStock via Getty Images

diegograndi / iStock via Getty Images

DenisTangneyJr / iStock via Getty Images

Davel5957 / iStock via Getty Images


Sean Pavone / iStock via Getty Images

DenisTangneyJr / iStock via Getty Images


RobHainer / iStock via Getty Images
Roberto Galan / iStock Editorial via Getty Images

Public domain / Wikimedia Commons

Bob Weston / iStock via Getty Images

DenisTangneyJr / iStock via Getty Images

felixmizioznikov / iStock via Getty Images

Public domain / National Archives

Janabi / iStock Editorial via Getty Images


ovidiuhrubaru / iStock via Getty Images


DenisTangneyJr / iStock via Getty Images

Public domain / Wikimedia Commons

Sean Pavone / iStock via Getty Images


Sean Pavone / iStock via Getty Images
DenisTangneyJr / iStock via Getty Images

DenisTangneyJr / iStock via Getty Images

Audrey Scripp / iStock via Getty Images

peeterv / iStock via Getty Images
DenisTangneyJr / iStock via Getty Images
DenisTangneyJr / iStock via Getty Images

DenisTangneyJr / iStock via Getty Images

Sean Pavone / iStock via Getty Images


Roberto Galan / iStock Editorial via Getty Images

jmoor17 / iStock Unreleased via Getty Images

Public domain / Wikimedia Commons

Sean Pavone / iStock via Getty Images

DenisTangneyJr / iStock via Getty Images
DenisTangneyJr / iStock via Getty Images

DenisTangneyJr / iStock via Getty Images

DenisTangneyJr / iStock via Getty Images

Sean Rayford / Stringer / Getty Images North America


DenisTangneyJr / iStock via Getty Images


Does where you live significantly affect your activity levels? Research suggests that some cities in the United States are far less active than others.
Many factors contribute to why residents in certain cities may not be as active as they should be, with a city's walkability being a key influence. People who can walk to grocery stores, movie theaters, or coffee shops easily will naturally accumulate more steps throughout their day. Those who rely on cars or public transportation often find it harder to reach the recommended 10,000 steps per day.
Another factor at play is the cost of living in various cities. If paying rent and taking care of other bills is overwhelming to a person, their work hours will be prioritized over their fitness time. Stressing over finances often results in people spending more time on the job to make ends meet instead of focusing on their fitness plans. Those who live affordable lifestyles can shift their focus to exercise routines, but that isn’t the case for everyone.
A third factor revolves around how many exercise facilities and fast food restaurants are located in any particular city. If there are more fast food joints than gyms, it’s easy for a person’s health status to get thrown off track. Staying in good shape certainly requires dedication and determination. The harsh reality is that people who live in inactive cities have higher rates of obesity with shorter life expectancies. It’s still possible to live fulfilling and healthy lives in inactive cities, but it’ll be a bit more challenging. (On the topic of health and wellness, see a ranking of all 50 states based on exercise.)
To determine America’s most inactive metros, 24/7 Tempo reviewed adult physical inactivity rates from the Robert Wood Johnson Foundation and the University of Wisconsin Population Health Institute joint program’s 2023 County Health Rankings and Roadmaps report. The physical inactivity rate is defined as the share of adults 20 years and older who report no leisure-time physical activity. We used the 384 metropolitan statistical areas as delineated by the United States Office of Management and Budget and used by the Census Bureau as our definition of metros. Additional information on the share of adults 20 years and older who report a body mass index of 30 kg/m2 or higher (considered obese), the share of adults reporting poor or fair health, and the life expectancy at birth also came from the 2023 CHR.
50. Elizabethtown-Fort Knox, Kentucky
- Adults who don't exercise: 28.4%
- Adult obesity rate: 39.2% — 43. out of 384 metro areas
- Adults in poor or fair health: 17.8% — 67. out of 384 metro areas
- Life expectancy: 75.8 years — 302. out of 384 metro areas
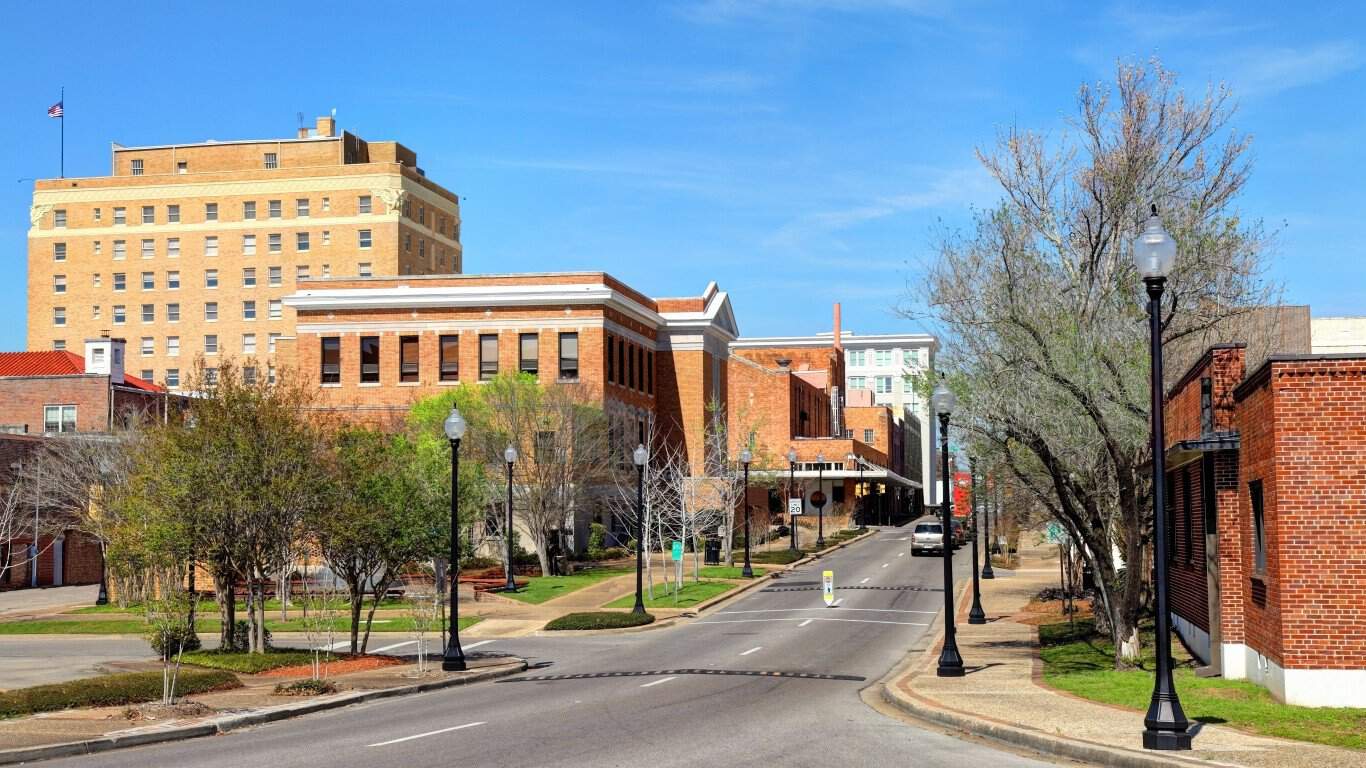
49. Hattiesburg, Mississippi
- Adults who don't exercise: 28.4%
- Adult obesity rate: 39.1% — 44. out of 384 metro areas
- Adults in poor or fair health: 18.6% — 47. out of 384 metro areas
- Life expectancy: 75.1 years — 339. out of 384 metro areas
48. Victoria, Texas
- Adults who don't exercise: 28.6%
- Adult obesity rate: 38.2% — 80. out of 384 metro areas
- Adults in poor or fair health: 19.2% — 32. out of 384 metro areas
- Life expectancy: 77.5 years — 207. out of 384 metro areas
47. Lexington-Fayette, Kentucky
- Adults who don't exercise: 28.6%
- Adult obesity rate: 34.1% — 217. out of 384 metro areas
- Adults in poor or fair health: 16.4% — 108. out of 384 metro areas
- Life expectancy: 77.4 years — 218. out of 384 metro areas
46. Lafayette, Louisiana
- Adults who don't exercise: 28.6%
- Adult obesity rate: 37.0% — 110. out of 384 metro areas
- Adults in poor or fair health: 18.1% — 58. out of 384 metro areas
- Life expectancy: 76.2 years — 286. out of 384 metro areas
45. Macon-Bibb County, Georgia
- Adults who don't exercise: 28.7%
- Adult obesity rate: 38.9% — 58. out of 384 metro areas
- Adults in poor or fair health: 19.0% — 39. out of 384 metro areas
- Life expectancy: 74.1 years — 368. out of 384 metro areas
44. Lake Havasu City-Kingman, Arizona
- Adults who don't exercise: 28.7%
- Adult obesity rate: 35.7% — 160. out of 384 metro areas
- Adults in poor or fair health: 16.7% — 99. out of 384 metro areas
- Life expectancy: 75.5 years — 319. out of 384 metro areas
43. Merced, California
- Adults who don't exercise: 28.9%
- Adult obesity rate: 38.0% — 85. out of 384 metro areas
- Adults in poor or fair health: 21.7% — 9. out of 384 metro areas
- Life expectancy: 78.2 years — 164. out of 384 metro areas
42. Owensboro, Kentucky
- Adults who don't exercise: 28.9%
- Adult obesity rate: 39.1% — 46. out of 384 metro areas
- Adults in poor or fair health: 18.2% — 55. out of 384 metro areas
- Life expectancy: 76.4 years — 280. out of 384 metro areas
41. Miami-Fort Lauderdale-Pompano Beach, Florida
- Adults who don't exercise: 29.0%
- Adult obesity rate: 29.6% — 329. out of 384 metro areas
- Adults in poor or fair health: 17.4% — 81. out of 384 metro areas
- Life expectancy: 81.5 years — 27. out of 384 metro areas
40. Springfield, Ohio
- Adults who don't exercise: 29.0%
- Adult obesity rate: 36.7% — 120. out of 384 metro areas
- Adults in poor or fair health: 16.3% — 113. out of 384 metro areas
- Life expectancy: 73.9 years — 373. out of 384 metro areas
39. Montgomery, Alabama
- Adults who don't exercise: 29.0%
- Adult obesity rate: 44.4% — 2. out of 384 metro areas
- Adults in poor or fair health: 19.1% — 34. out of 384 metro areas
- Life expectancy: 75.3 years — 328. out of 384 metro areas
38. Visalia, California
- Adults who don't exercise: 29.1%
- Adult obesity rate: 36.0% — 147. out of 384 metro areas
- Adults in poor or fair health: 22.8% — 7. out of 384 metro areas
- Life expectancy: 77.8 years — 194. out of 384 metro areas
37. Hinesville, Georgia
- Adults who don't exercise: 29.1%
- Adult obesity rate: 40.7% — 22. out of 384 metro areas
- Adults in poor or fair health: 18.3% — 52. out of 384 metro areas
- Life expectancy: 76.5 years — 273. out of 384 metro areas
36. Columbus, Georgia-Alabama
- Adults who don't exercise: 29.2%
- Adult obesity rate: 38.4% — 72. out of 384 metro areas
- Adults in poor or fair health: 18.5% — 48. out of 384 metro areas
- Life expectancy: 74.3 years — 361. out of 384 metro areas
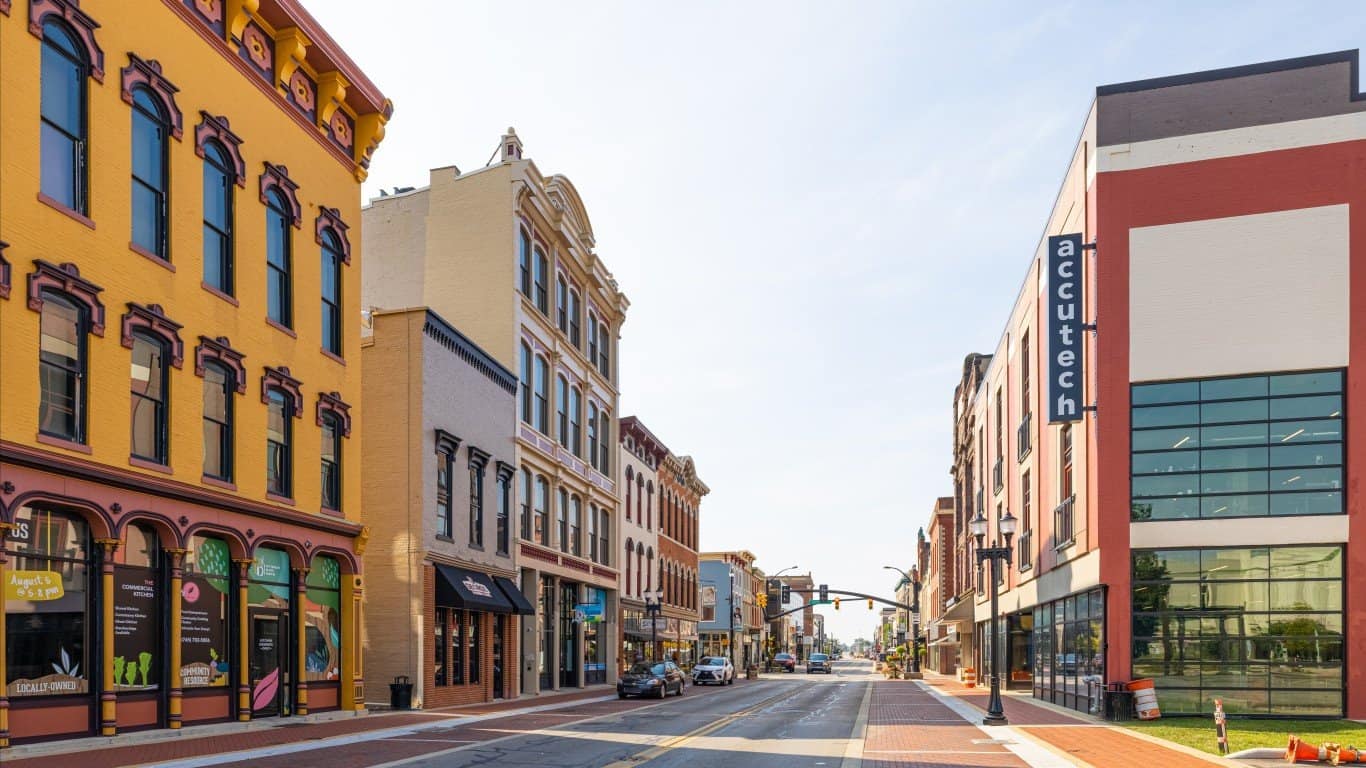
35. Muncie, Indiana
- Adults who don't exercise: 29.2%
- Adult obesity rate: 40.1% — 29. out of 384 metro areas
- Adults in poor or fair health: 17.3% — 82. out of 384 metro areas
- Life expectancy: 74.2 years — 366. out of 384 metro areas
34. Gadsden, Alabama
- Adults who don't exercise: 29.3%
- Adult obesity rate: 41.1% — 17. out of 384 metro areas
- Adults in poor or fair health: 19.1% — 35. out of 384 metro areas
- Life expectancy: 72.5 years — 383. out of 384 metro areas
33. Jonesboro, Arkansas
- Adults who don't exercise: 29.3%
- Adult obesity rate: 40.5% — 26. out of 384 metro areas
- Adults in poor or fair health: 18.7% — 45. out of 384 metro areas
- Life expectancy: 75.2 years — 334. out of 384 metro areas
32. Yuma, Arizona
- Adults who don't exercise: 29.4%
- Adult obesity rate: 40.5% — 25. out of 384 metro areas
- Adults in poor or fair health: 21.1% — 12. out of 384 metro areas
- Life expectancy: 80.5 years — 50. out of 384 metro areas
31. Sebring-Avon Park, Florida
- Adults who don't exercise: 29.6%
- Adult obesity rate: 39.1% — 51. out of 384 metro areas
- Adults in poor or fair health: 19.2% — 30. out of 384 metro areas
- Life expectancy: 77.8 years — 193. out of 384 metro areas
30. Enid, Oklahoma
- Adults who don't exercise: 29.6%
- Adult obesity rate: 37.9% — 89. out of 384 metro areas
- Adults in poor or fair health: 16.4% — 110. out of 384 metro areas
- Life expectancy: 75.0 years — 341. out of 384 metro areas
29. Valdosta, Georgia
- Adults who don't exercise: 29.6%
- Adult obesity rate: 39.6% — 34. out of 384 metro areas
- Adults in poor or fair health: 18.9% — 42. out of 384 metro areas
- Life expectancy: 75.3 years — 330. out of 384 metro areas
28. Albany, Georgia
- Adults who don't exercise: 29.6%
- Adult obesity rate: 41.4% — 14. out of 384 metro areas
- Adults in poor or fair health: 20.0% — 20. out of 384 metro areas
- Life expectancy: 73.6 years — 375. out of 384 metro areas
27. Sumter, South Carolina
- Adults who don't exercise: 29.6%
- Adult obesity rate: 41.3% — 15. out of 384 metro areas
- Adults in poor or fair health: 18.8% — 44. out of 384 metro areas
- Life expectancy: 74.3 years — 363. out of 384 metro areas
26. Huntington-Ashland, West Virginia-Kentucky-Ohio
- Adults who don't exercise: 29.7%
- Adult obesity rate: 39.1% — 45. out of 384 metro areas
- Adults in poor or fair health: 19.4% — 27. out of 384 metro areas
- Life expectancy: 73.3 years — 378. out of 384 metro areas
25. Tuscaloosa, Alabama
- Adults who don't exercise: 30.0%
- Adult obesity rate: 42.2% — 9. out of 384 metro areas
- Adults in poor or fair health: 19.1% — 37. out of 384 metro areas
- Life expectancy: 75.4 years — 323. out of 384 metro areas
24. Rome, Georgia
- Adults who don't exercise: 30.1%
- Adult obesity rate: 38.1% — 81. out of 384 metro areas
- Adults in poor or fair health: 18.3% — 54. out of 384 metro areas
- Life expectancy: 74.2 years — 365. out of 384 metro areas
23. El Paso, Texas
- Adults who don't exercise: 30.3%
- Adult obesity rate: 37.7% — 92. out of 384 metro areas
- Adults in poor or fair health: 22.8% — 5. out of 384 metro areas
- Life expectancy: 78.1 years — 171. out of 384 metro areas
22. Beckley, West Virginia
- Adults who don't exercise: 30.5%
- Adult obesity rate: 41.8% — 12. out of 384 metro areas
- Adults in poor or fair health: 21.7% — 8. out of 384 metro areas
- Life expectancy: 71.9 years — 384. out of 384 metro areas
21. Charleston, West Virginia
- Adults who don't exercise: 30.5%
- Adult obesity rate: 39.0% — 54. out of 384 metro areas
- Adults in poor or fair health: 19.7% — 23. out of 384 metro areas
- Life expectancy: 72.6 years — 381. out of 384 metro areas
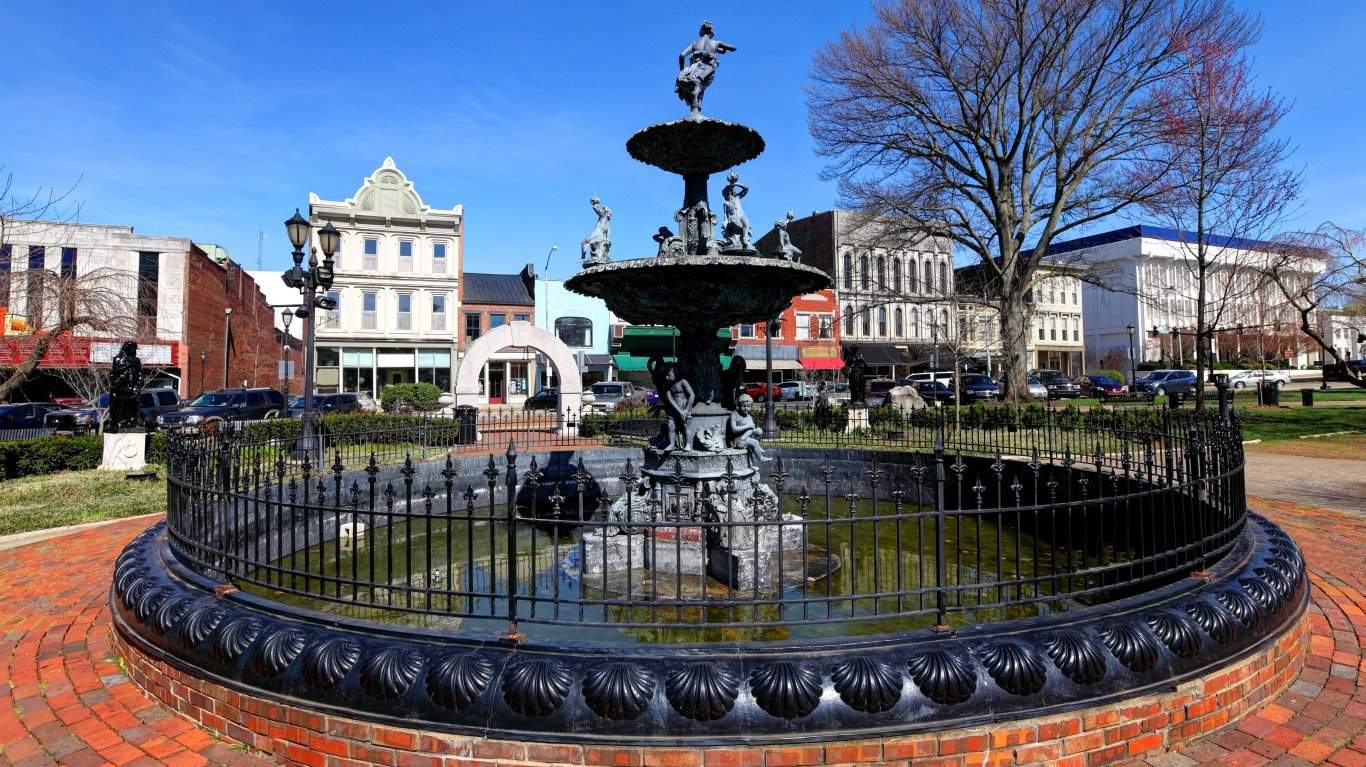
20. Bowling Green, Kentucky
- Adults who don't exercise: 30.6%
- Adult obesity rate: 37.6% — 95. out of 384 metro areas
- Adults in poor or fair health: 18.9% — 40. out of 384 metro areas
- Life expectancy: 76.2 years — 288. out of 384 metro areas
19. Lake Charles, Louisiana
- Adults who don't exercise: 30.7%
- Adult obesity rate: 38.4% — 70. out of 384 metro areas
- Adults in poor or fair health: 17.7% — 71. out of 384 metro areas
- Life expectancy: 74.5 years — 355. out of 384 metro areas
18. Vineland-Bridgeton, New Jersey
- Adults who don't exercise: 30.8%
- Adult obesity rate: 35.7% — 159. out of 384 metro areas
- Adults in poor or fair health: 17.8% — 63. out of 384 metro areas
- Life expectancy: 74.6 years — 353. out of 384 metro areas
17. Fort Smith, Arkansas-Oklahoma
- Adults who don't exercise: 30.8%
- Adult obesity rate: 36.8% — 116. out of 384 metro areas
- Adults in poor or fair health: 20.1% — 18. out of 384 metro areas
- Life expectancy: 75.4 years — 326. out of 384 metro areas
16. Florence, South Carolina
- Adults who don't exercise: 30.8%
- Adult obesity rate: 41.7% — 13. out of 384 metro areas
- Adults in poor or fair health: 18.4% — 51. out of 384 metro areas
- Life expectancy: 72.6 years — 382. out of 384 metro areas
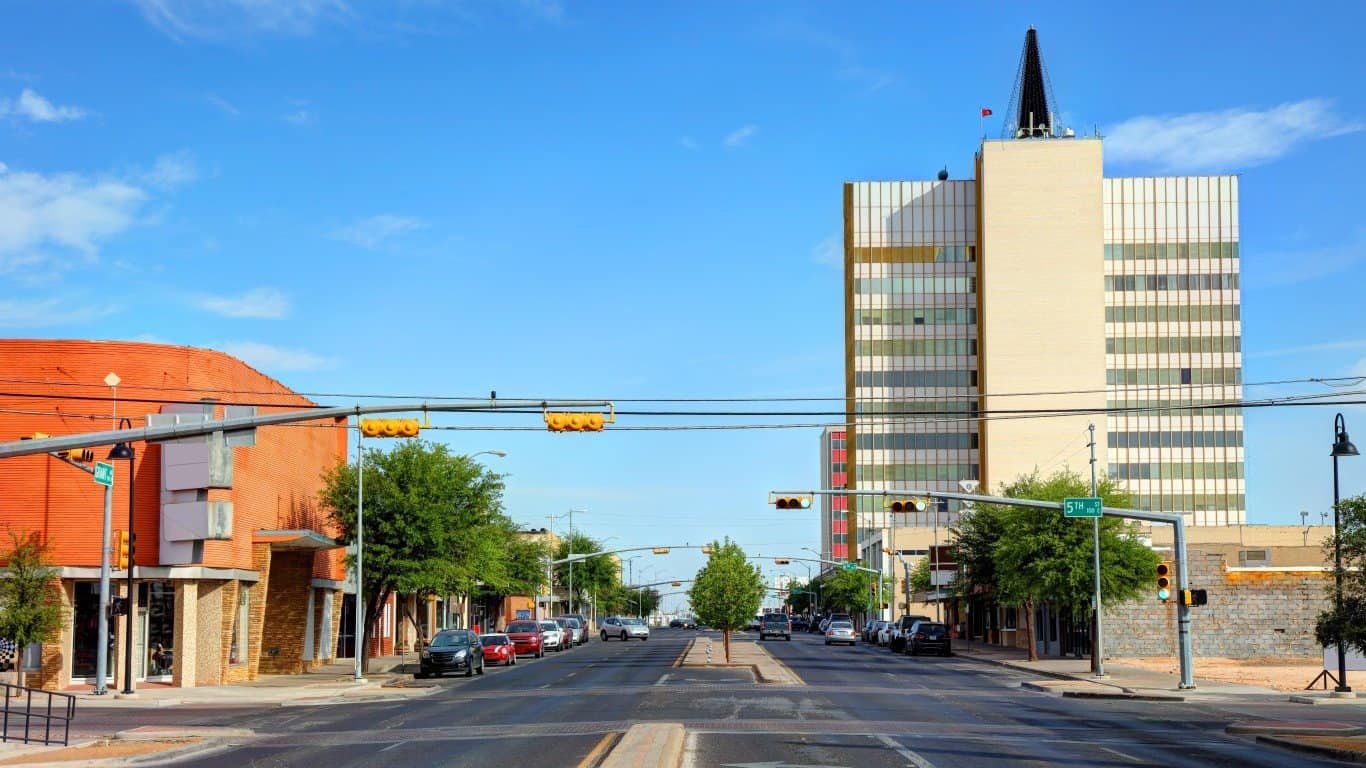
15. Odessa, Texas
- Adults who don't exercise: 31.1%
- Adult obesity rate: 39.6% — 33. out of 384 metro areas
- Adults in poor or fair health: 20.4% — 15. out of 384 metro areas
- Life expectancy: 73.8 years — 374. out of 384 metro areas
14. Lawton, Oklahoma
- Adults who don't exercise: 31.2%
- Adult obesity rate: 39.4% — 36. out of 384 metro areas
- Adults in poor or fair health: 18.0% — 60. out of 384 metro areas
- Life expectancy: 75.4 years — 324. out of 384 metro areas
13. Shreveport-Bossier City, Louisiana
- Adults who don't exercise: 31.6%
- Adult obesity rate: 42.0% — 11. out of 384 metro areas
- Adults in poor or fair health: 19.4% — 28. out of 384 metro areas
- Life expectancy: 74.9 years — 344. out of 384 metro areas
12. Houma-Thibodaux, Louisiana
- Adults who don't exercise: 31.6%
- Adult obesity rate: 40.3% — 27. out of 384 metro areas
- Adults in poor or fair health: 19.6% — 25. out of 384 metro areas
- Life expectancy: 75.9 years — 297. out of 384 metro areas
11. Dothan, Alabama
- Adults who don't exercise: 31.7%
- Adult obesity rate: 39.3% — 42. out of 384 metro areas
- Adults in poor or fair health: 20.2% — 16. out of 384 metro areas
- Life expectancy: 75.1 years — 338. out of 384 metro areas
10. El Centro, California
- Adults who don't exercise: 31.7%
- Adult obesity rate: 36.2% — 138. out of 384 metro areas
- Adults in poor or fair health: 24.0% — 4. out of 384 metro areas
- Life expectancy: 79.0 years — 115. out of 384 metro areas
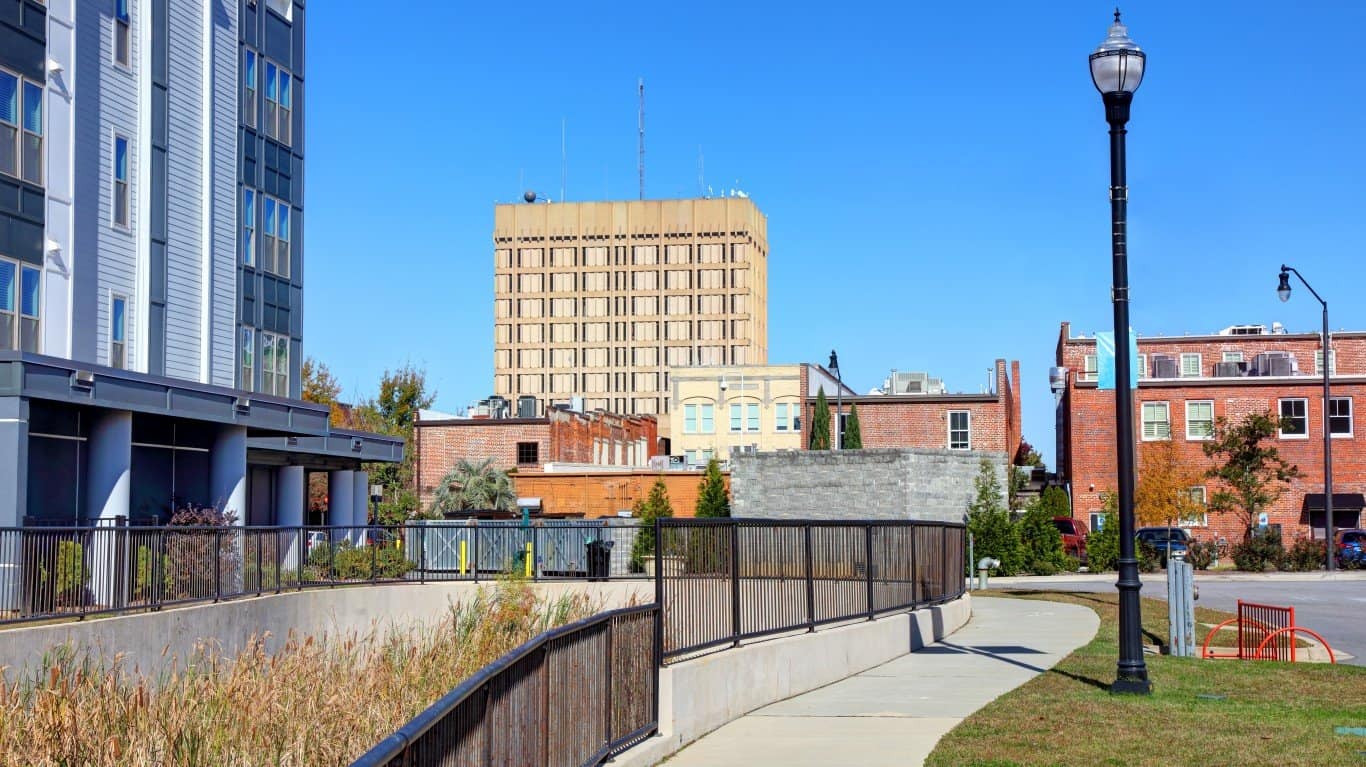
9. Dalton, Georgia
- Adults who don't exercise: 32.0%
- Adult obesity rate: 39.0% — 53. out of 384 metro areas
- Adults in poor or fair health: 19.9% — 22. out of 384 metro areas
- Life expectancy: 76.6 years — 264. out of 384 metro areas
8. Corpus Christi, Texas
- Adults who don't exercise: 32.1%
- Adult obesity rate: 40.6% — 24. out of 384 metro areas
- Adults in poor or fair health: 21.1% — 13. out of 384 metro areas
- Life expectancy: 77.1 years — 236. out of 384 metro areas
7. Alexandria, Louisiana
- Adults who don't exercise: 32.3%
- Adult obesity rate: 43.2% — 3. out of 384 metro areas
- Adults in poor or fair health: 18.6% — 46. out of 384 metro areas
- Life expectancy: 73.5 years — 376. out of 384 metro areas
6. Monroe, Louisiana
- Adults who don't exercise: 33.0%
- Adult obesity rate: 42.4% — 8. out of 384 metro areas
- Adults in poor or fair health: 20.8% — 14. out of 384 metro areas
- Life expectancy: 73.3 years — 377. out of 384 metro areas
5. Brownsville-Harlingen, Texas
- Adults who don't exercise: 33.1%
- Adult obesity rate: 42.7% — 7. out of 384 metro areas
- Adults in poor or fair health: 28.2% — 2. out of 384 metro areas
- Life expectancy: 78.8 years — 131. out of 384 metro areas
4. McAllen-Edinburg-Mission, Texas
- Adults who don't exercise: 33.4%
- Adult obesity rate: 42.9% — 5. out of 384 metro areas
- Adults in poor or fair health: 28.3% — 1. out of 384 metro areas
- Life expectancy: 79.5 years — 91. out of 384 metro areas
3. Hammond, Louisiana
- Adults who don't exercise: 33.4%
- Adult obesity rate: 40.8% — 19. out of 384 metro areas
- Adults in poor or fair health: 19.5% — 26. out of 384 metro areas
- Life expectancy: 74.6 years — 352. out of 384 metro areas
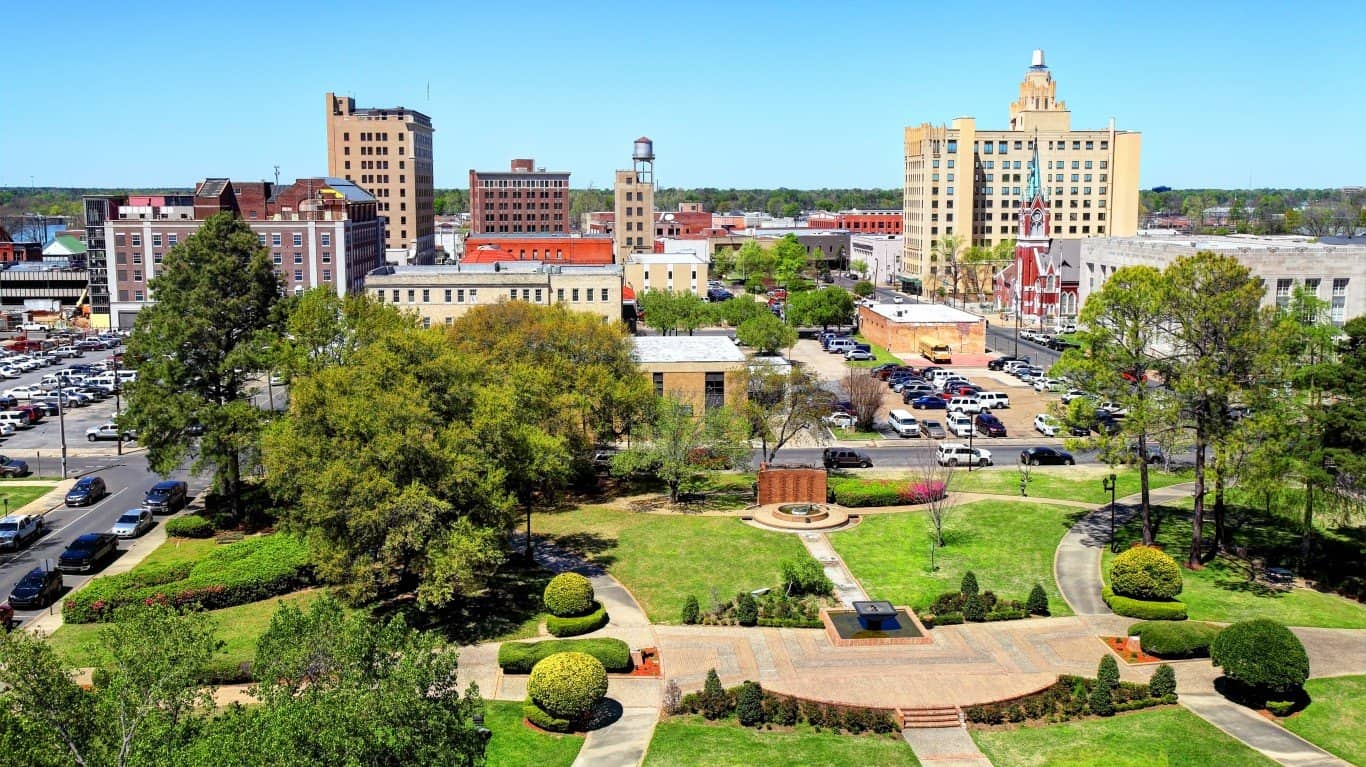
2. Pine Bluff, Arkansas
- Adults who don't exercise: 33.7%
- Adult obesity rate: 42.9% — 6. out of 384 metro areas
- Adults in poor or fair health: 22.8% — 6. out of 384 metro areas
- Life expectancy: 72.9 years — 379. out of 384 metro areas
1. Laredo, Texas
- Adults who don't exercise: 38.0%
- Adult obesity rate: 44.6% — 1. out of 384 metro areas
- Adults in poor or fair health: 27.4% — 3. out of 384 metro areas
- Life expectancy: 78.5 years — 143. out of 384 metro areas
(Take a look at the healthiest cities in the U.S.)