A majority of Americans eat fast food at least sometimes, whether we admit it or not. Various restaurant industry sources estimate that at least 30% of us — including children — choose it at least once a day, and 83% of U.S. families report that they indulge in it at least once a week, either as takeout or in a chain restaurant unit.
It’s no secret that fast food in general isn’t very good for us, even if at least a few marginally healthy options are offered increasingly by its purveyors. It tends to be high in calories, sodium, and sometimes sugar — even in savory items. (These are the 20 fast foods with the most calories.)
In addition, while our perception might be that fast food is cheap, it can sometimes be surprisingly expensive. This is especially true with takeout ordered through a delivery service. According to Statista, the average U.S. food delivery spend per order on Uber Eats in 2022 was $33.94.
In addition, in some 20 states around the country, popular fast food items from major chains cost more than the national average. In a few cases the difference is minimal, but consumers in a dozen states pay a premium of more than 5% for their indulgences — and in one case that number rises to more than 18%. (See how fast food prices rose and fell in 2022.)
To determine the states where people pay the most (and least) for fast food, 24/7 Tempo reviewed a study of takeout food prices by NetCredit, an online loan provider, which computed the average cost of takeout food in all 50 states.
To do this, they collected menus from seven major chains — McDonald’s, Pizza Hut, Subway, Burger King, KFC, Popeyes, and Taco Bell — then chose several popular items from each chain (Burger King’s Whopper, Taco Bell’s Crunchwrap Supreme, etc.) and analyzed data on their prices in some 260 cities around the nation from Grubhub. Next, they computed the average national price for the items overall and for each individual chain, then calculated how much or little prices in each state varied from that average.
Note that while fast-food-eaters in two-fifths of our states might pay a premium, people in 30 other states actually pay at least slightly less than the national average — with one lucky state getting a break of almost 10%.
Here is a list of the states where people pay the most (and least) for fast food:
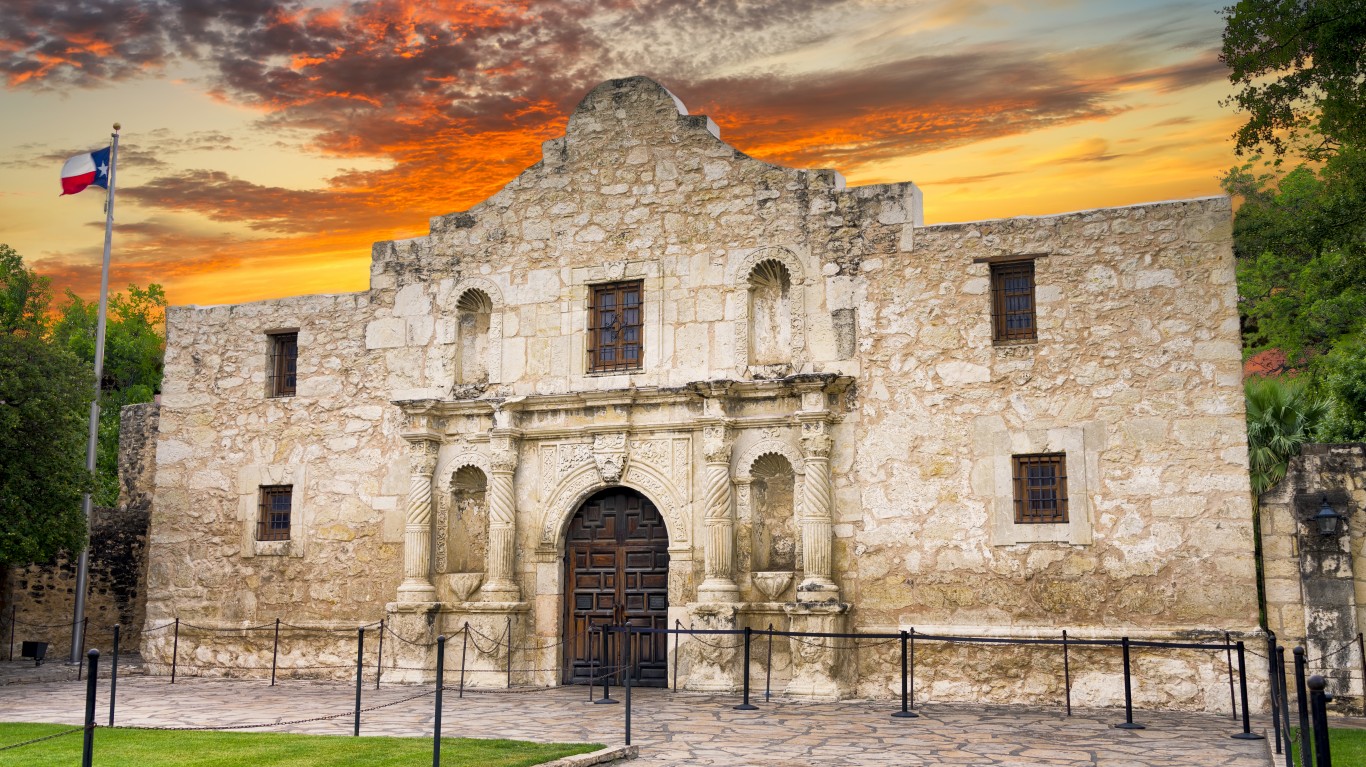
Texas
Source: Dean_Fikar / iStock via Getty Images
Source: Dean_Fikar / iStock via Getty Images
The Alamo.
Price difference from national average: -9.58%
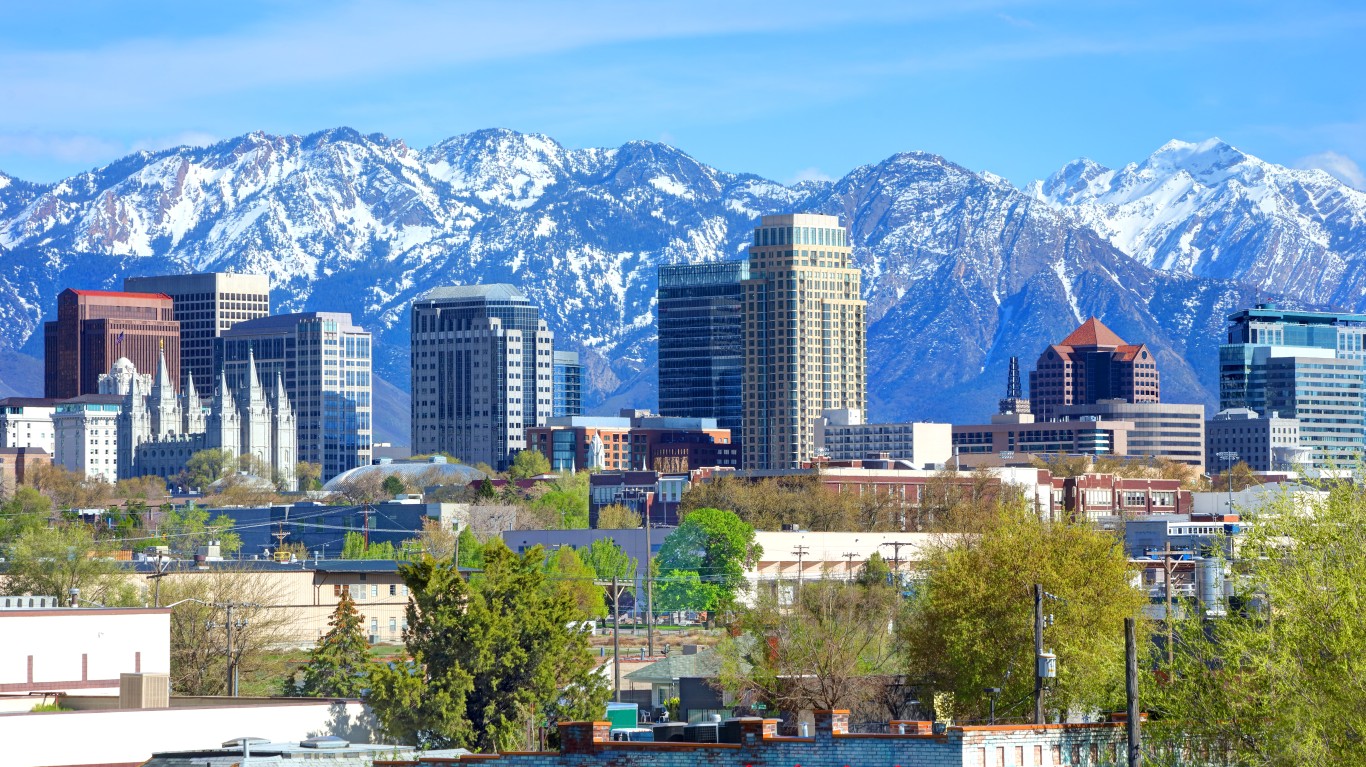
Utah
Source: DenisTangneyJr / E+ via Getty Images
Source: DenisTangneyJr / E+ via Getty Images
A view of Salt Lake City.
Price difference from national average: -6.95%
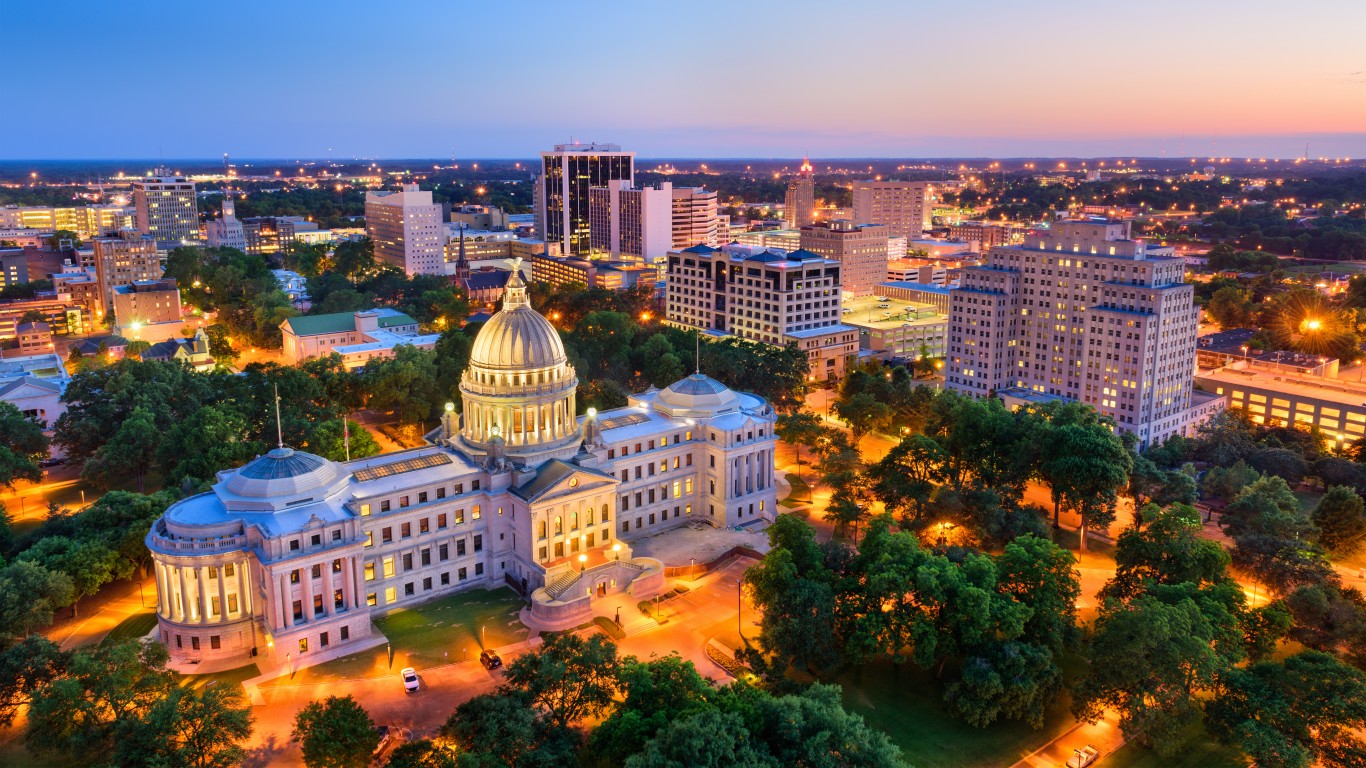
Mississippi
Source: SeanPavonePhoto / iStock via Getty Images
Source: SeanPavonePhoto / iStock via Getty Images
Looking out over Jackson, the state capital.
Price difference from national average: -6.60%
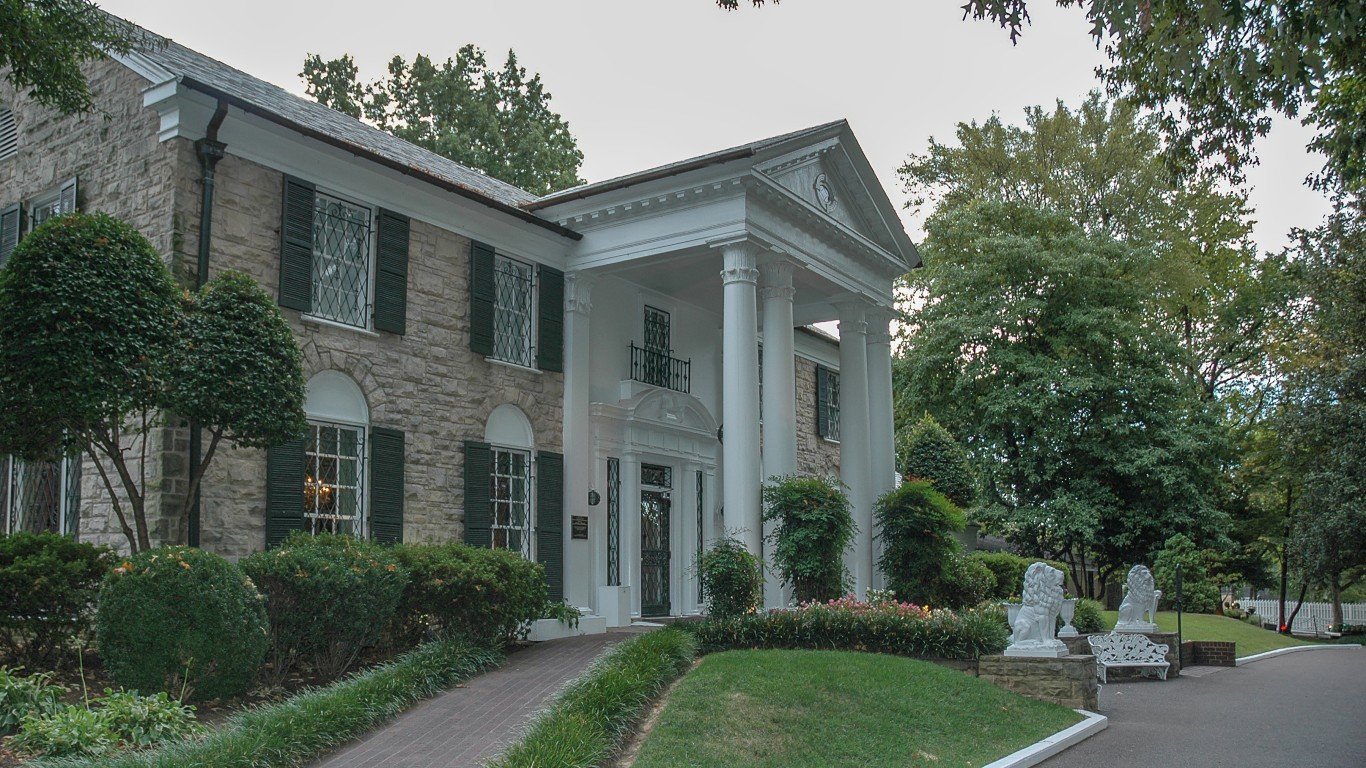
Tennessee
Source: GDMatt66 / iStock Editorial via Getty Images
Source: GDMatt66 / iStock Editorial via Getty Images
Elvis Presley’s famed Graceland mansion in Memphis.
Price difference from national average: -6.48%
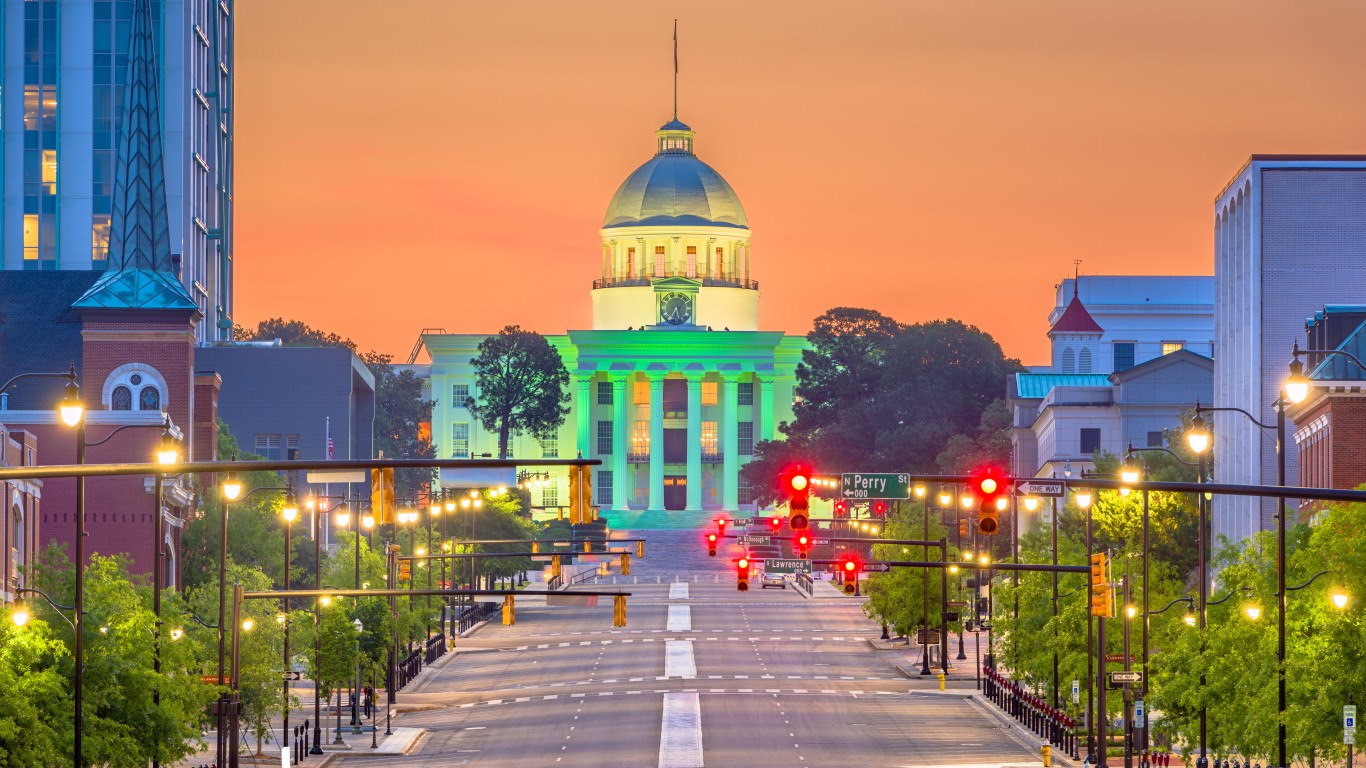
Alabama
Source: Sean Pavone / iStock via Getty Images
Source: Sean Pavone / iStock via Getty Images
The State Capitol in Montgomery at dawn.
Price difference from national average: -6.33%
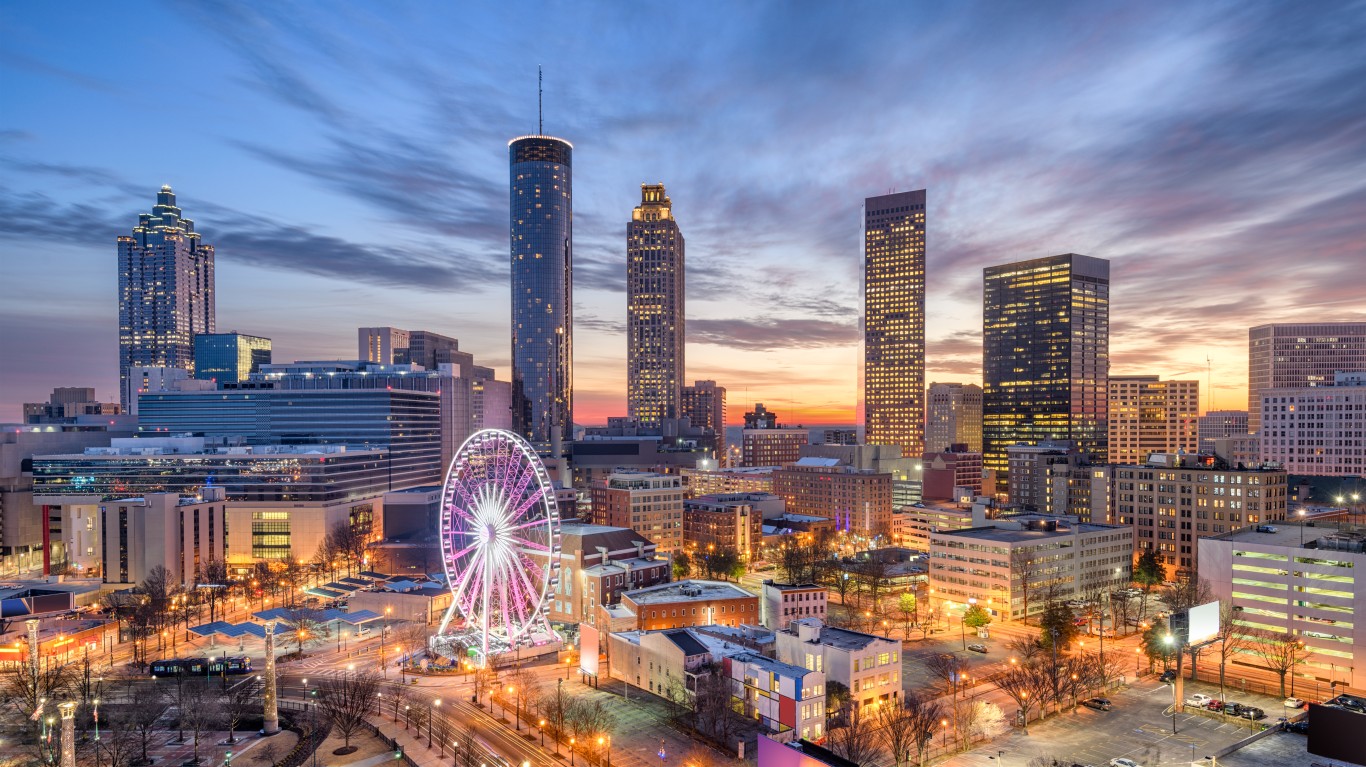
Georgia
Source: Sean Pavone / iStock via Getty Images
Source: Sean Pavone / iStock via Getty Images
The downtown Atlanta skyline.
Price difference from national average: -5.76%
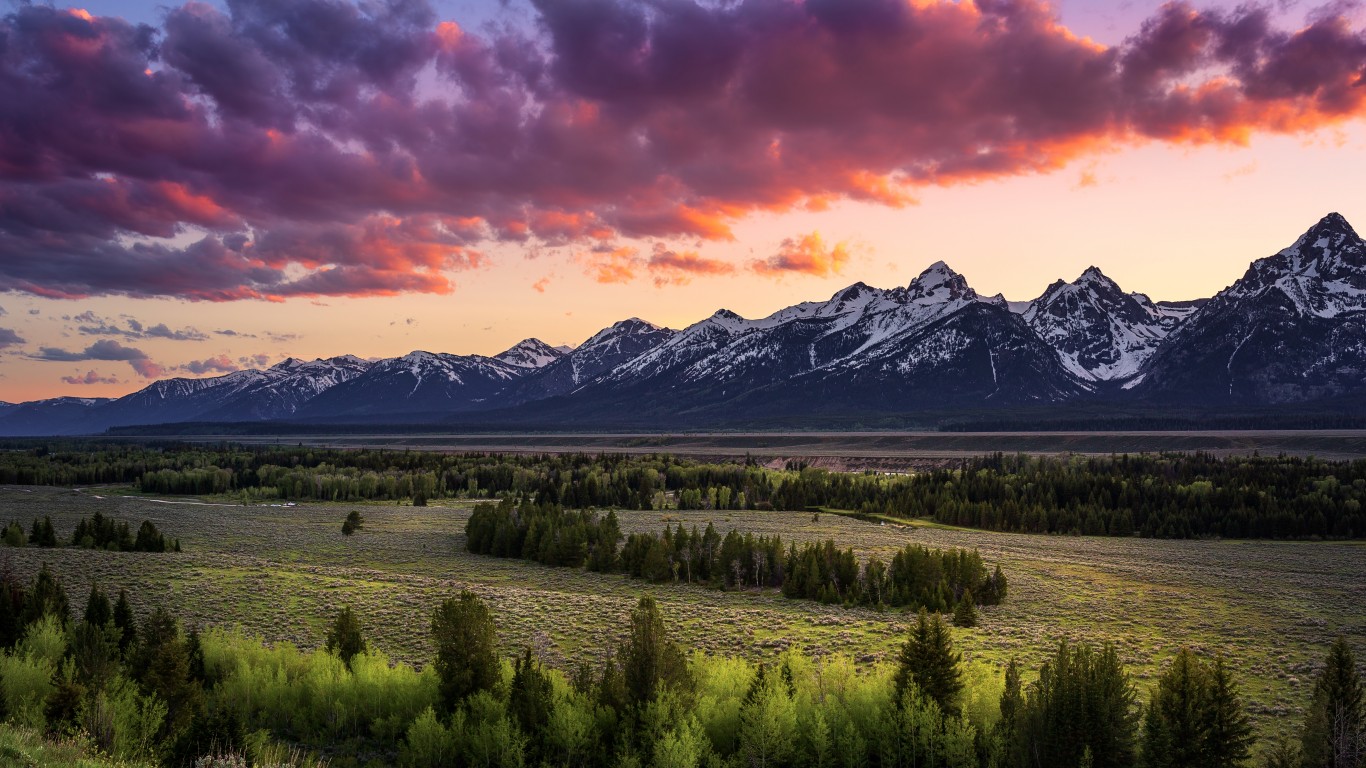
Wyoming
Source: mdesigner125 / iStock via Getty Images
Source: mdesigner125 / iStock via Getty Images
Sunset over Wyoming’s Grand Teton National Park.
Price difference from national average: -5.54%
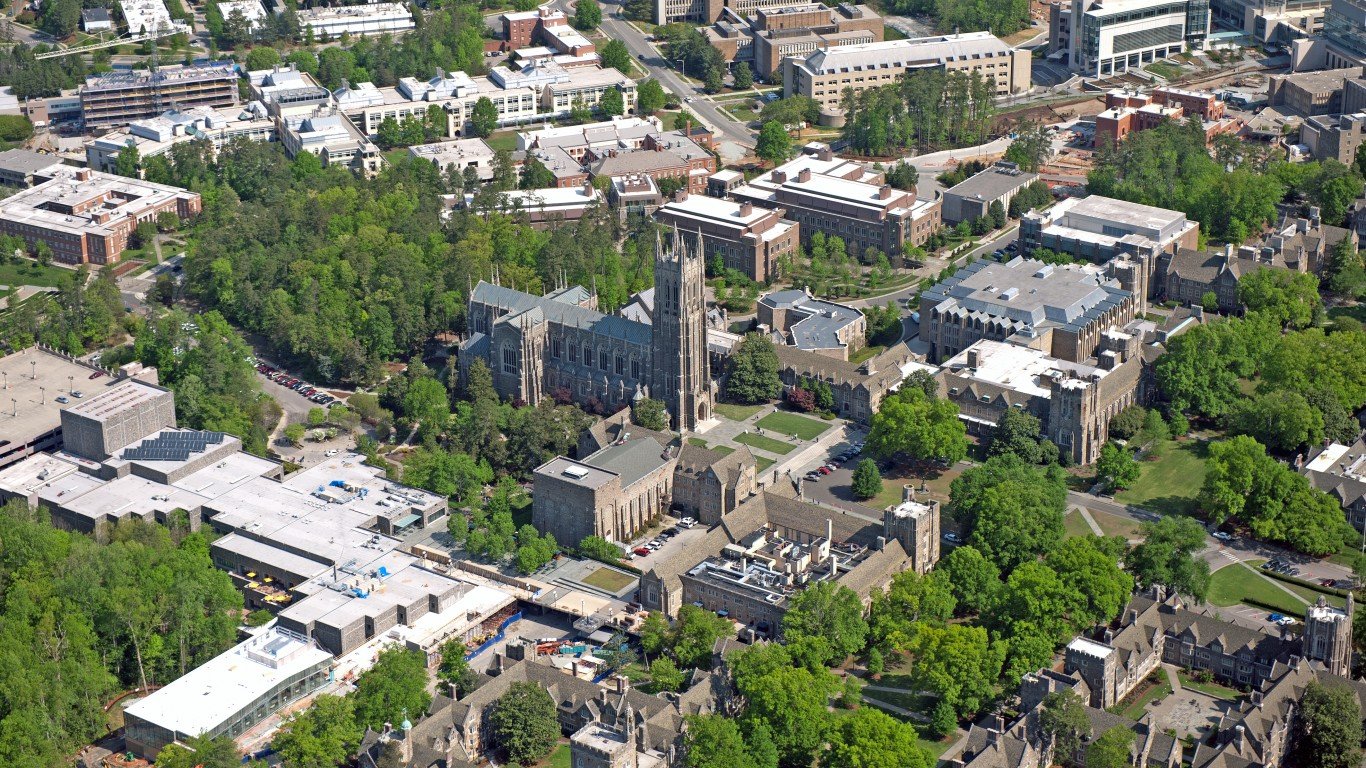
North Carolina
Source: LanceKing / Getty Images
Source: LanceKing / Getty Images
North Carolina’s celebrated Duke University in Durham.
Price difference from national average: -5.47%
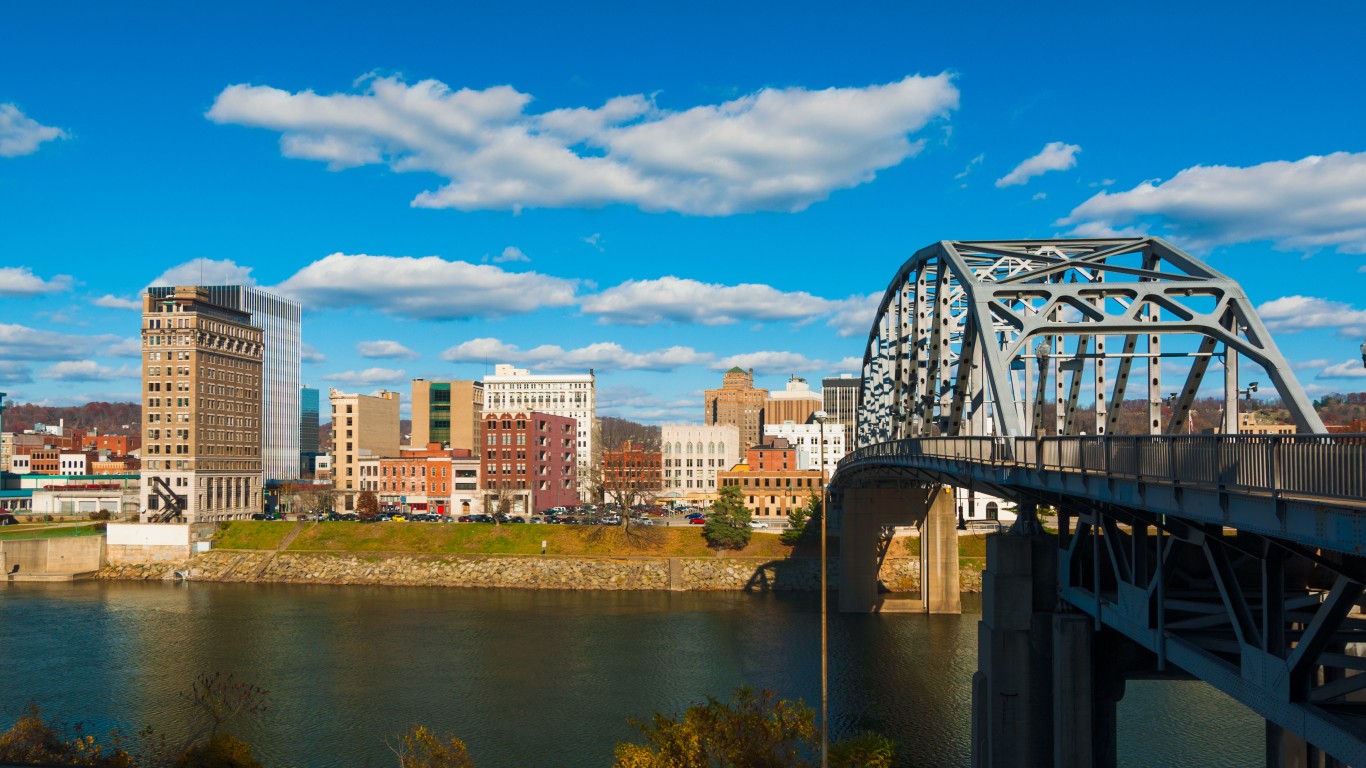
West Virginia
Source: Davel5957 / Getty Images
Source: Davel5957 / Getty Images
A view of Charleston, the state capital, with South Side Bridge over the Kanawha River.
Price difference from national average: -5.46%
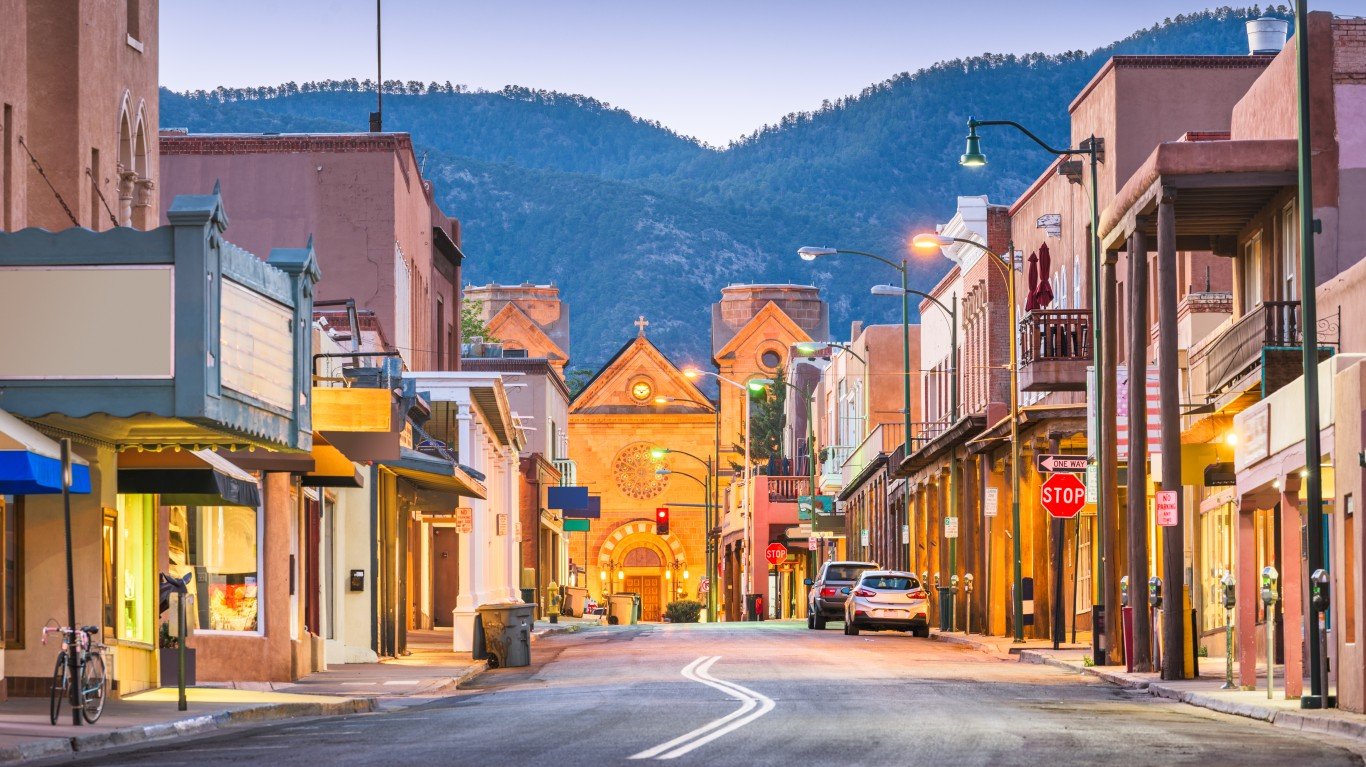
New Mexico
Source: Sean Pavone / iStock via Getty Images
Source: Sean Pavone / iStock via Getty Images
Twilight in Santa Fe, the state capital.
Price difference from national average: -4.56%
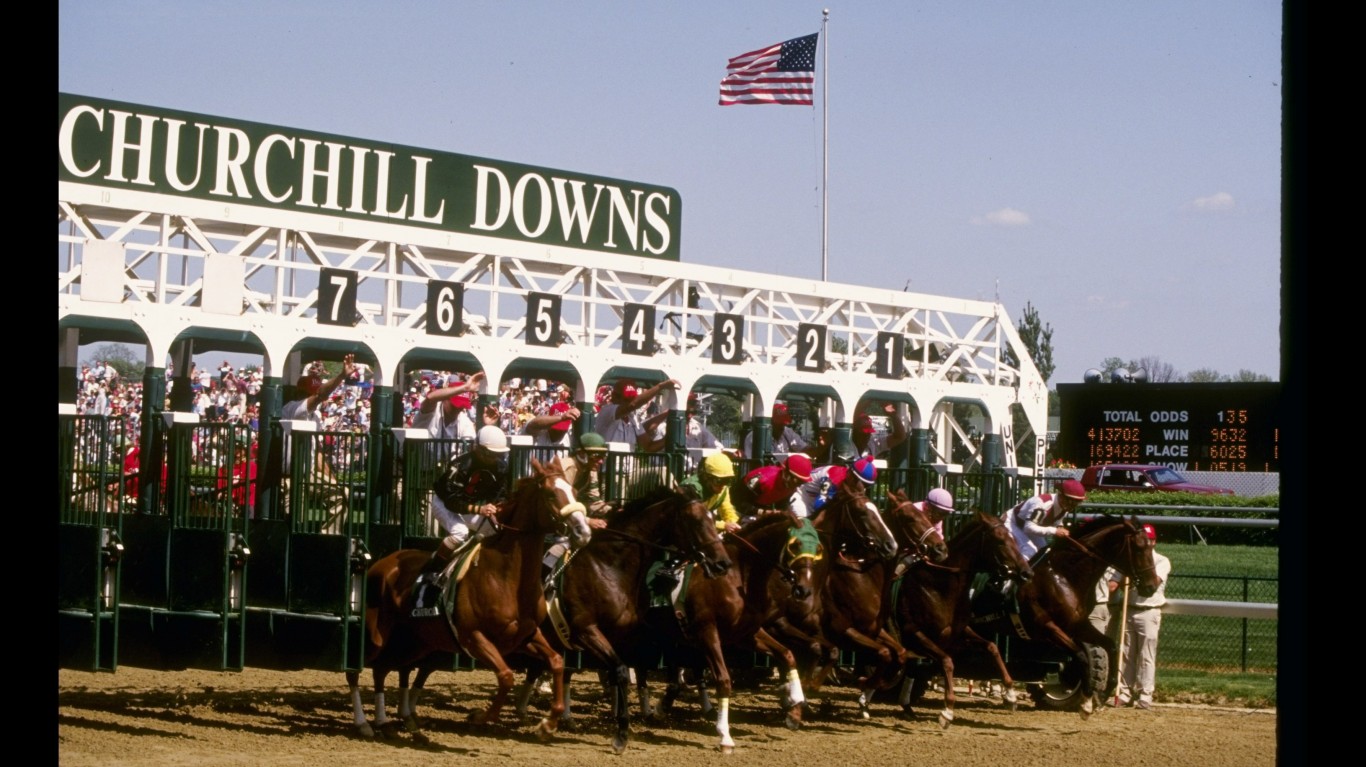
Kentucky
Source: Ken Levine / Getty Images
Source: Ken Levine / Getty Images
America’s most famous horse race, the Kentucky Derby at Churchill Downs.
Price difference from national average: -4.41%
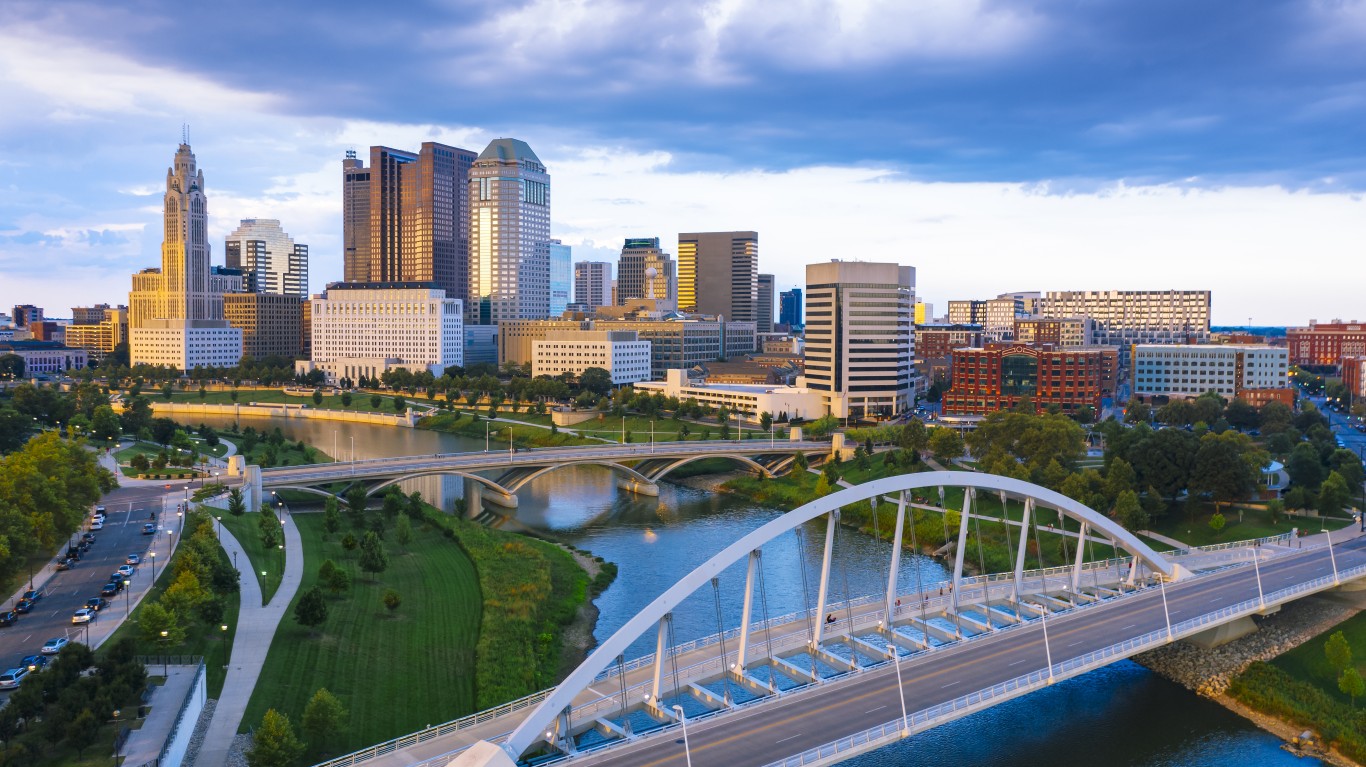
Ohio
Source: espiegle / iStock via Getty Images
Source: espiegle / iStock via Getty Images
Late afternoon in Columbus, with the Scioto River in the foreground.
Price difference from national average: -3.91%
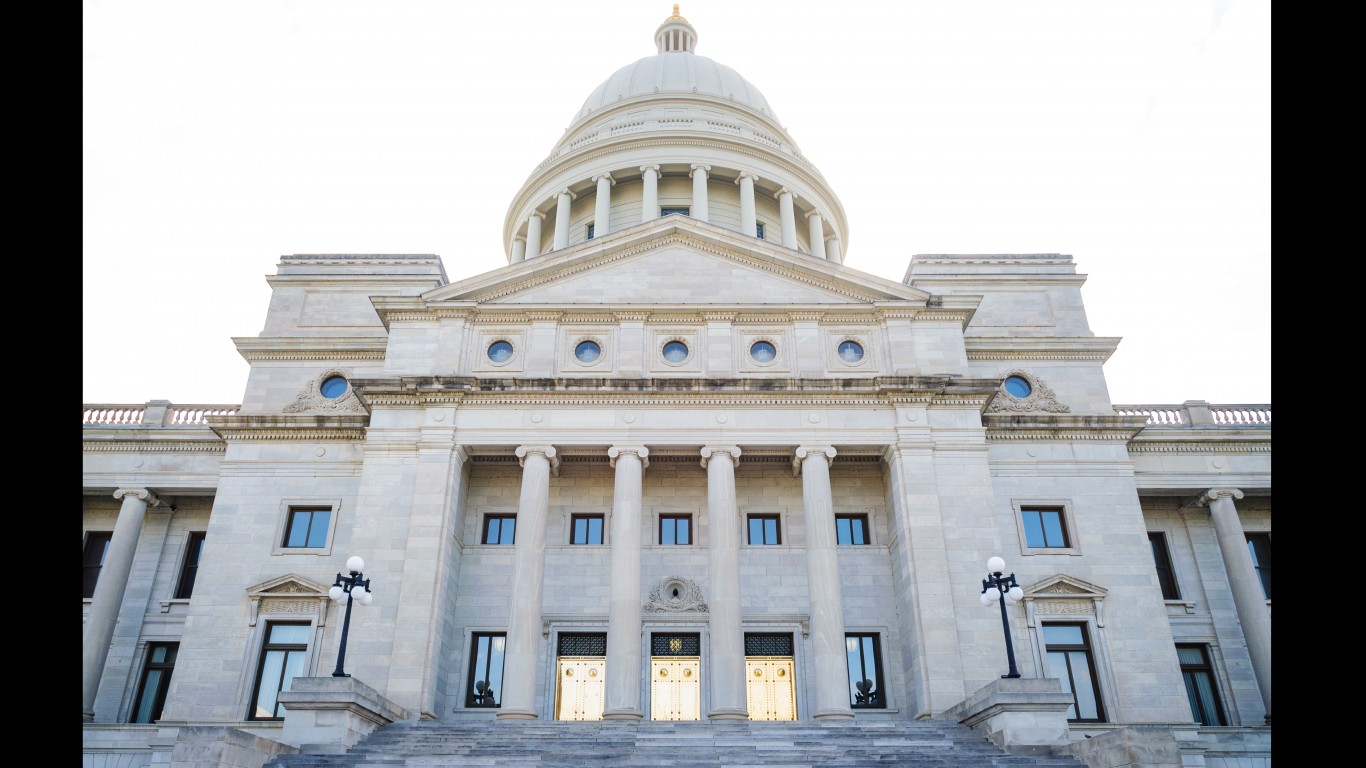
Arkansas
Source: zrfphoto / iStock via Getty Images
Source: zrfphoto / iStock via Getty Images
Arkansas’s State Capitol.
Price difference from national average: -3.72%
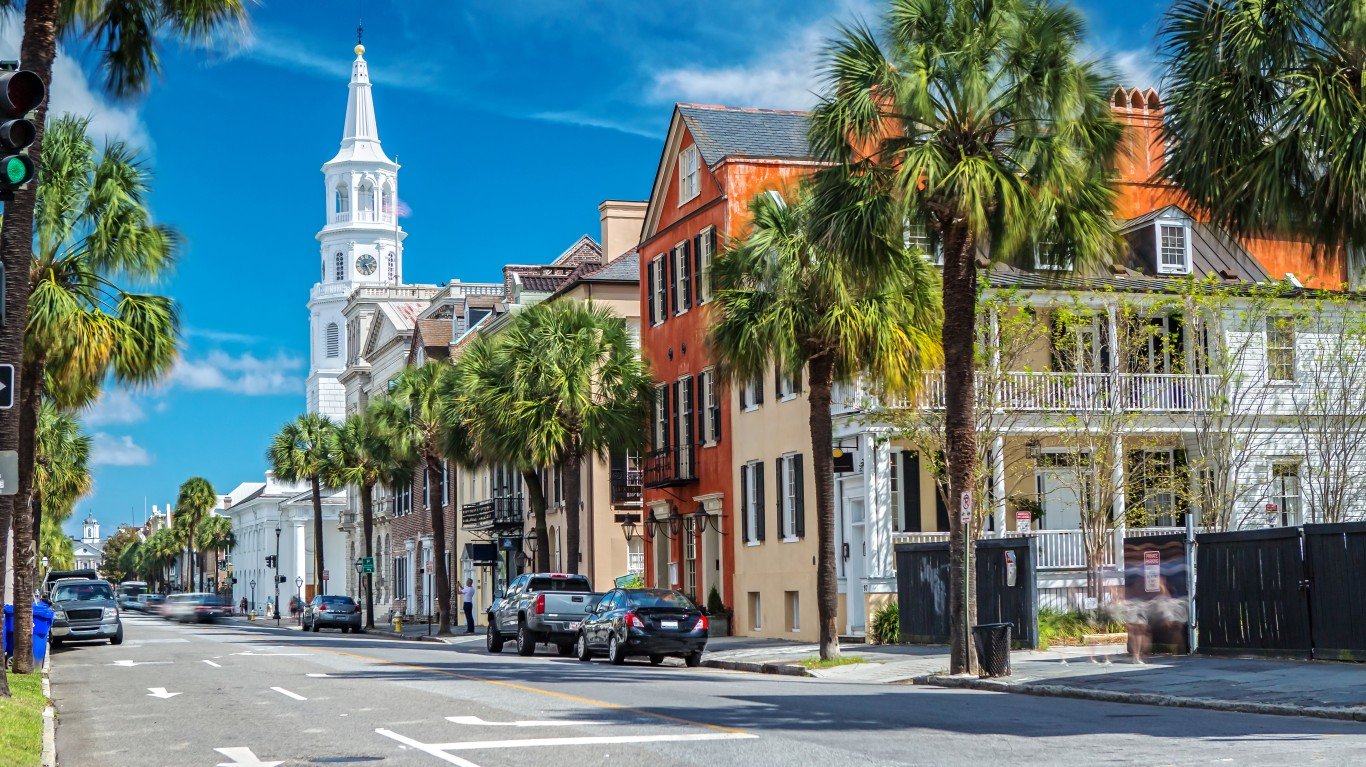
South Carolina
Source: Susanne Neumann / iStock via Getty Images
Source: Susanne Neumann / iStock via Getty Images
A street scene in Charleston.
Price difference from national average: -3.43%
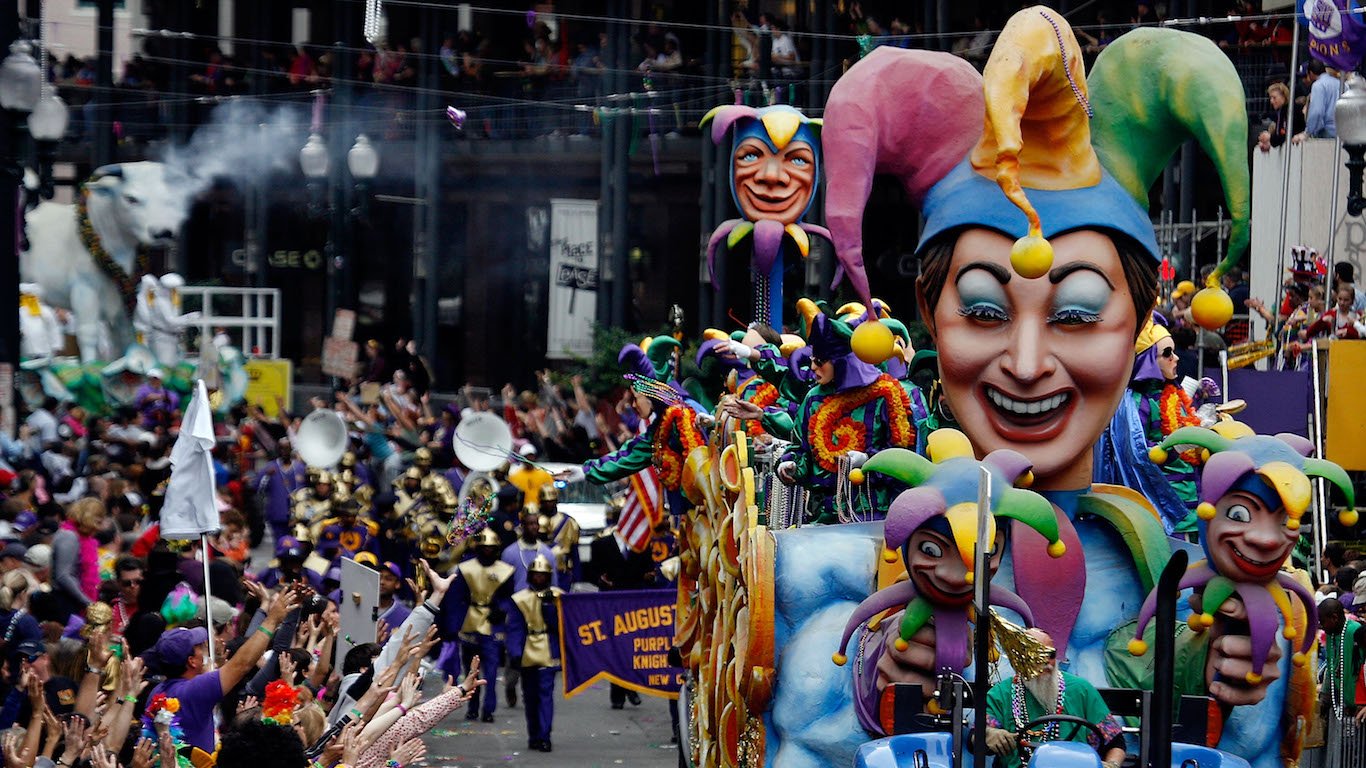
Louisiana
Source: Chris Graythen / Getty Images
Source: Chris Graythen / Getty Images
Mardi Gras on St. Charles Avenue in New Orleans.
Price difference from national average: -3.36%
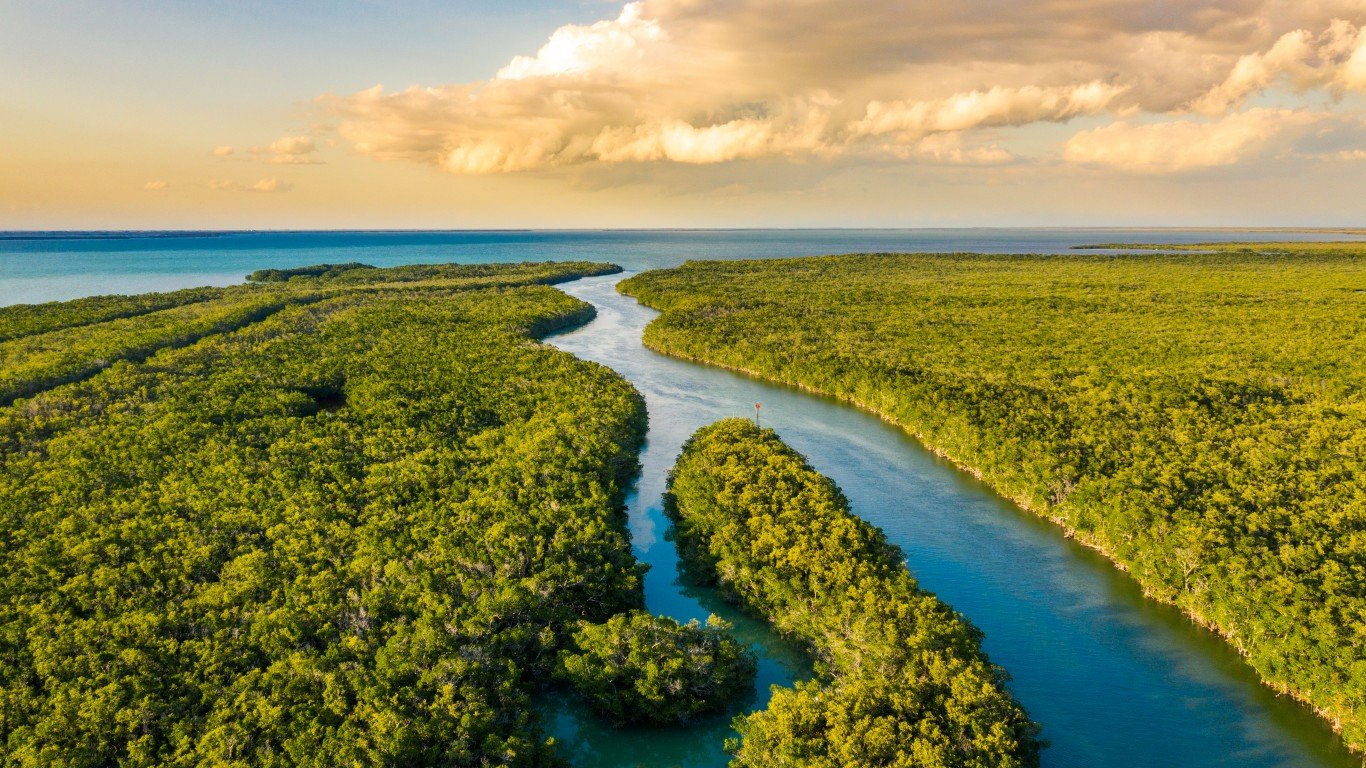
Florida
Source: SimonSkafar / iStock via Getty Images
Source: SimonSkafar / iStock via Getty Images
An aerial view of a portion of Everglades National Park.
Price difference from national average: -3.30%
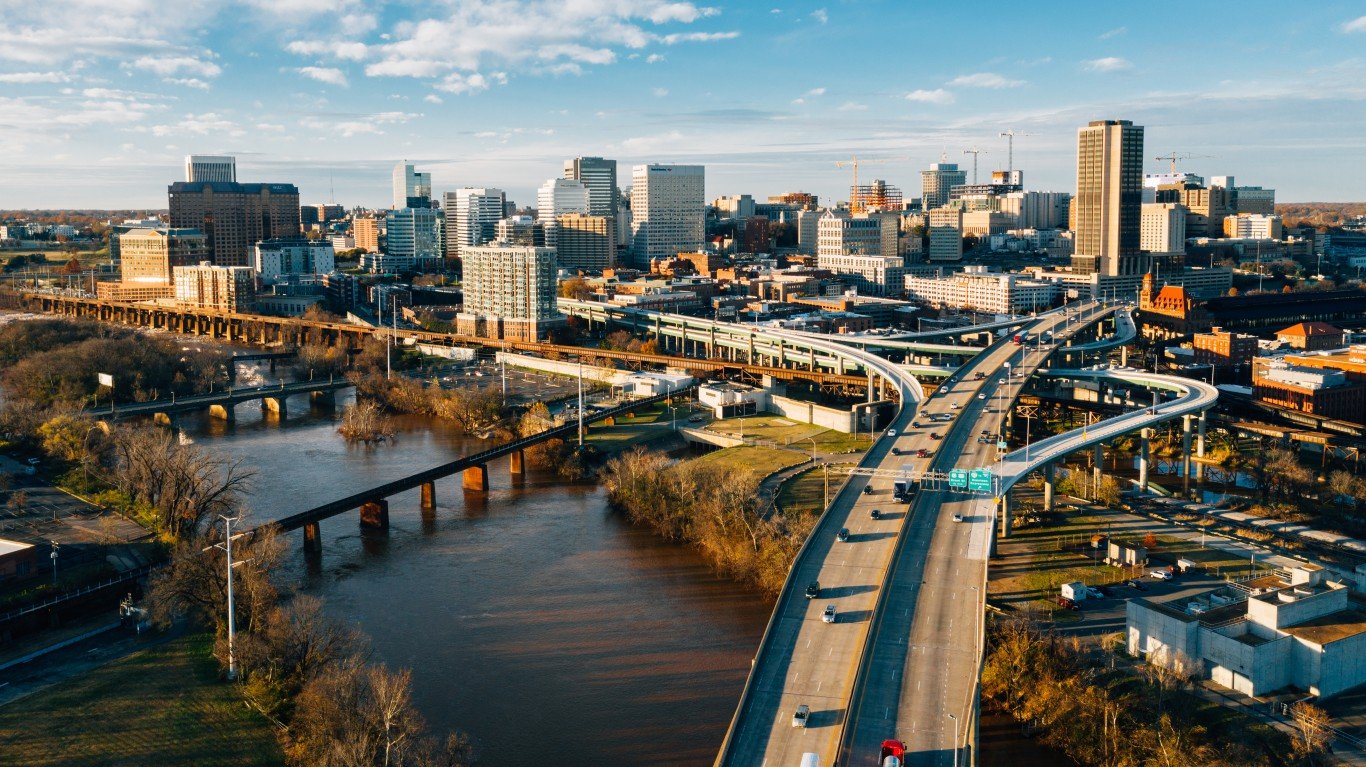
Virginia
Source: ferrantraite / E+ via Getty Images
Source: ferrantraite / E+ via Getty Images
The skyline of Richmond, the state capital.
Price difference from national average: -3.04%
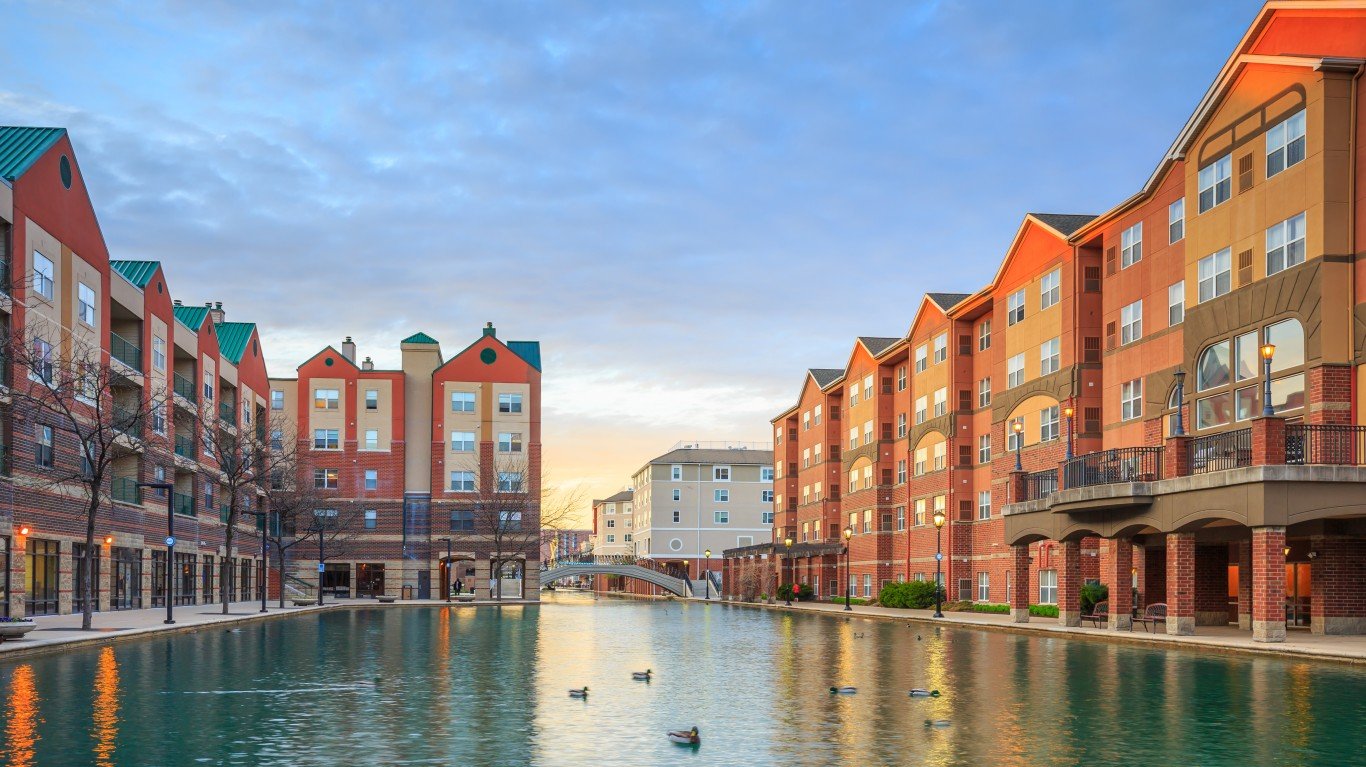
Indiana
Source: f11photo / iStock via Getty Images
Source: f11photo / iStock via Getty Images
The Indiana Central Canal through downtown Indianapolis.
Price difference from national average: -2.94%
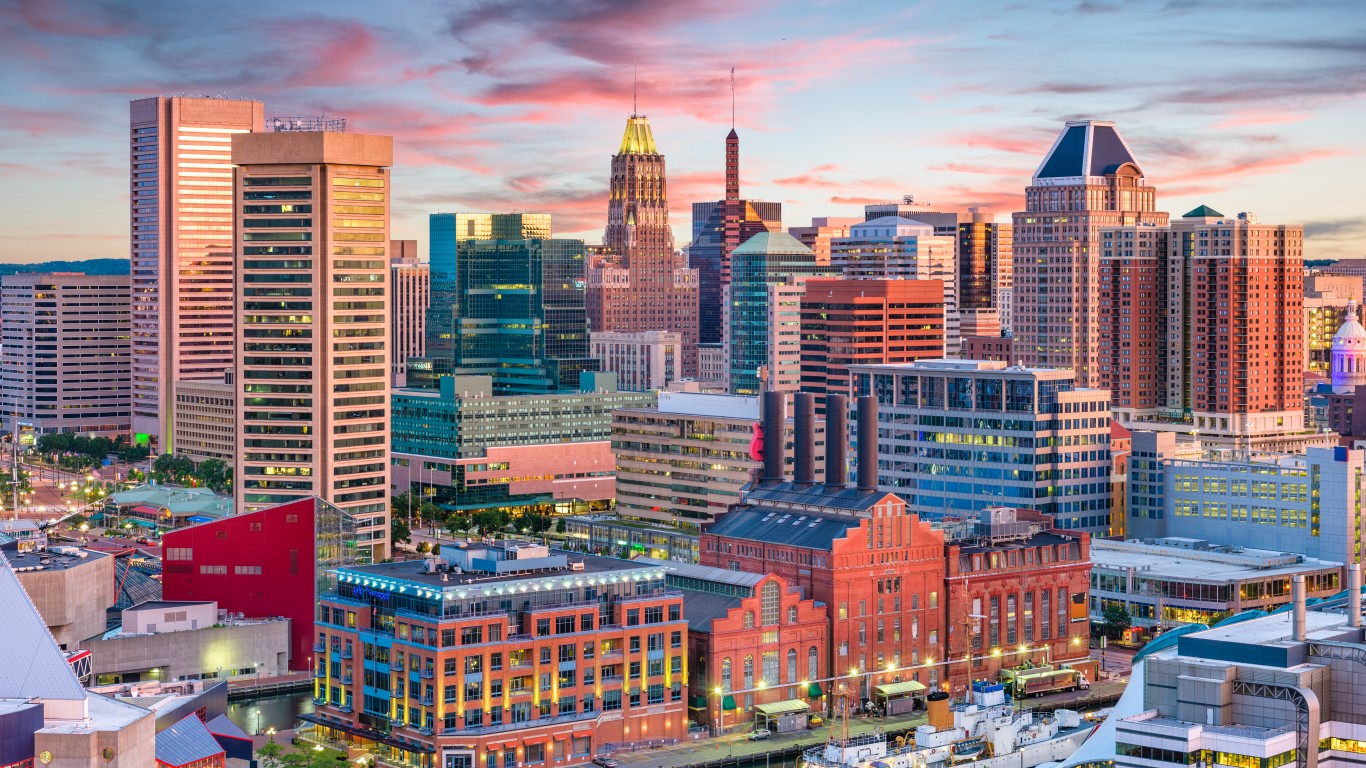
Maryland
Source: Sean Pavone / iStock via Getty Images
Source: Sean Pavone / iStock via Getty Images
The Baltimore skyline at dusk.
Price difference from national average: -2.89%
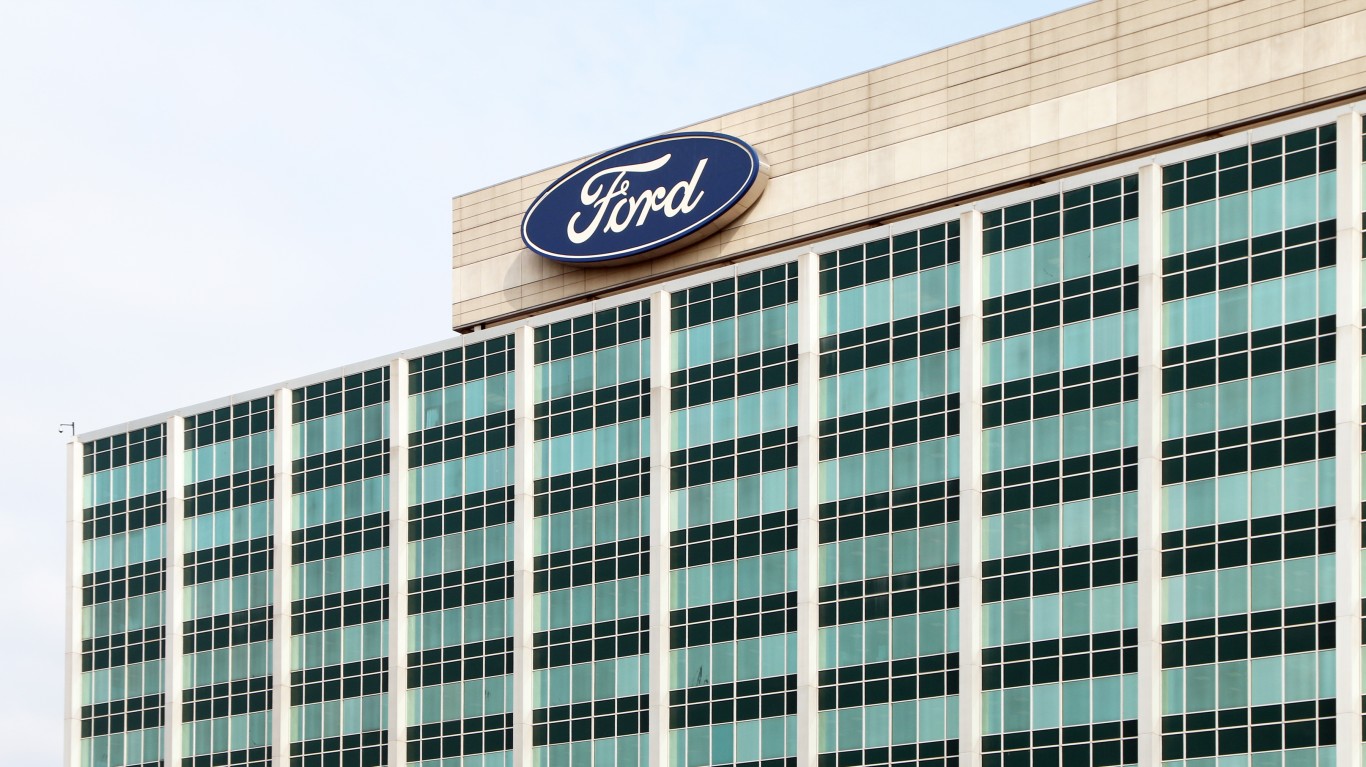
Michigan
Source: TennesseePhotographer / iStock Editorial via Getty Images
Source: TennesseePhotographer / iStock Editorial via Getty Images
Ford Motor Company’s world headquarters in Dearborn.
Price difference from national average: -2.55%
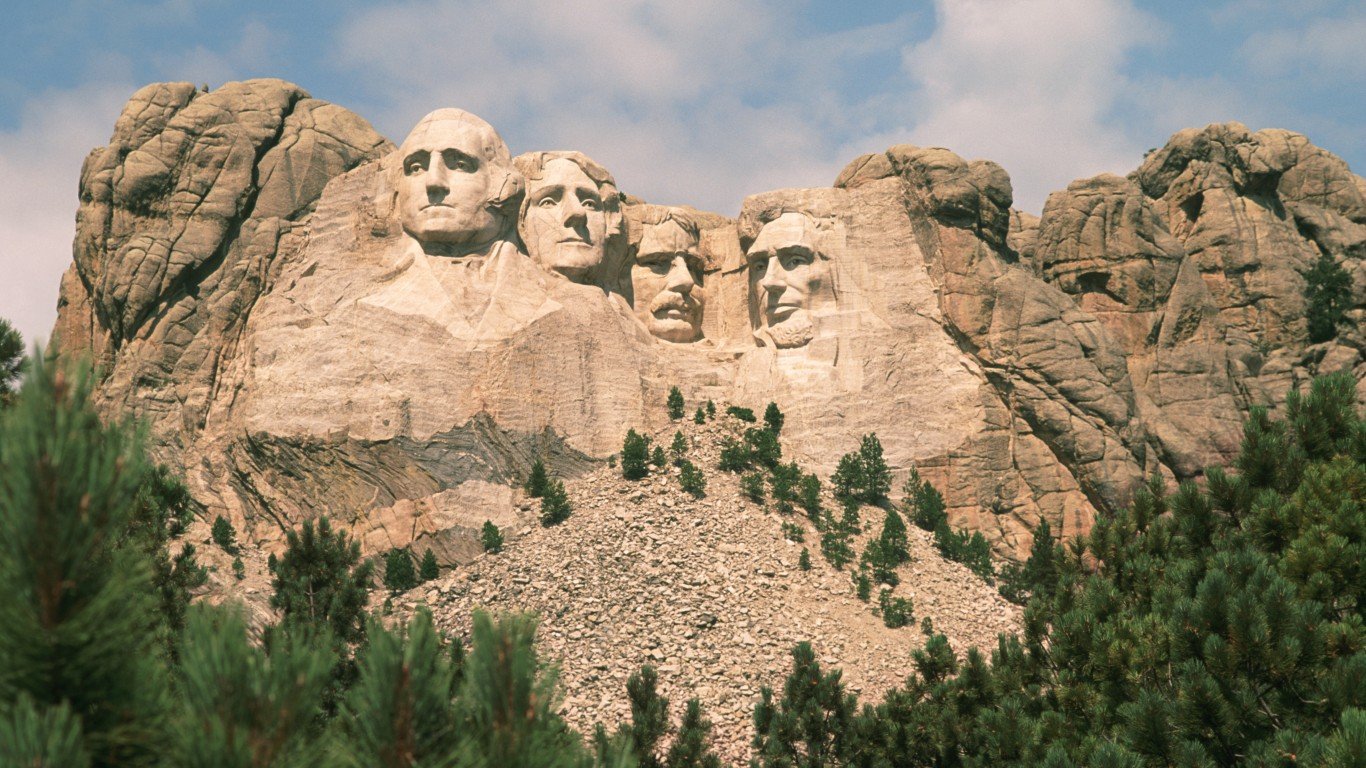
South Dakota
Source: JMichl / E+ via Getty Images
Source: JMichl / E+ via Getty Images
Mount Rushmore National Memorial in Keystone.
Price difference from national average: -2.51%
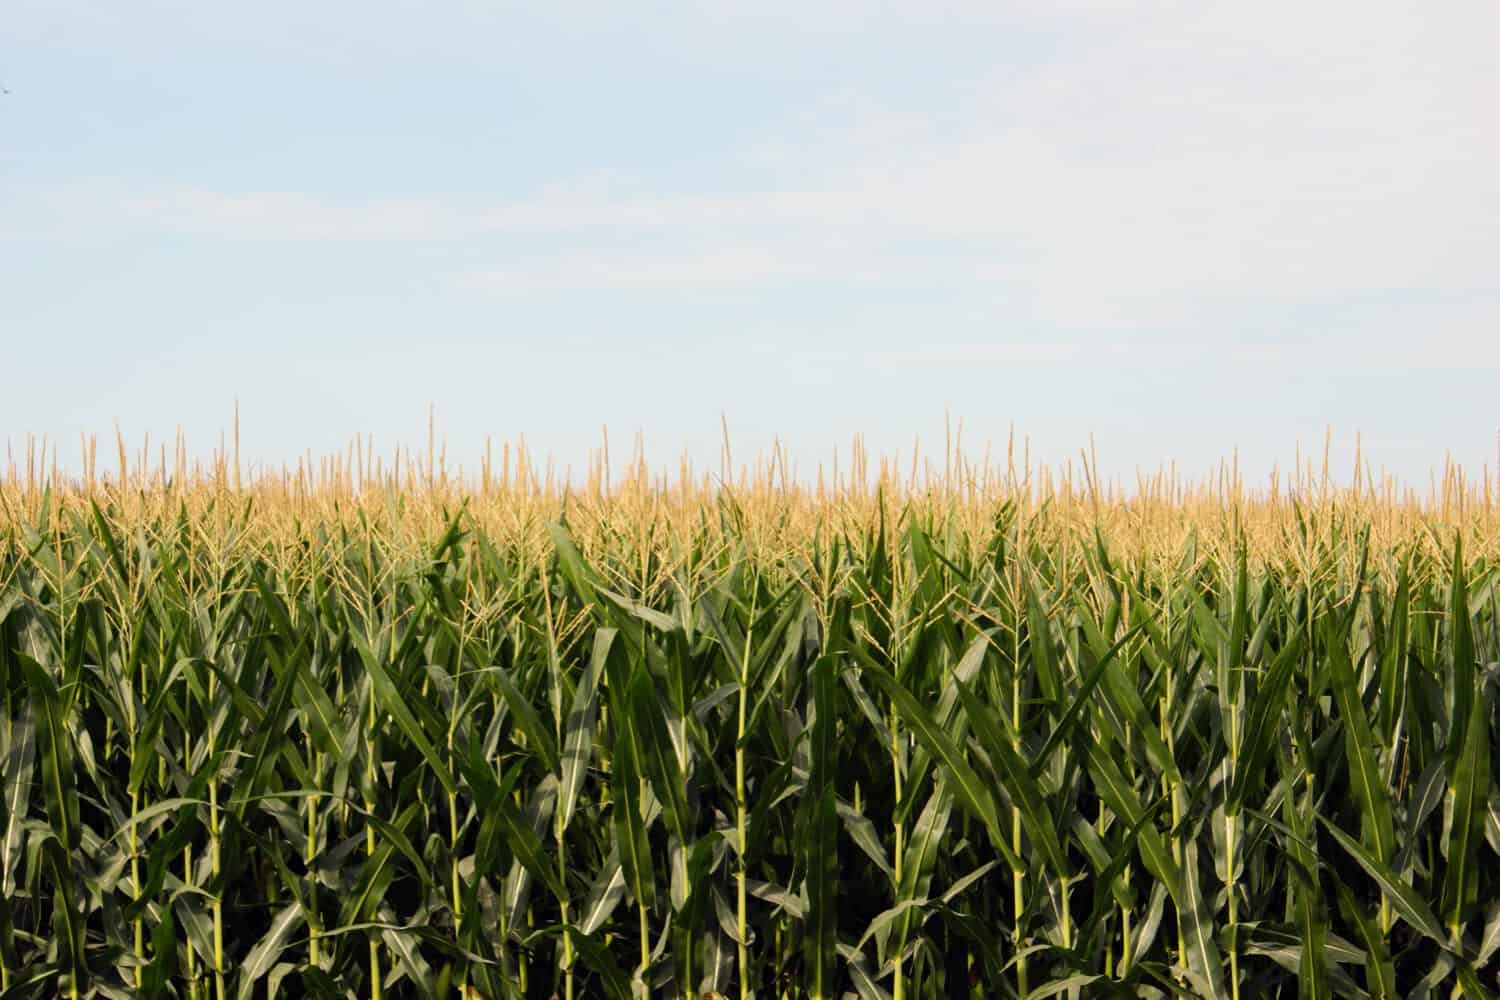
Iowa
Source: StompingGirl / Shutterstock.com
Source: StompingGirl / Shutterstock.com
An Iowa cornfield.
Price difference from national average: -1.82%
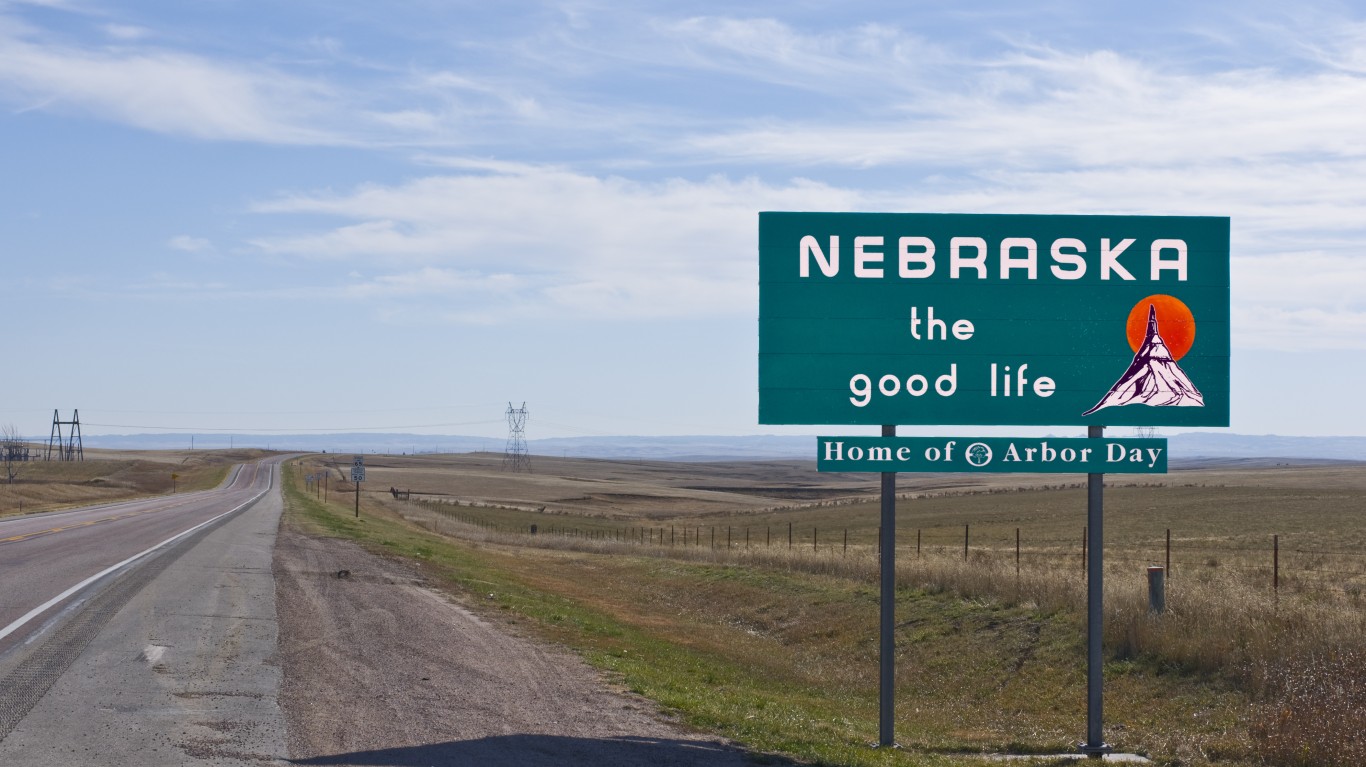
Nebraska
Source: wellesenterprises / iStock via Getty Images
Source: wellesenterprises / iStock via Getty Images
Sign on the road entering Nebraska.
Price difference from national average: -1.78%
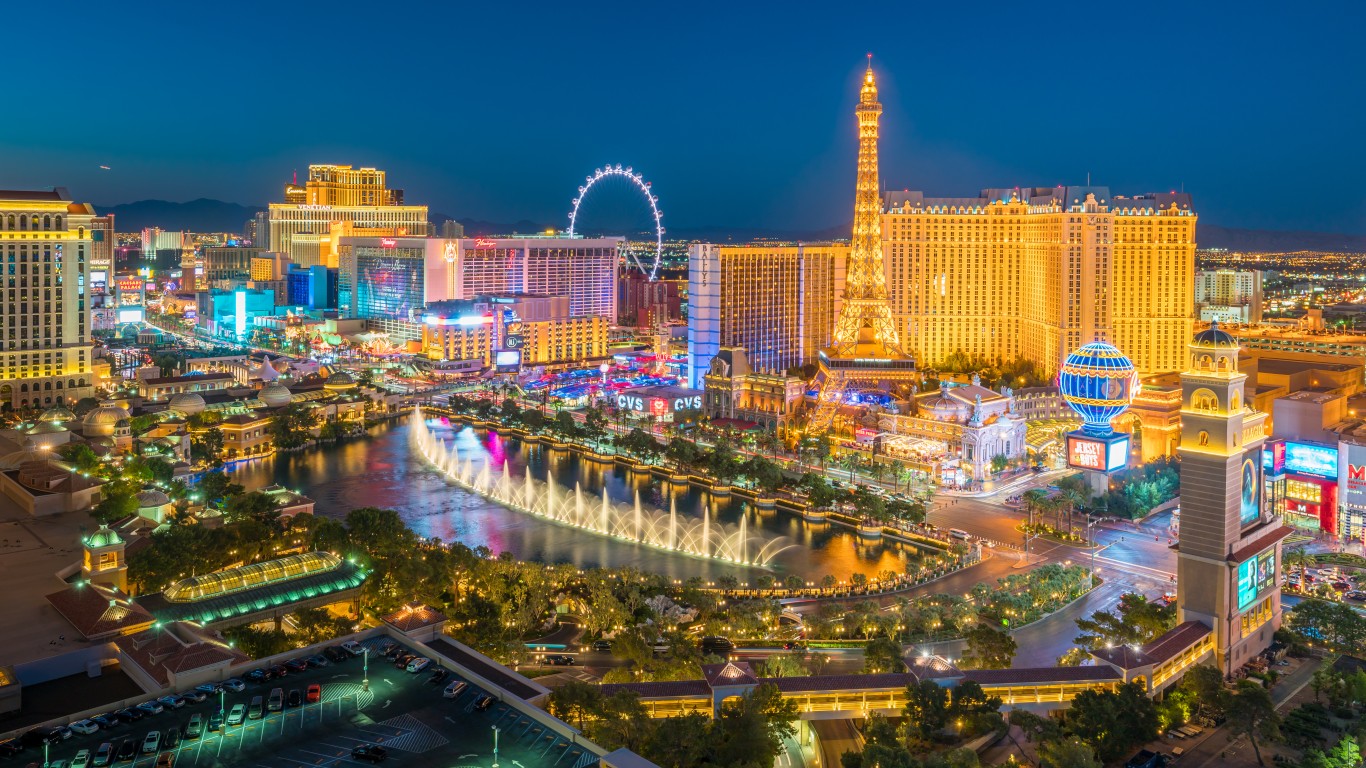
Nevada
Source: f11photo / iStock via Getty Images
Source: f11photo / iStock via Getty Images
The world-famous Las Vegas strip.
Price difference from national average: -1.33%
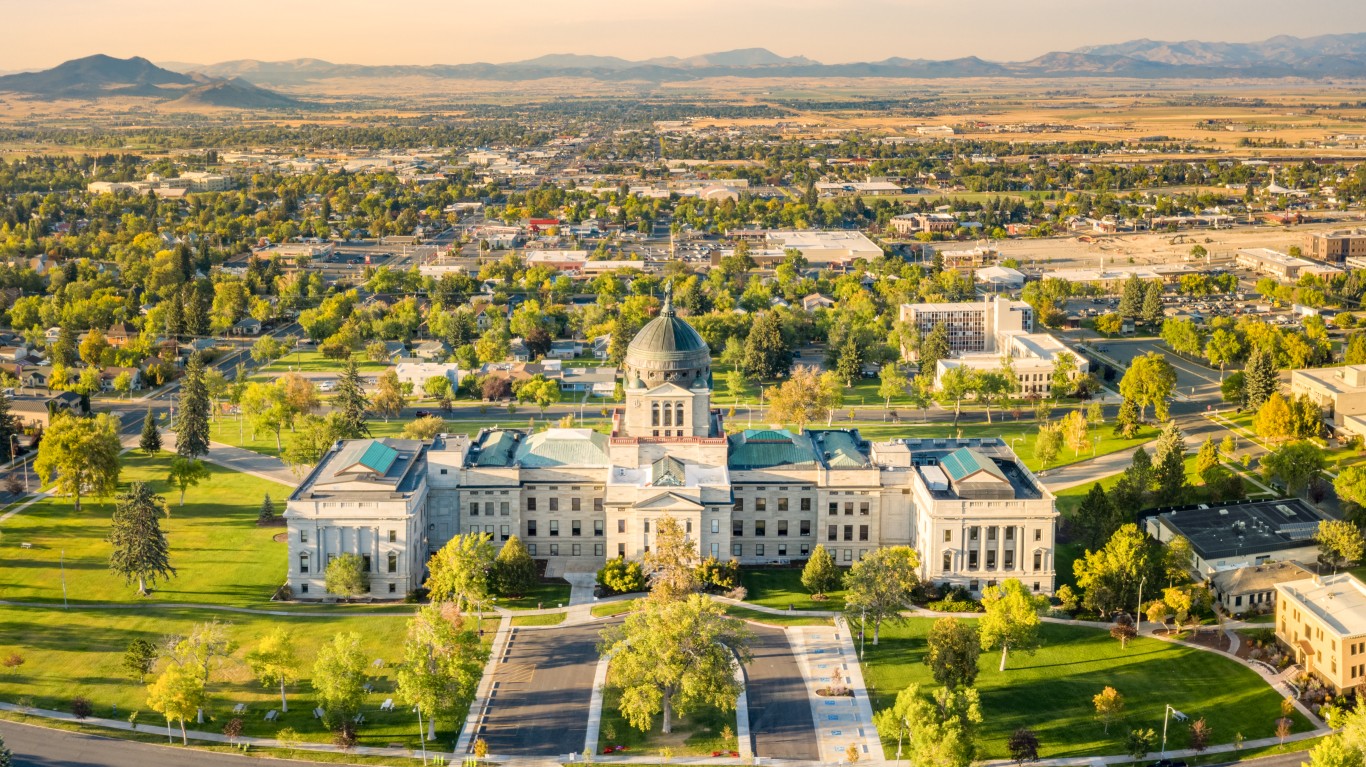
Montana
Source: Ultima_Gaina / iStock via Getty Images
Source: Ultima_Gaina / iStock via Getty Images
The Montana State Capitol in Helena (with hazy skies caused by wildfires).
Price difference from national average: -1.15%
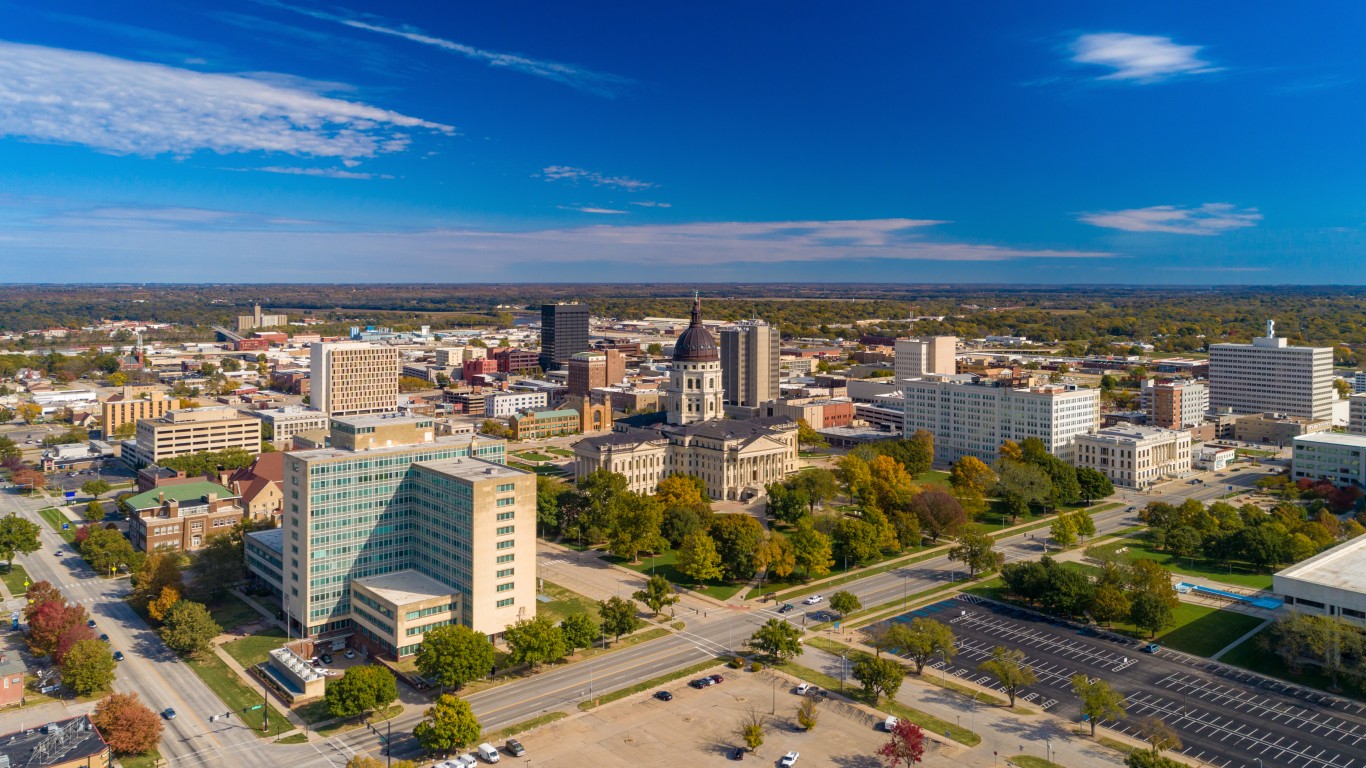
Kansas
Source: Davel5957 / E+ via Getty Images
Source: Davel5957 / E+ via Getty Images
Downtown Topeka, the state capital.
Price difference from national average: -1.02%
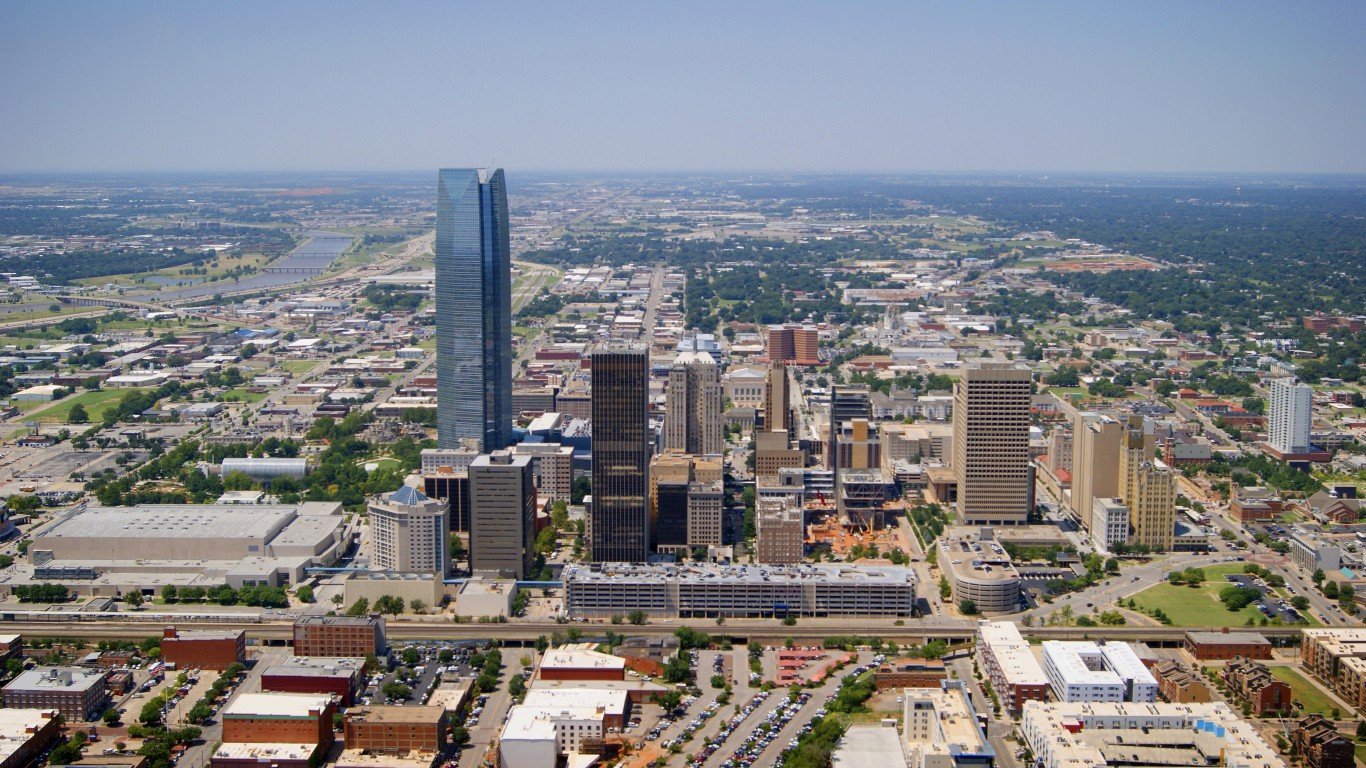
Oklahoma
Source: Majestic_Aerials / iStock via Getty Images
Source: Majestic_Aerials / iStock via Getty Images
Oklahoma City seen from the air.
Price difference from national average: -0.74%
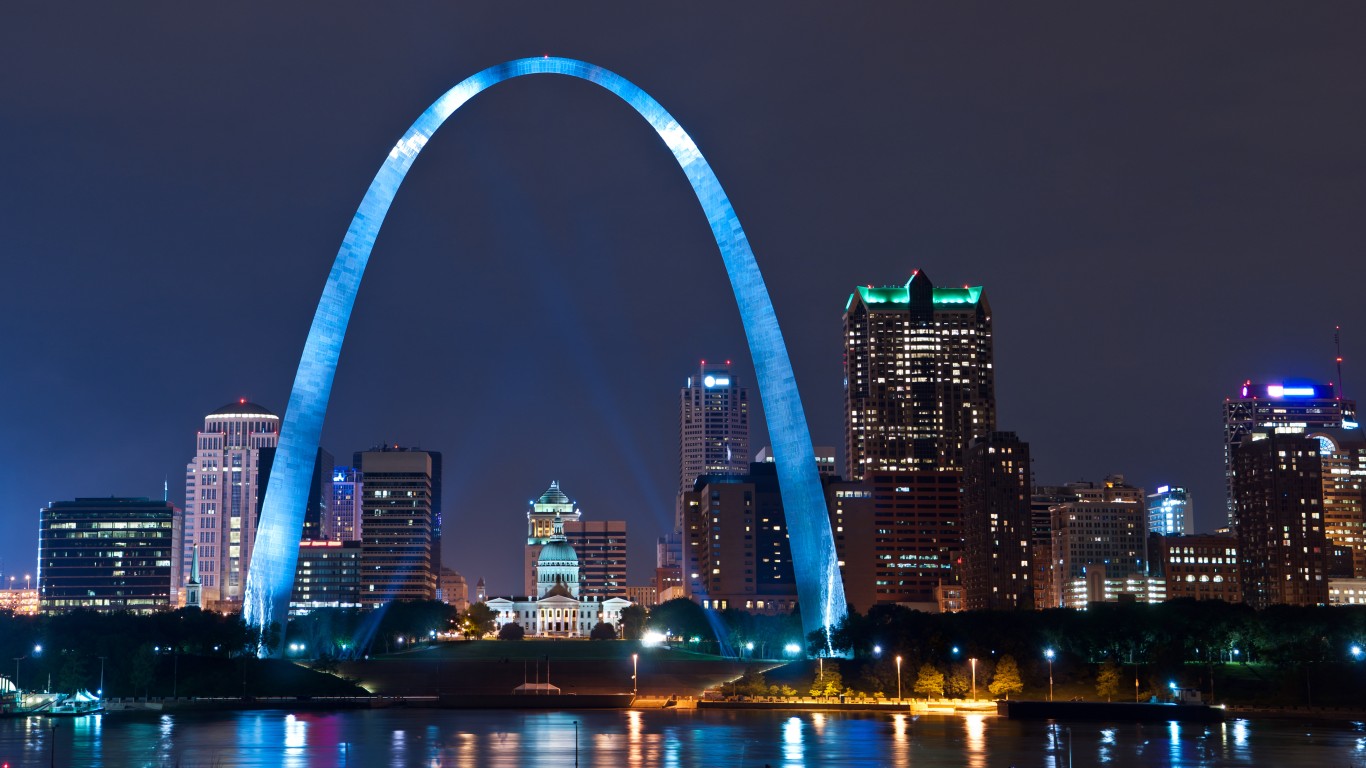
Missouri
Source: RudyBalasko / iStock via Getty Images
Source: RudyBalasko / iStock via Getty Images
The Gateway Arch, with downtown St. Louis in the background.
Price difference from national average: -0.13%
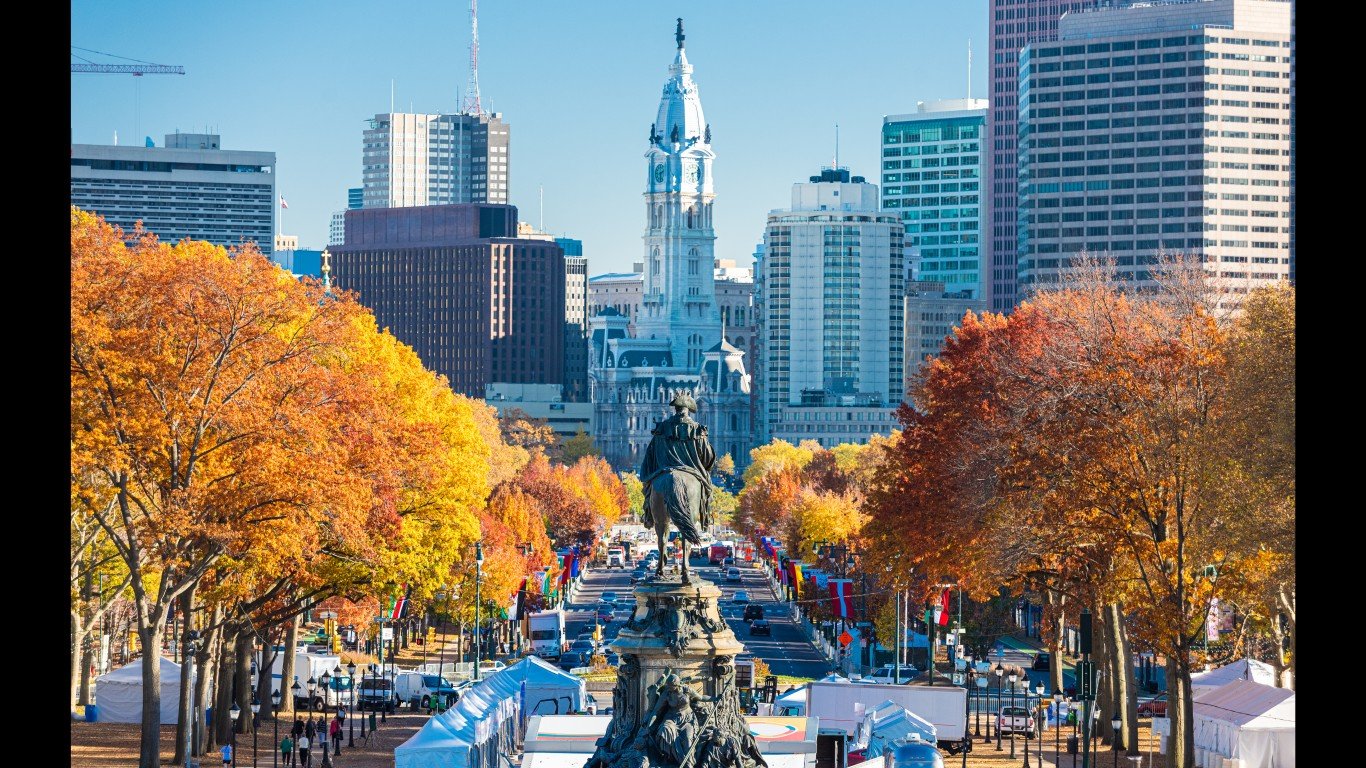
Pennsylvania
Source: Sean Pavone / iStock via Getty Images
Source: Sean Pavone / iStock via Getty Images
Looking down Benjamin Franklin Parkway in Philadelphia.
Price difference from national average: -0.13%
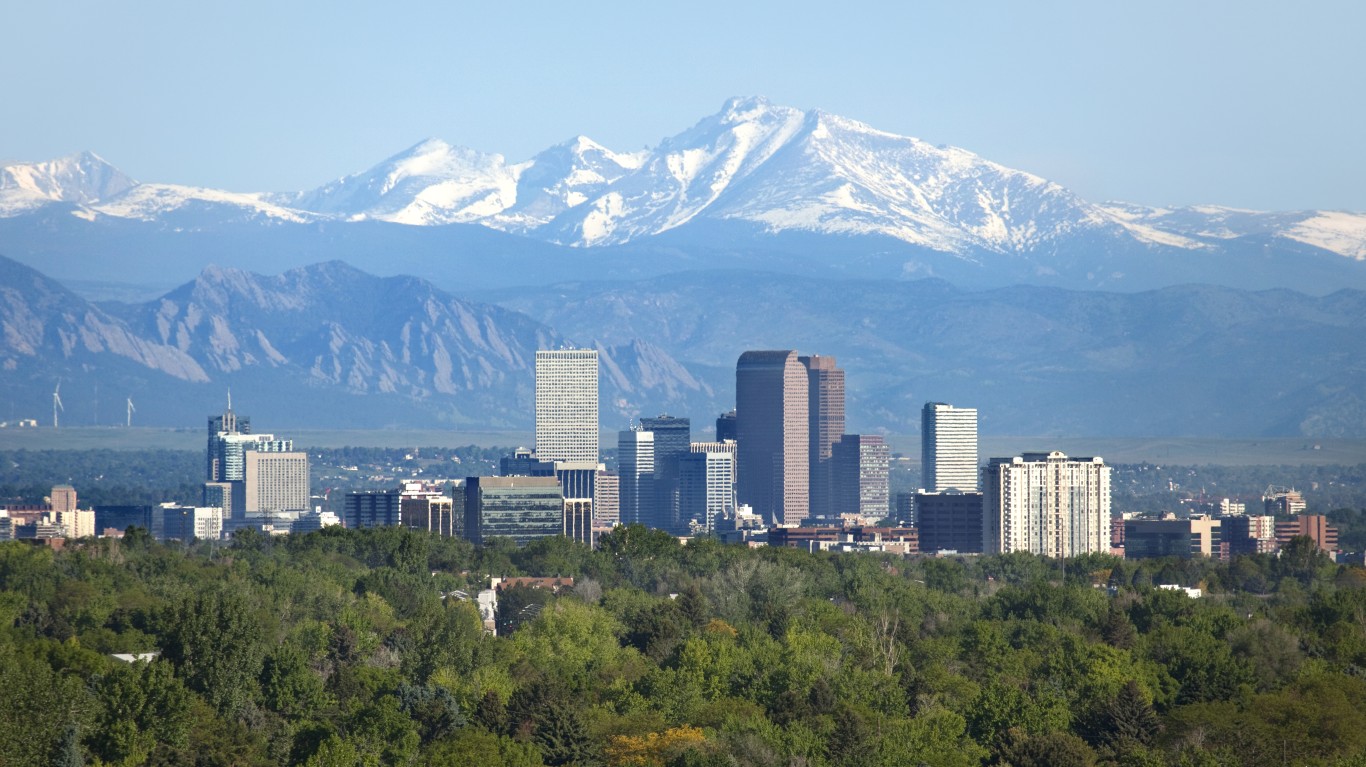
Colorado
Source: milehightraveler / iStock via Getty Images
Source: milehightraveler / iStock via Getty Images
Longs Peak towers behind downtown Denver.
Price difference from national average: -0.11%
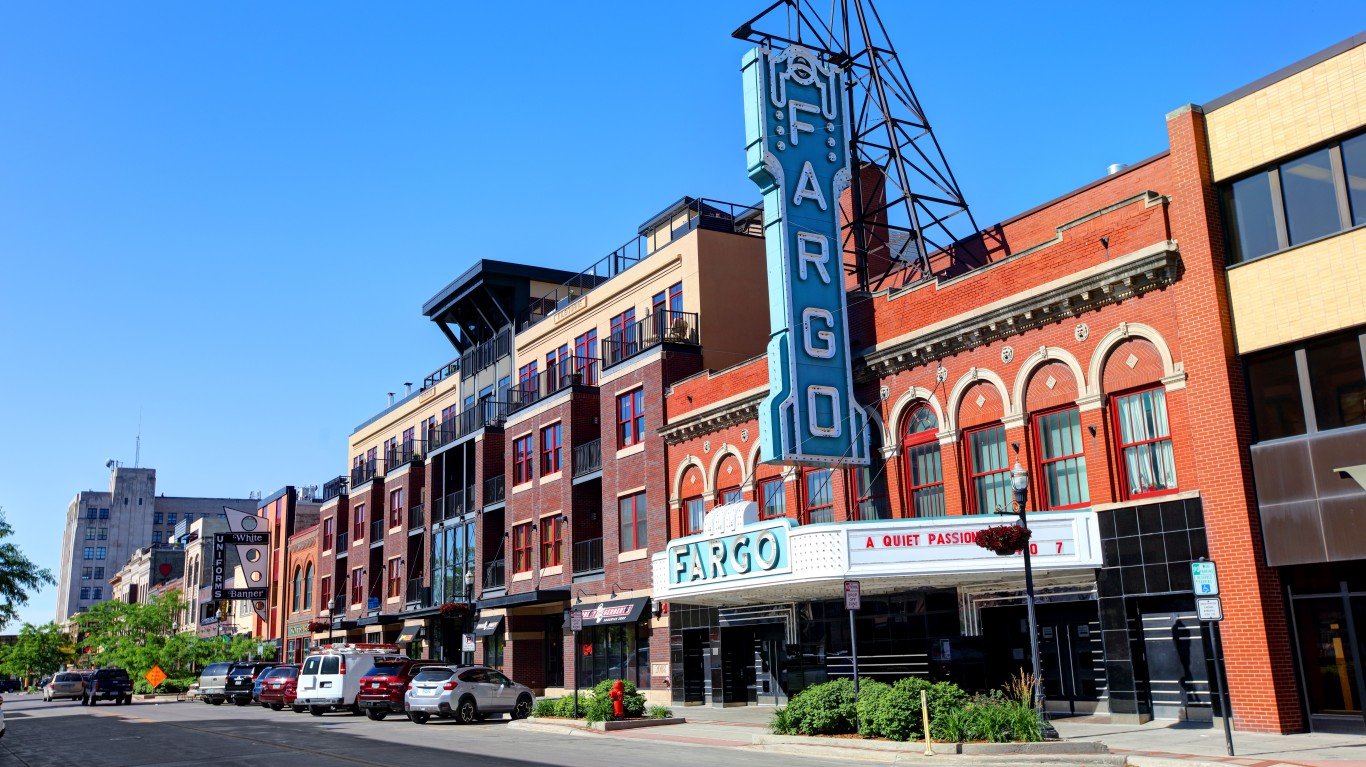
North Dakota
Source: DenisTangneyJr / iStock Unreleased via Getty Images
Source: DenisTangneyJr / iStock Unreleased via Getty Images
The Fargo Theater in Fargo’s Downtown Historic District.
Price difference from national average: 0.02%
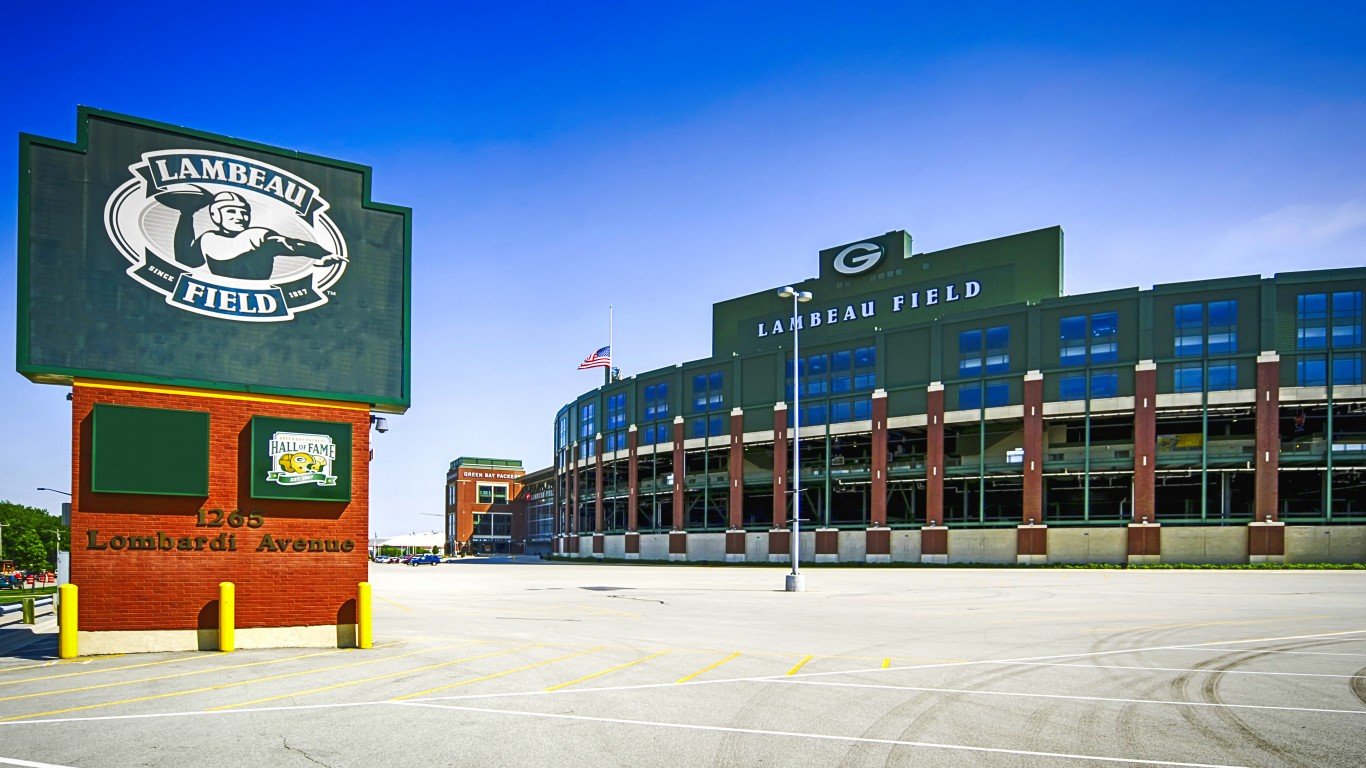
Wisconsin
Source: csfotoimages / iStock Editorial via Getty Images
Source: csfotoimages / iStock Editorial via Getty Images
Lambeau Field, home of the Green Bay Packers, winners of four Super Bowl championships.
Price difference from national average: 0.03%
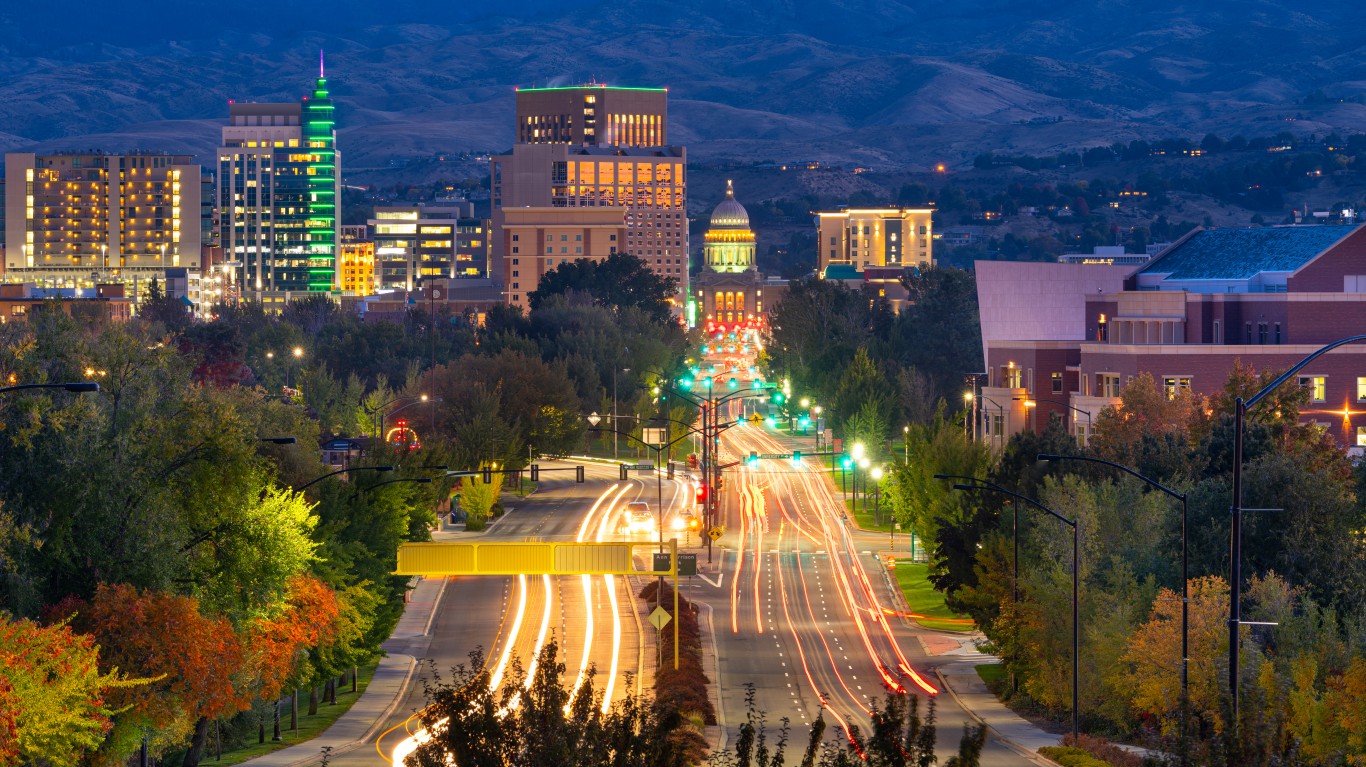
Idaho
Source: Sean Pavone / iStock via Getty Images
Source: Sean Pavone / iStock via Getty Images
An evening view of Boise.
Price difference from national average: 0.09%
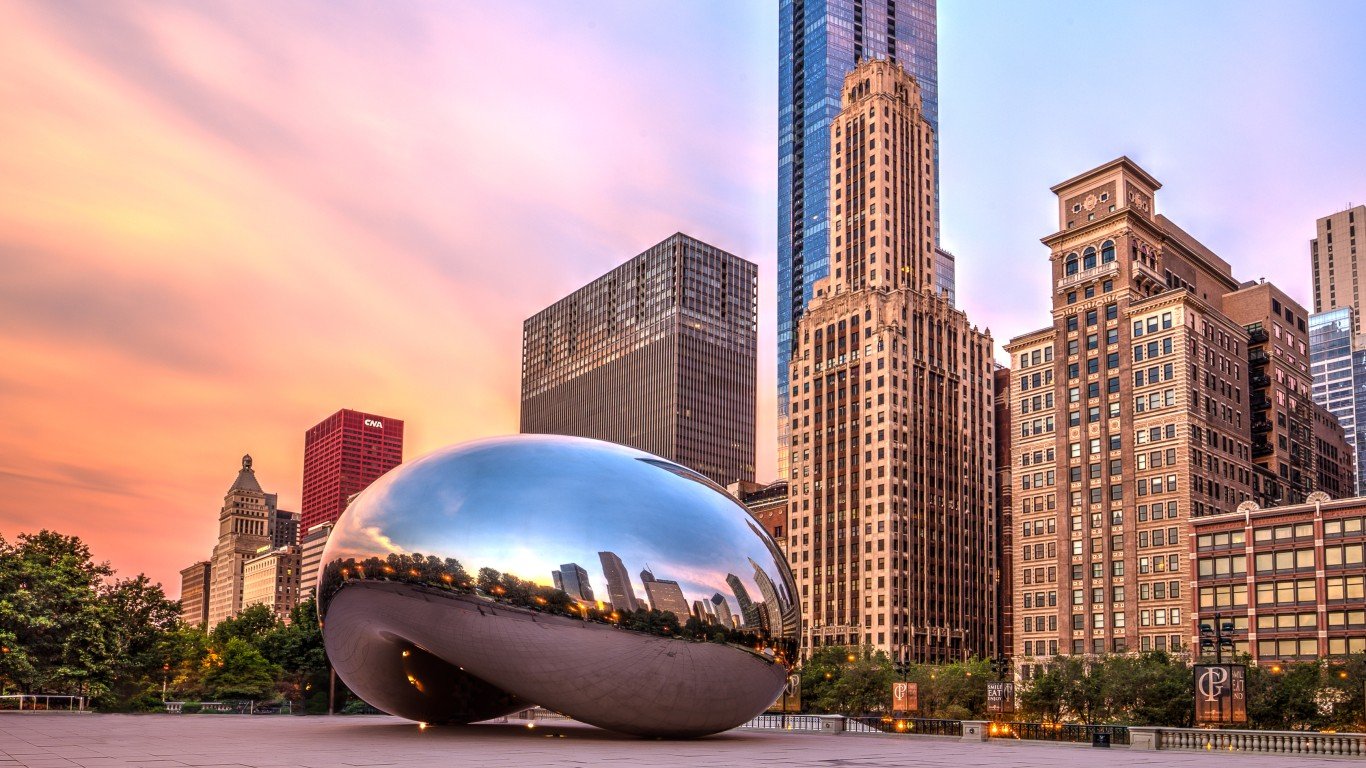
Illinois
Source: lhongfoto / iStock Unreleased via Getty Images
Source: lhongfoto / iStock Unreleased via Getty Images
Anish Kapoor’s sculpture “Cloud Gate” (aka “The Bean”) in Chicago’s Millennium Park.
Price difference from national average: 0.12%
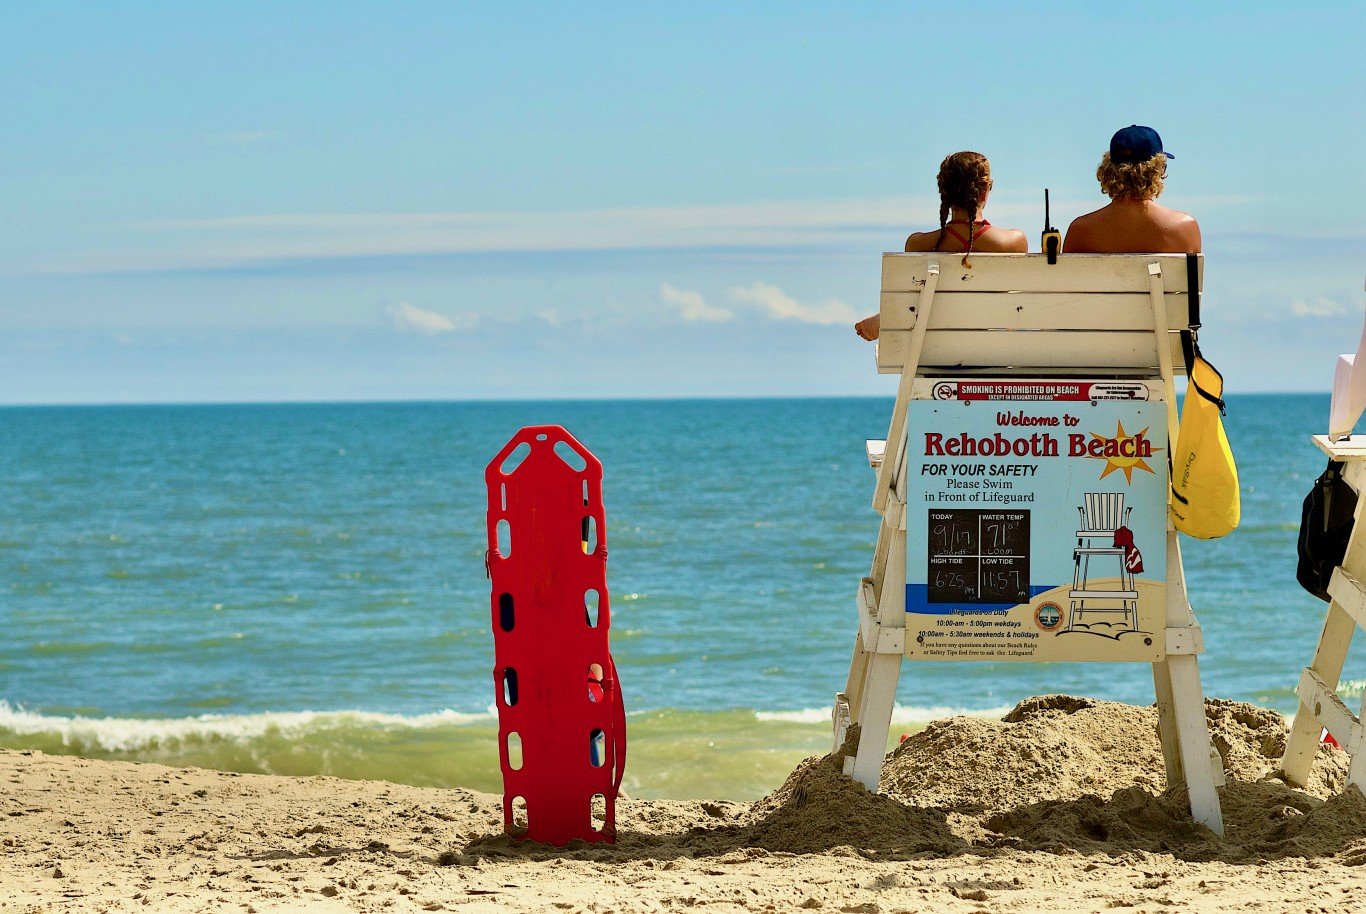
Delaware
Source: John M. Chase / iStock Unreleased via Getty Images
Source: John M. Chase / iStock Unreleased via Getty Images
Lifeguards at Delaware’s Rehoboth Beach.
Price difference from national average: 1.62%
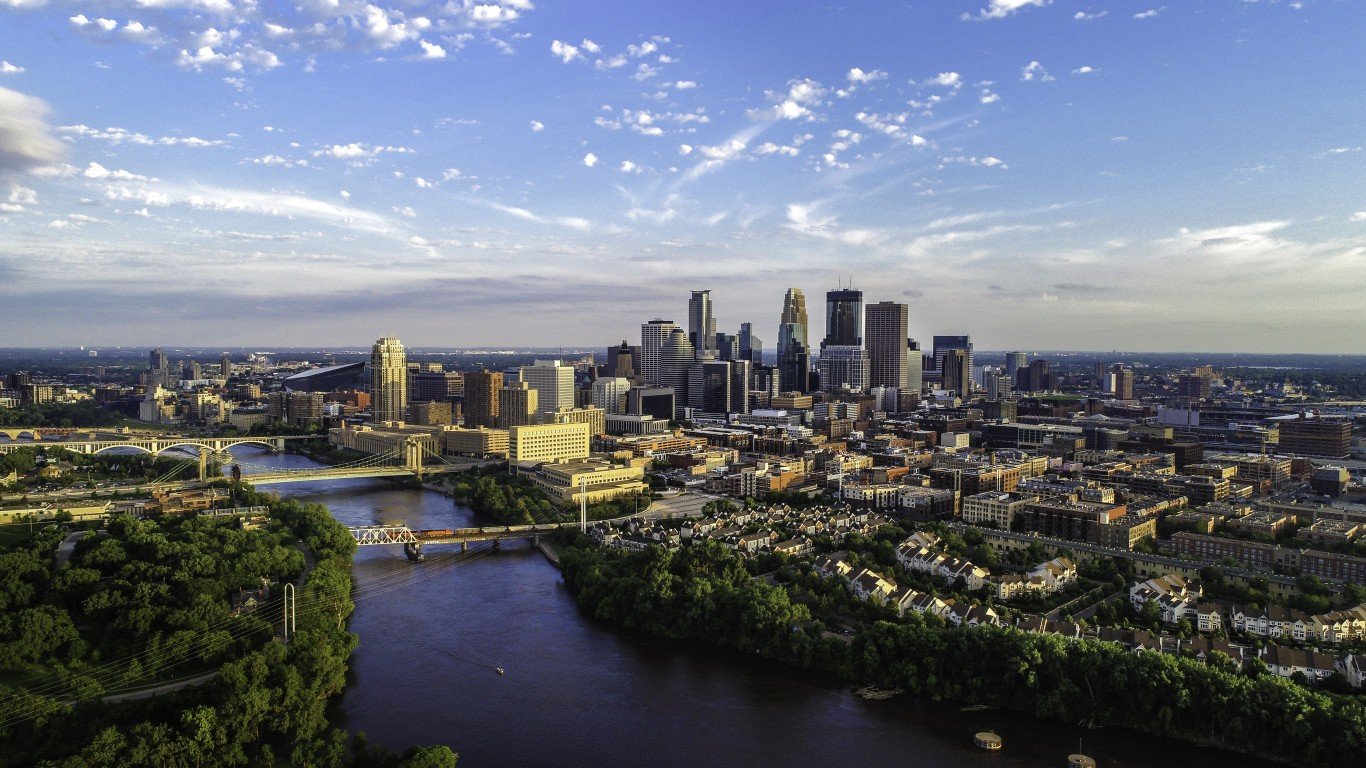
Minnesota
Source: Gian Lorenzo Ferretti Photography / E+ via Getty Images
Source: Gian Lorenzo Ferretti Photography / E+ via Getty Images
The Mississippi River flowing through Minneapolis.
Price difference from national average: 2.34%
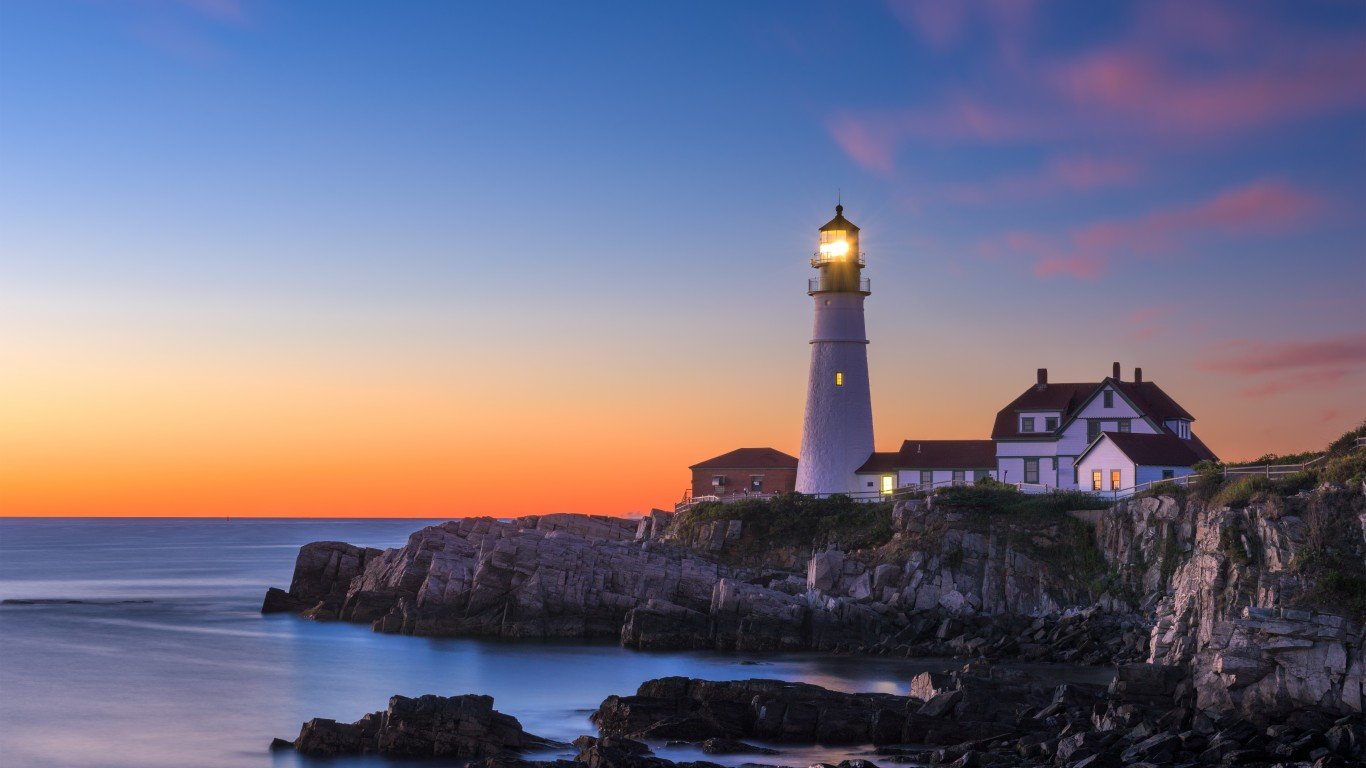
Maine
Source: SeanPavonePhoto / iStock via Getty Images
Source: SeanPavonePhoto / iStock via Getty Images
Portland Head Light on Cape Elizabeth.
Price difference from national average: 2.93%
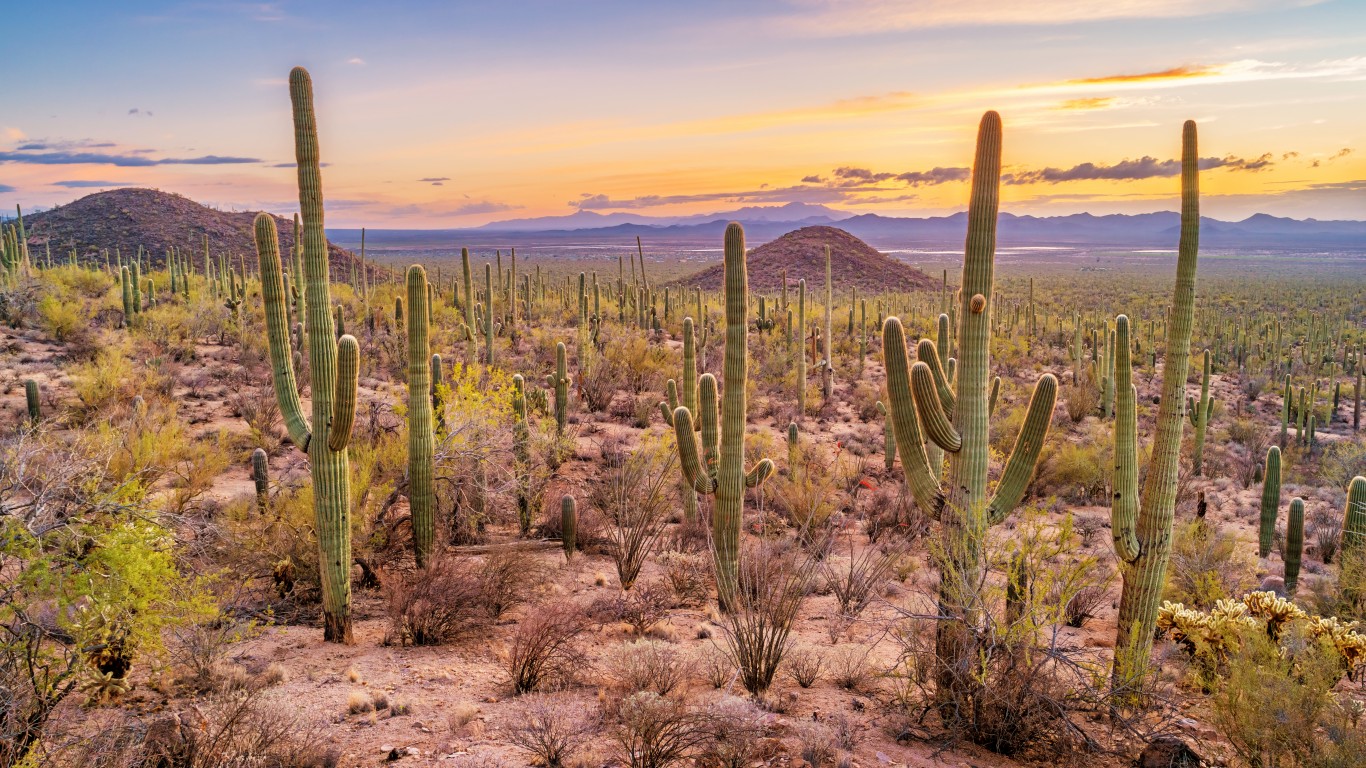
Arizona
Source: benedek / E+ via Getty Images
Source: benedek / E+ via Getty Images
A field of saguaro cactus in Saguaro National Park.
Price difference from national average: 3.07%
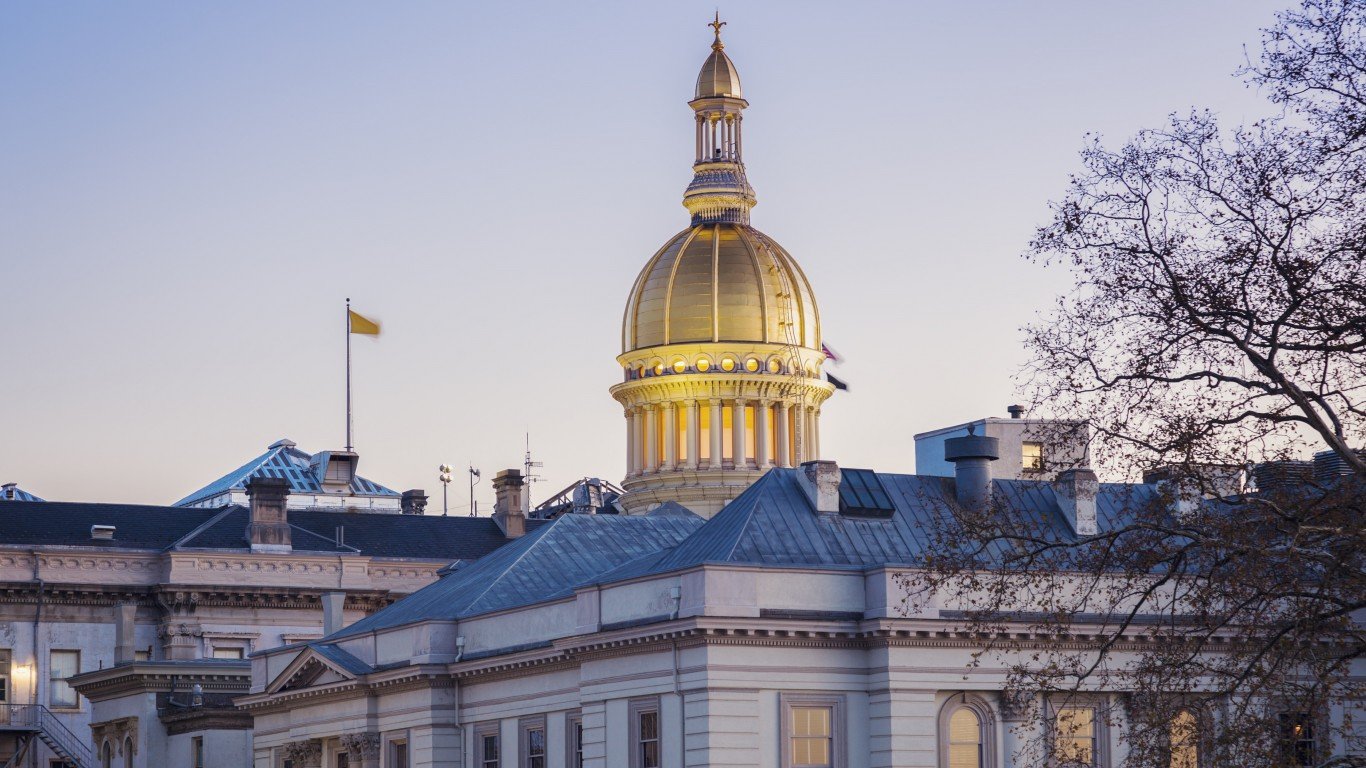
New Jersey
Source: benkrut / iStock via Getty Images
Source: benkrut / iStock via Getty Images
The State Capitol in Trenton.
Price difference from national average: 5.06%
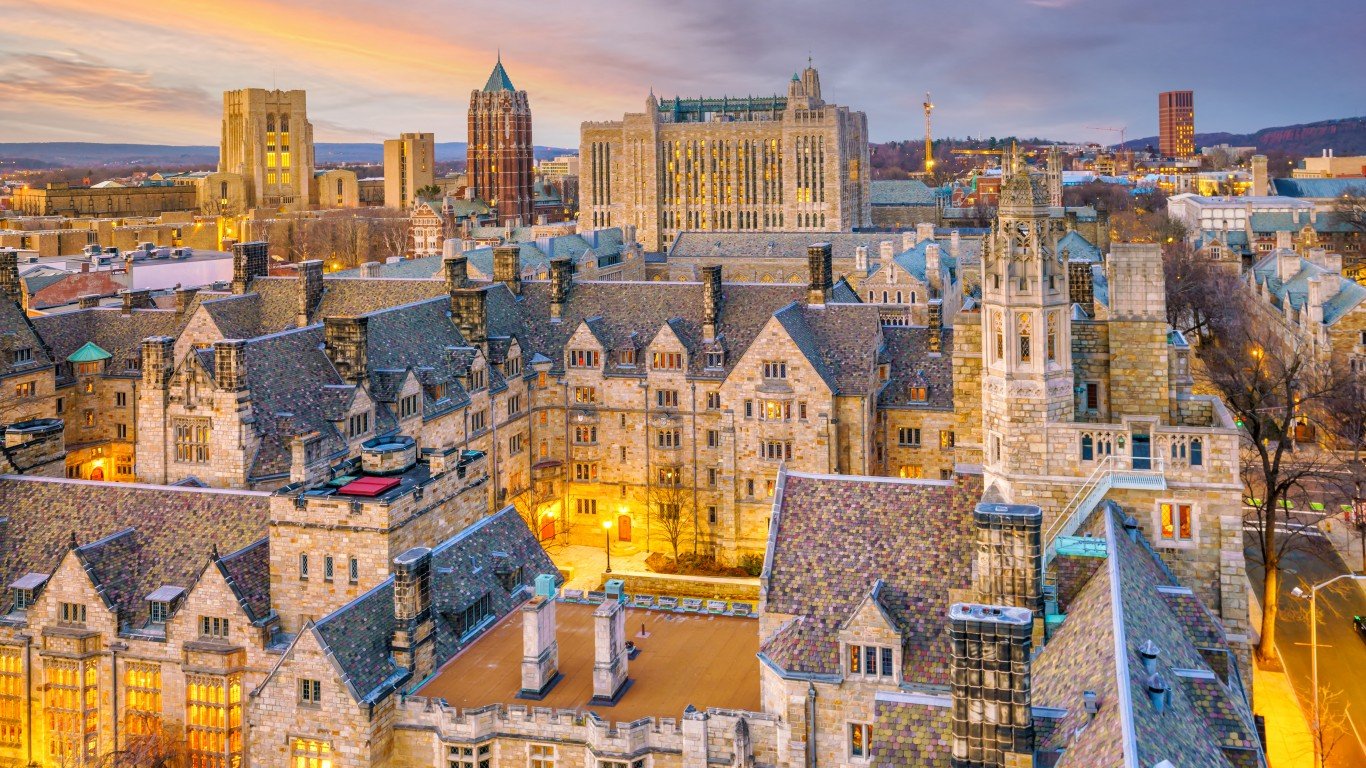
Connecticut
Source: f11photo / iStock via Getty Images
Source: f11photo / iStock via Getty Images
Yale University buildings in downtown New Haven.
Price difference from national average: 5.13%
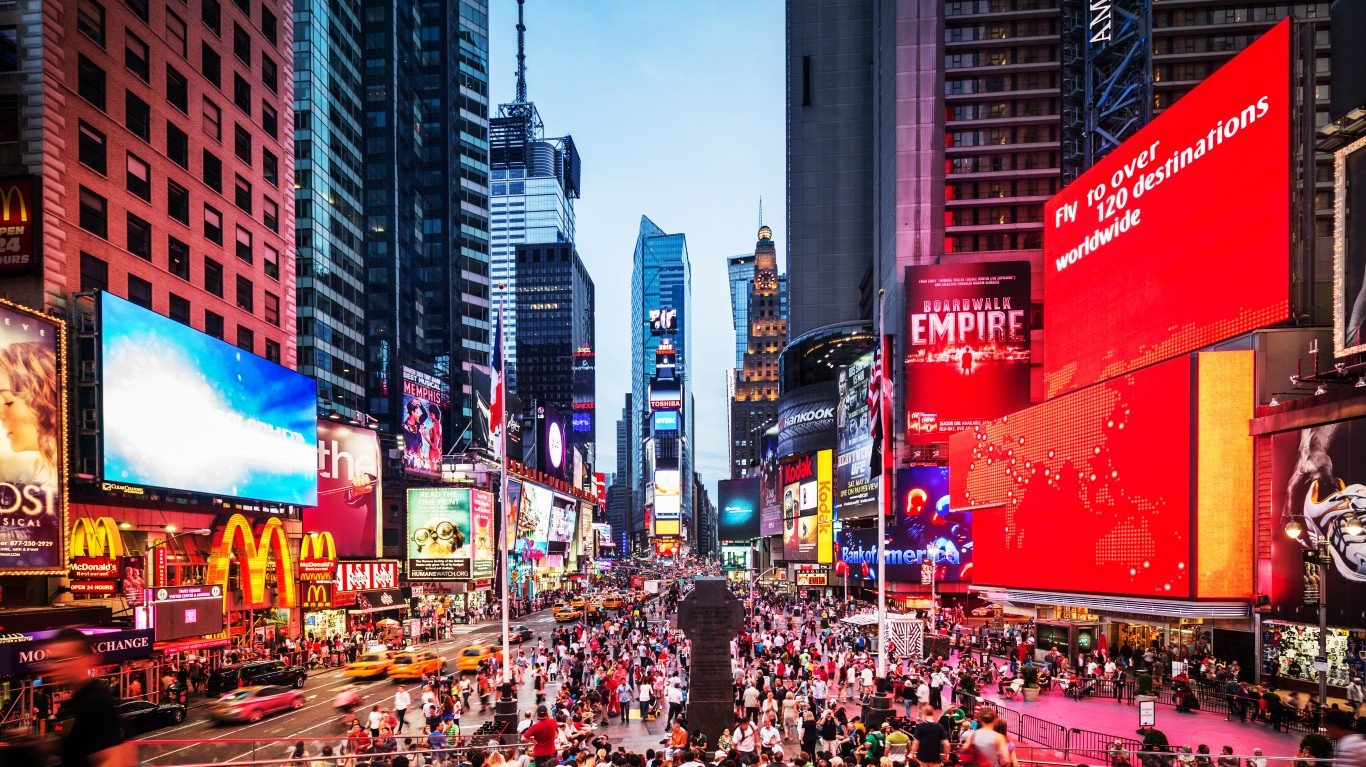
New York
Source: TommL / Getty Images
Source: TommL / Getty Images
Crowds in New York City’s Times Square, the so-called “Crossroads of the World.”
Price difference from national average: 5.96%
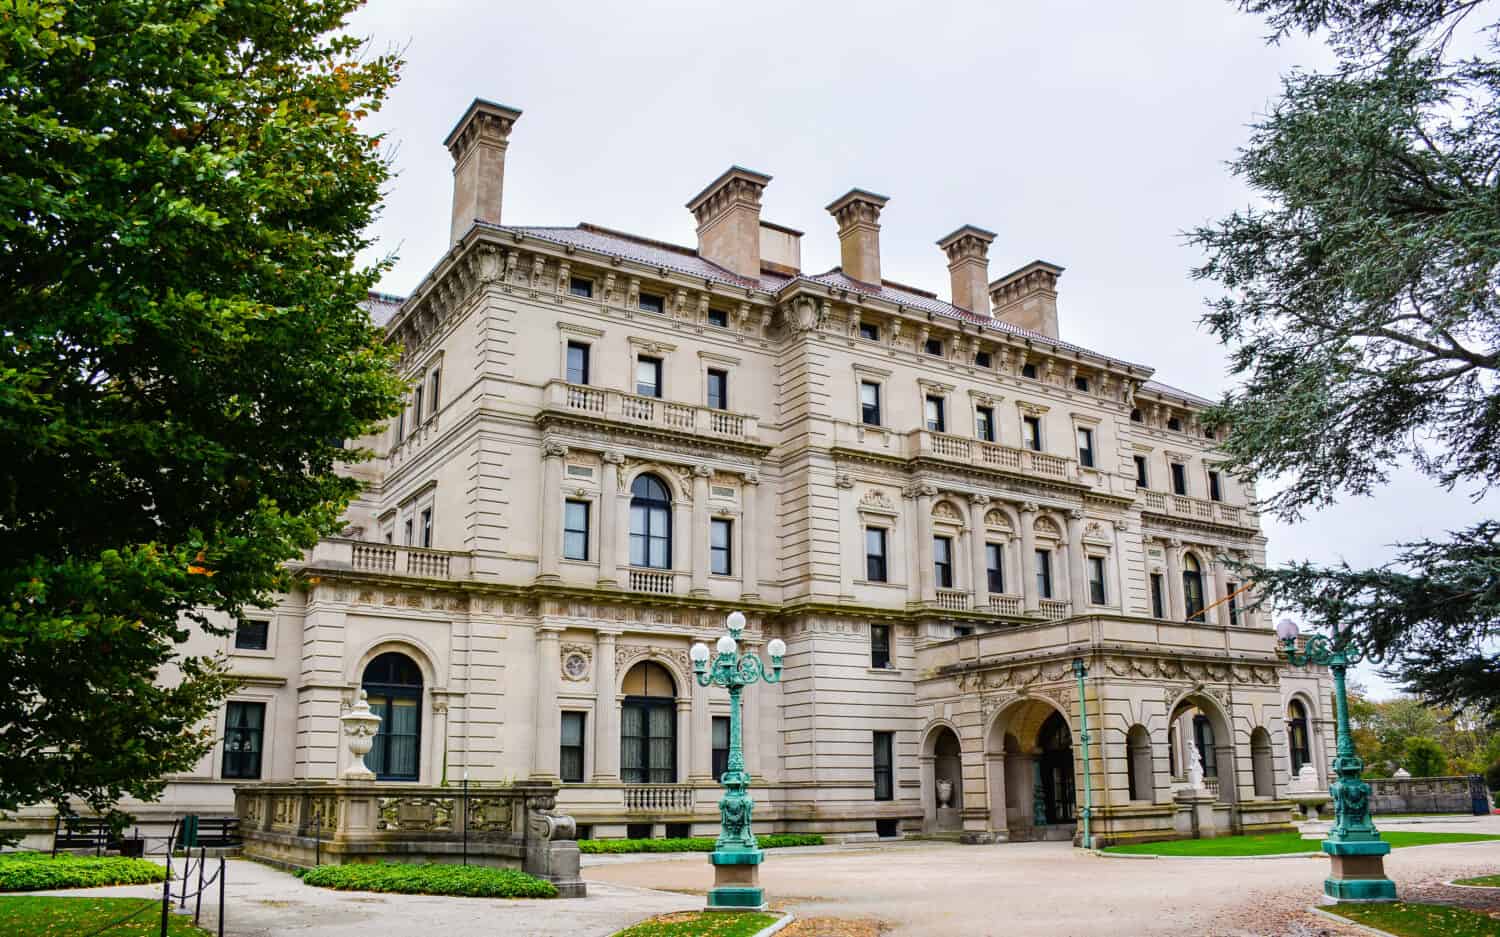
Rhode Island
Source: jejim / Shutterstock.com
Source: jejim / Shutterstock.com
The Breakers, a Vanderbilt family “summer cottage” — one of the famous mansions of Newport.
Price difference from national average: 6.63%
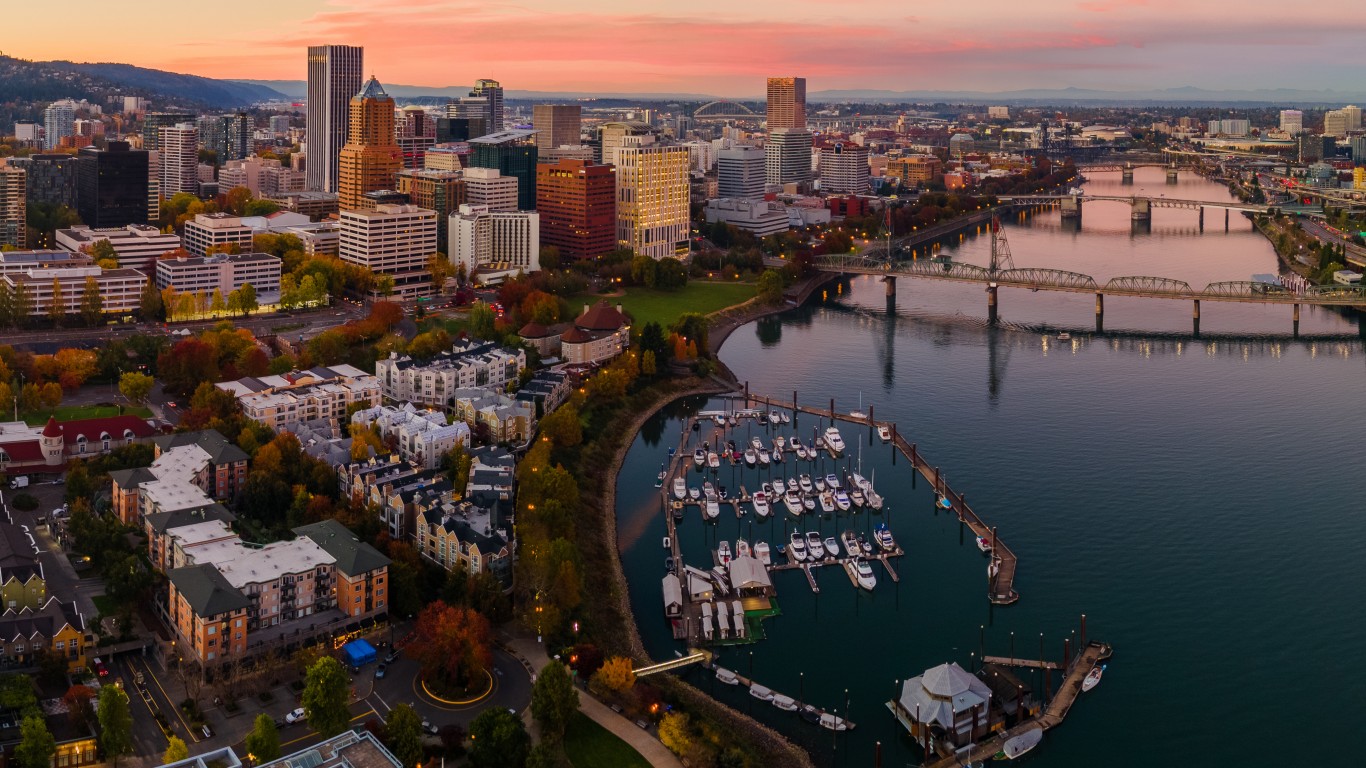
Oregon
Source: jbentley09 / iStock via Getty Images
Source: jbentley09 / iStock via Getty Images
Downtown Portland at sunset.
Price difference from national average: 6.85%
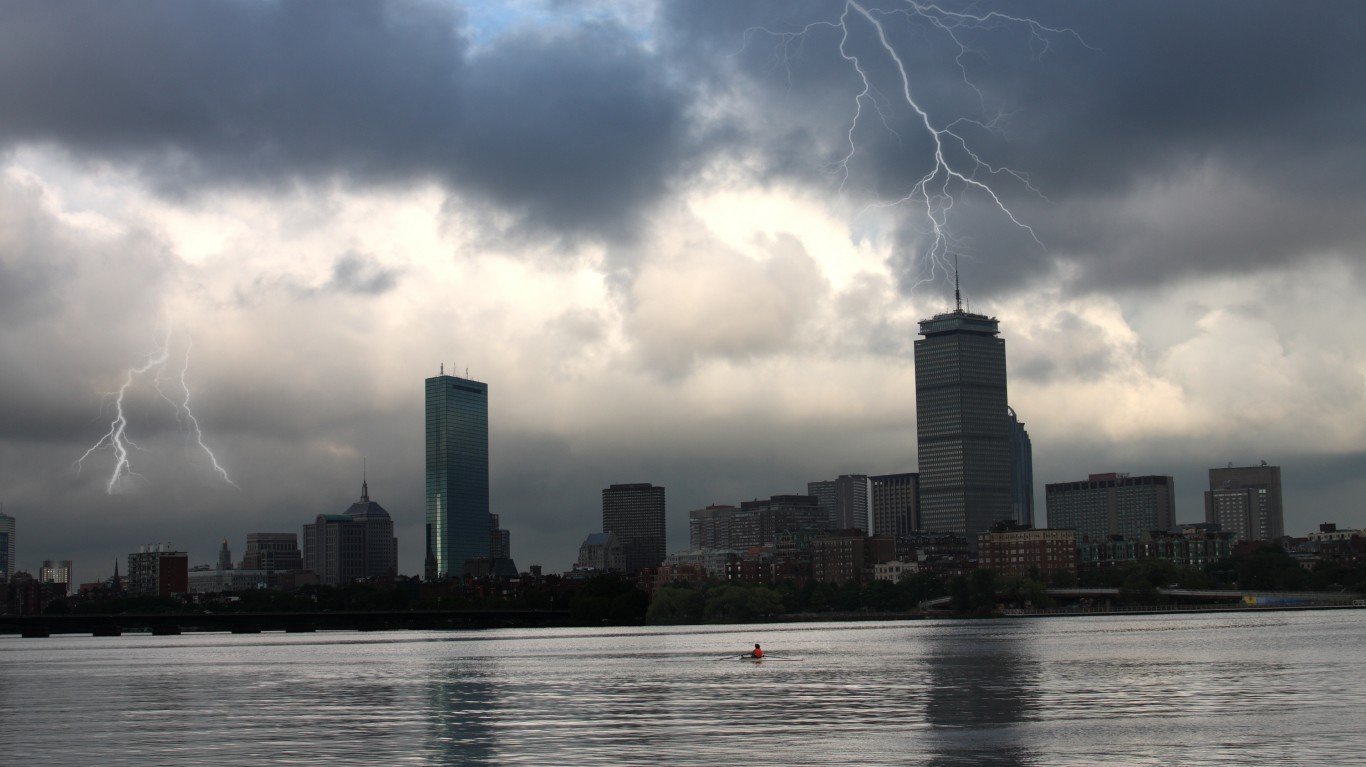
Massachusetts
Source: DenisTangneyJr / E+ via Getty Images
Source: DenisTangneyJr / E+ via Getty Images
A lightning storm over Boston.
Price difference from national average: 7.20%
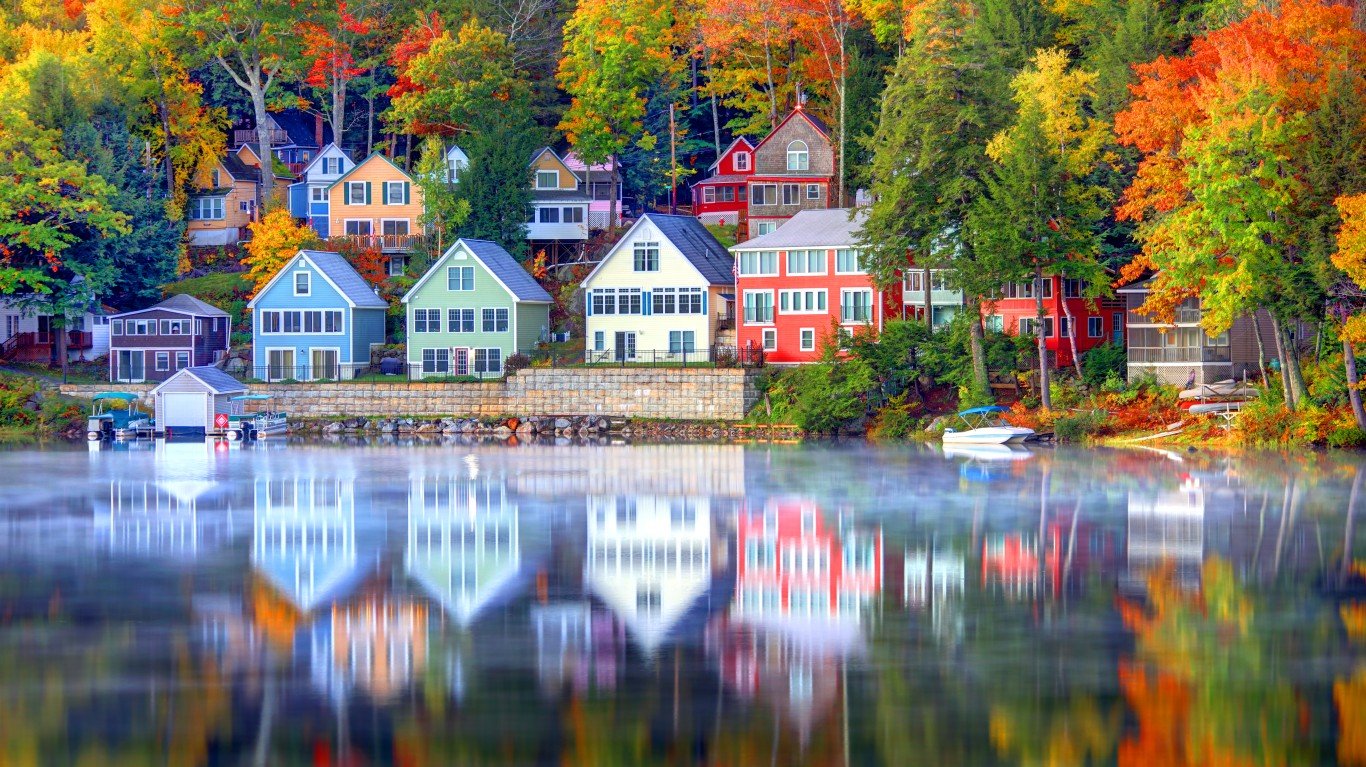
New Hampshire
Source: DenisTangneyJr / E+ via Getty Images
Source: DenisTangneyJr / E+ via Getty Images
Houses along Lake Winnipesaukee, New Hampshire’s largest inland body of water.
Price difference from national average: 7.60%
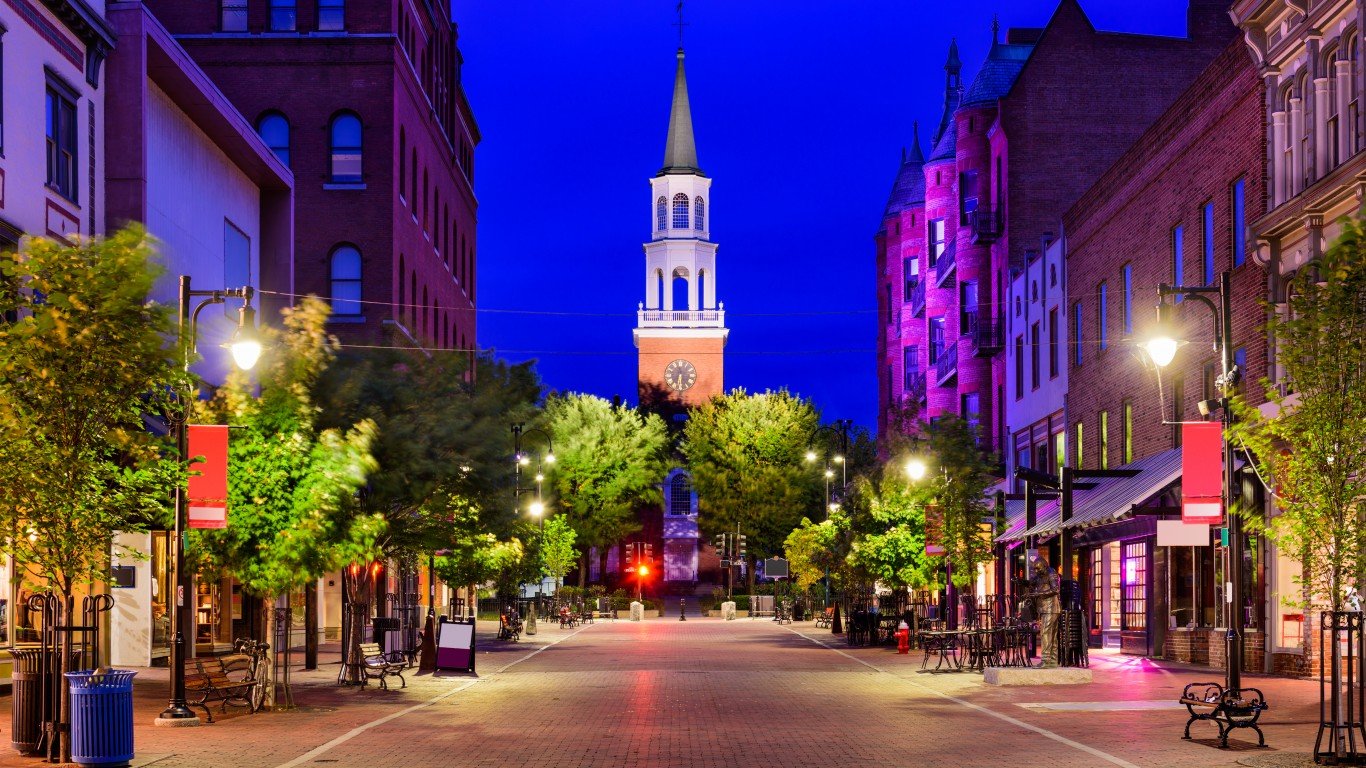
Vermont
Source: SeanPavonePhoto / iStock via Getty Images
Source: SeanPavonePhoto / iStock via Getty Images
Church Street Marketplace in Burlington.
Price difference from national average: 7.89%
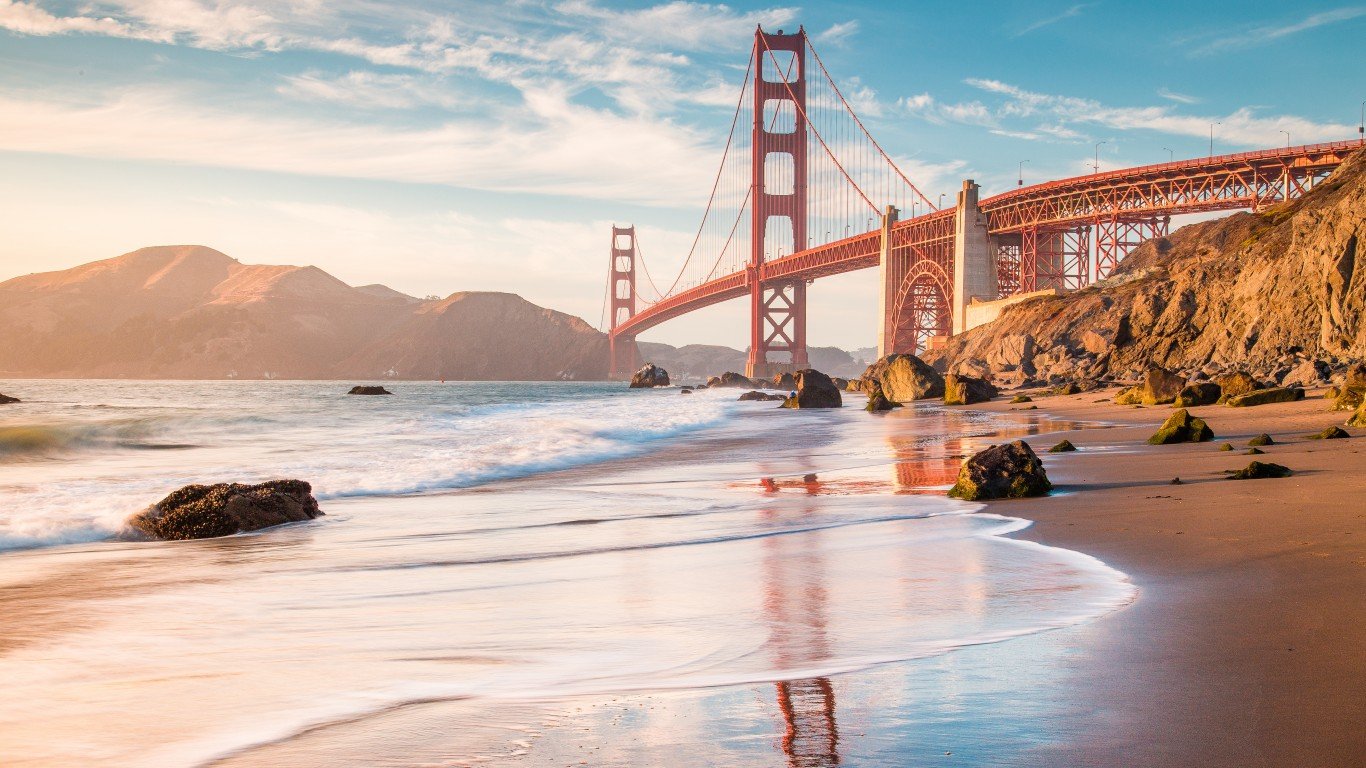
California
Source: bluejayphoto / iStock via Getty Images
Source: bluejayphoto / iStock via Getty Images
The Golden Gate Bridge seen from San Francisco’s Baker Beach.
Price difference from national average: 11.75%
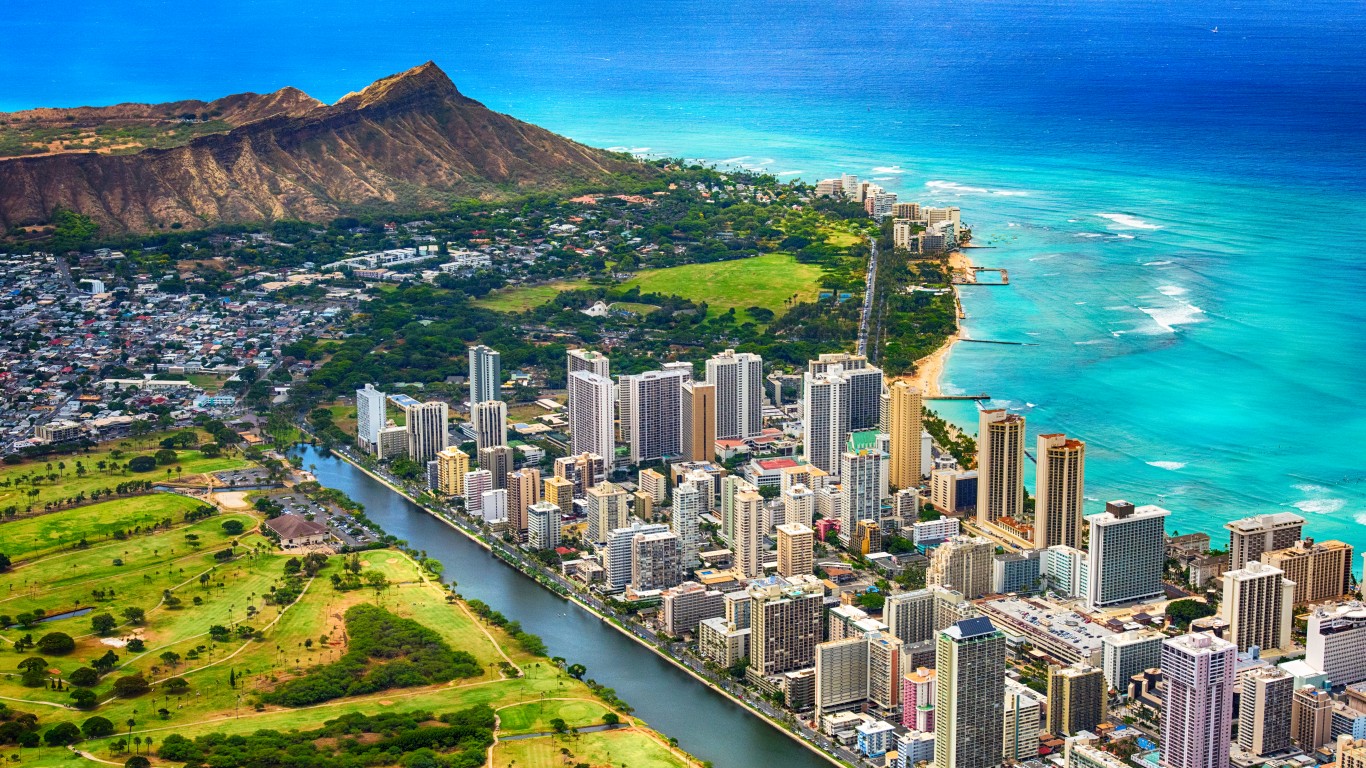
Hawaii
Source: Art Wager / E+ via Getty Images
Source: Art Wager / E+ via Getty Images
Waikiki, on the island of Oahu, with Diamond Head in the background.
Price difference from national average: 11.98%
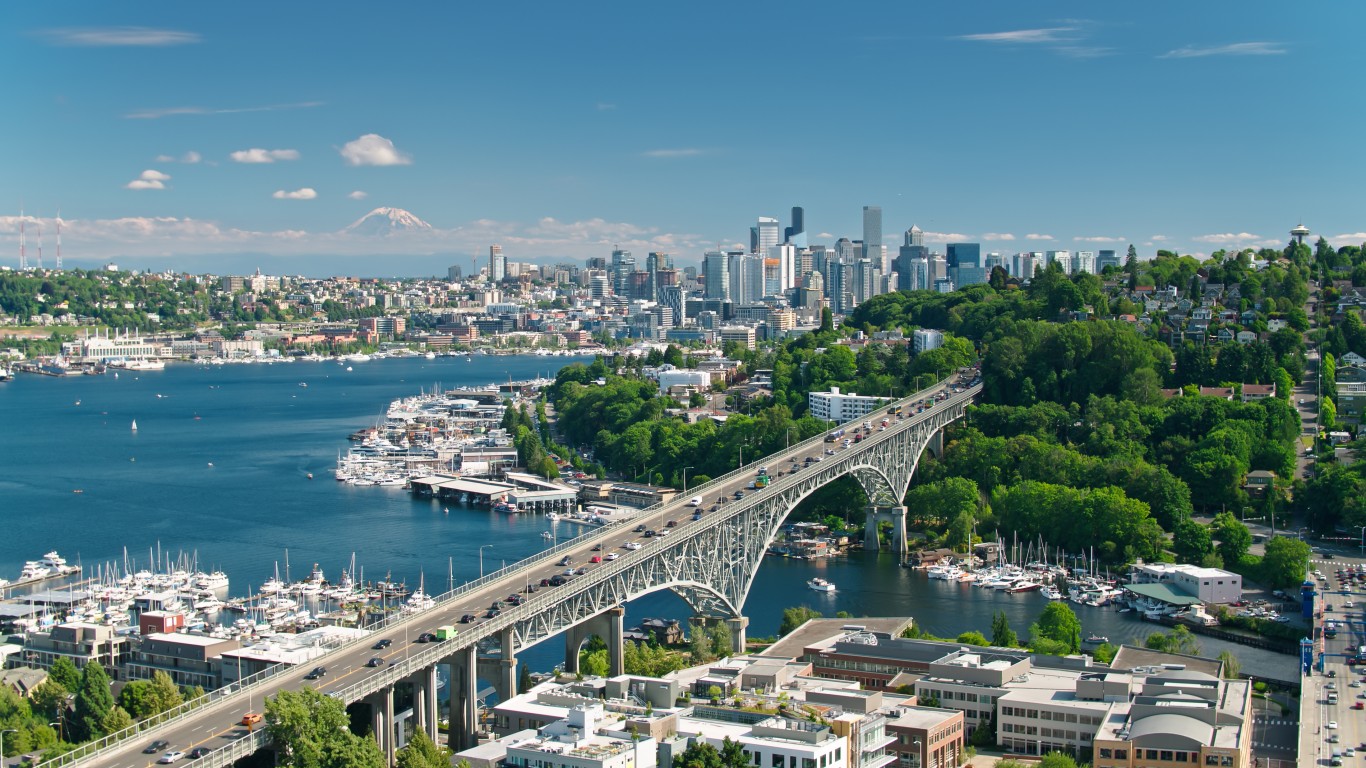
Washington
Source: halbergman / E+ via Getty Images
Source: halbergman / E+ via Getty Images
A view of Seattle and the Aurora Bridge from the Fremont bank of Lake Union.
Price difference from national average: 12.91%
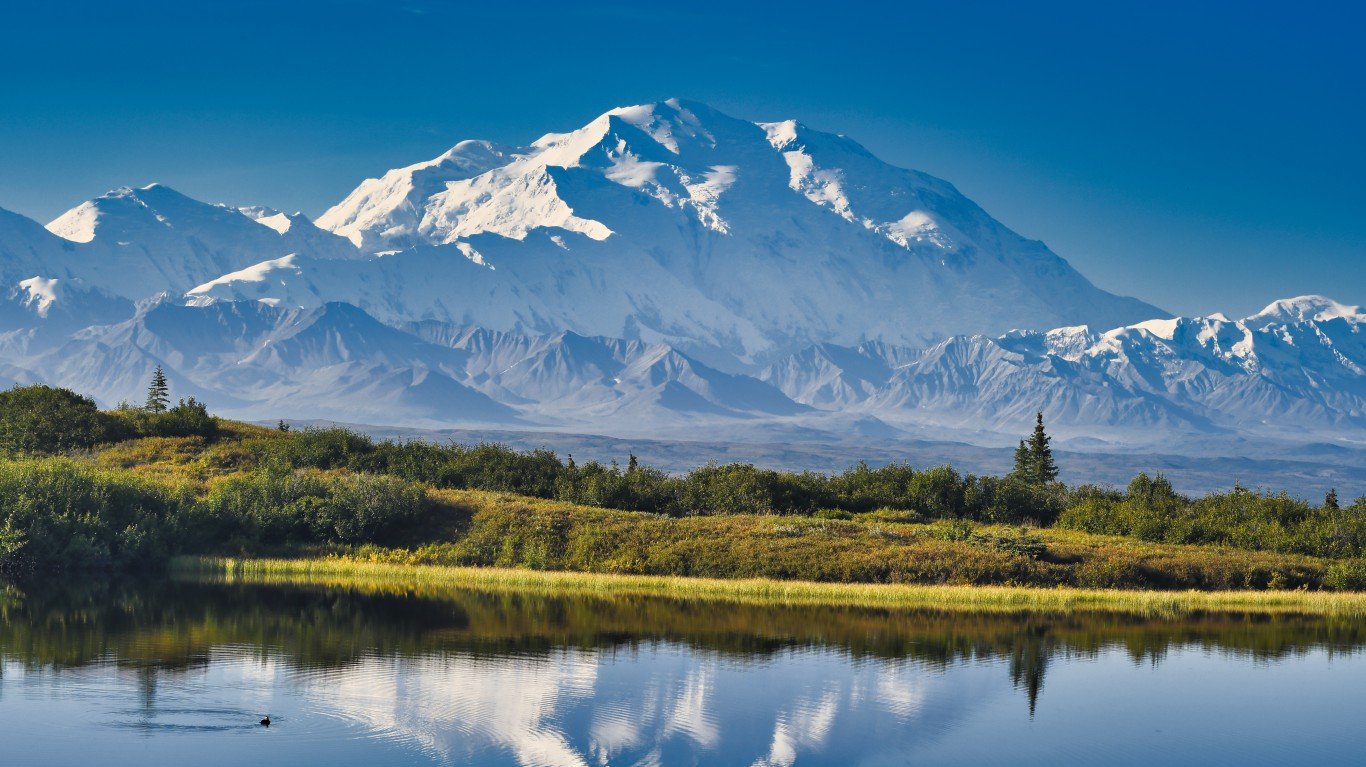
Alaska
Source: Drew Green / iStock via Getty Images
Source: Drew Green / iStock via Getty Images
Denali (formerly Mount McKinley), the highest mountain in America, at 20,310 feet.