The epidemic of drug addiction in the United States is crippling the nation, with opioids such as fentanyl killing thousands of Americans every year. In 2021, more than 100,000 Americans died from drug overdoses, according to data from the Centers for Disease Control and Prevention. America’s largest metropolitan areas are bearing the brunt of the scourge.
To determine the cities or metropolitan areas with the most drug overdoses, 24/7 Tempo reviewed mortality data from the 2023 County Health Rankings & Roadmaps, a Robert Wood Johnson Foundation and University of Wisconsin Population Health Institute joint program. Metropolitan statistical areas were ranked based on annual drug overdose deaths per capita over the period 2018-2020. Data on poverty rate also came from the CHR.
Since 1999, more than 1 million Americans have died from a drug overdose. More than 75% of drug overdose deaths in 2021 involved an opioid. Opioids are substances that are used to reduce the intensity of pain. They were originally prescribed to treat those recovering from surgery and for cancer patients.
The number of overdose deaths involving opioids — prescription opioids, heroin, and synthetic opioids such as fentanyl — in 2021 was 10 times the number in 1999. Virtually all of the synthetic opioids are made in China, India, and Mexico.
Two of the nation’s largest metropolitan areas — Philadelphia and New York City — have the worst problem, with drug overdose death totals including the neighboring states of New Jersey and Delaware. Metro areas in Tennessee, Virginia, and Massachusetts with many overdose deaths include other states as well.
Florida and California each have five metro areas on this list that are entirely within their respective states’ borders.
There was little correlation between poverty level and drug overdose deaths. The official poverty rate in the United States in 2022 was 11.5%, according to the Census, with 37.9 million people living in poverty. Twenty-eight metro areas on the list have poverty rates below the national level.
Communities across the country are tapping into their share of the $50 billion legal settlement with drugmakers, pharmacies, and wholesalers to develop programs to treat those addicted to opioids and other narcotics. (Click here for the states with the most overdose deaths.)
Here is a list of the 50 US cities with the most overdose deaths:
50. Rochester, New York

- Annual drug deaths: 915 per 100,000 residents
- Population: 1,081,152 — #52 out of 384 metros
- Poverty rate: 13.10% — #187 out of 384 metros
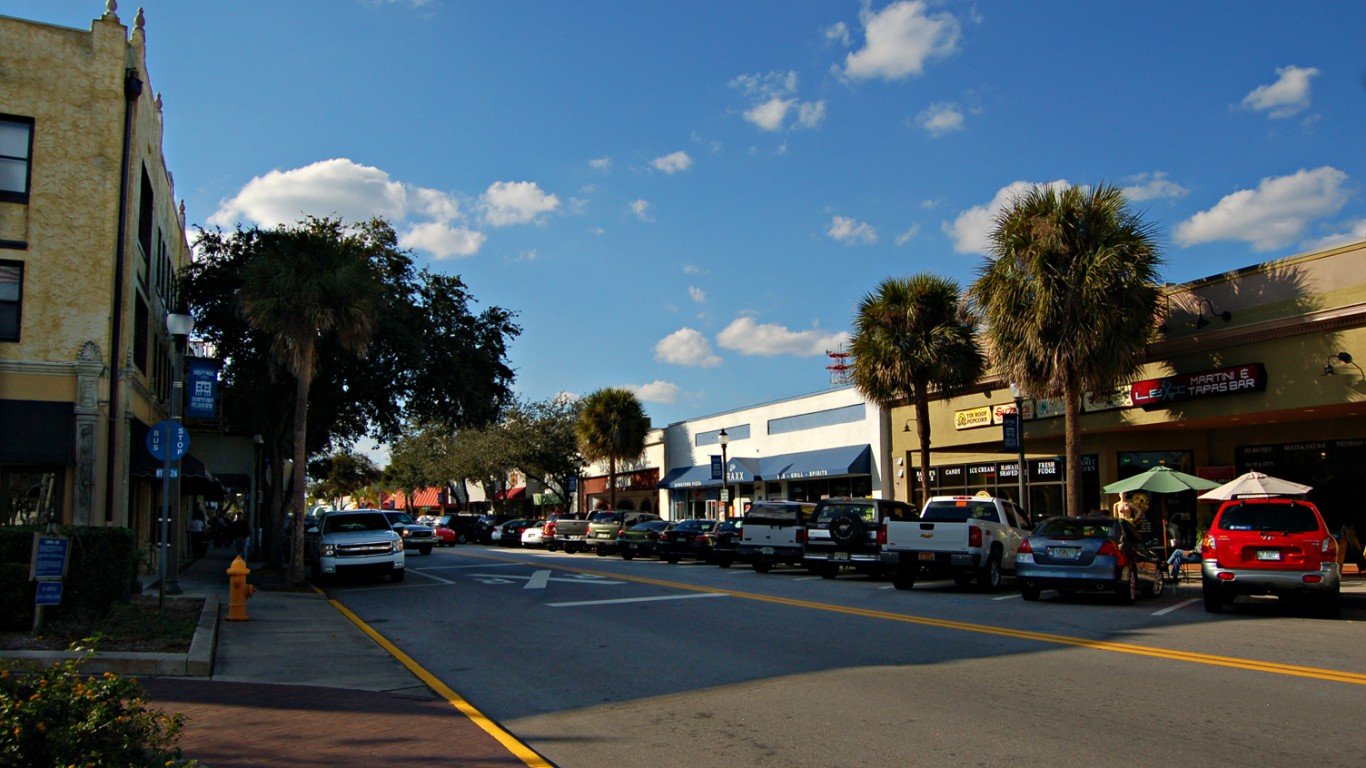
49. Palm Bay-Melbourne-Titusville, Florida
- Annual drug deaths: 926 per 100,000 residents
- Population: 630,693 — #95 out of 384 metros
- Poverty rate: 9.70% — #328 out of 384 metros
48. Tucson, Arizona

- Annual drug deaths: 977 per 100,000 residents
- Population: 1,057,597 — #53 out of 384 metros
- Poverty rate: 14.40% — #143 out of 384 metros
47. Albuquerque, New Mexico
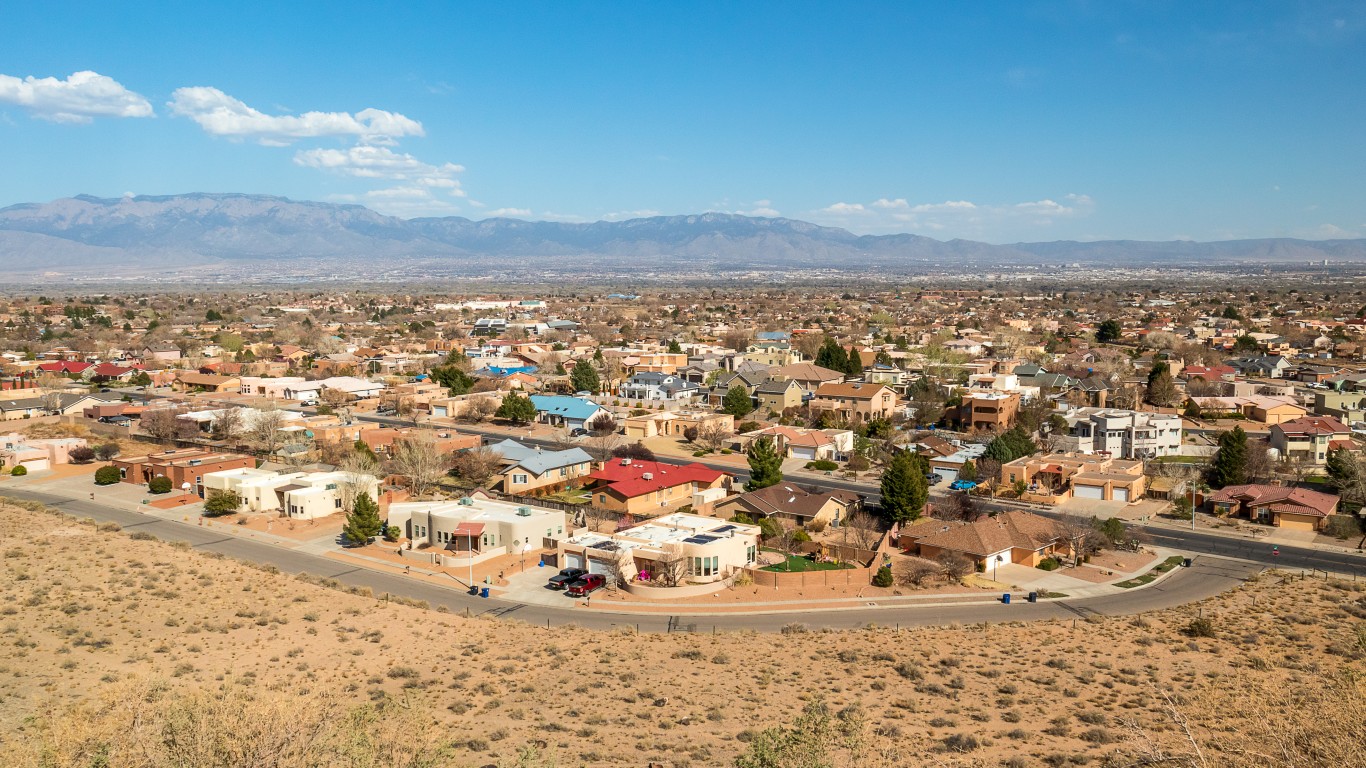
- Annual drug deaths: 999 per 100,000 residents
- Population: 923,925 — #61 out of 384 metros
- Poverty rate: 14.10% — #156 out of 384 metros
46. New Haven-Milford, Connecticut
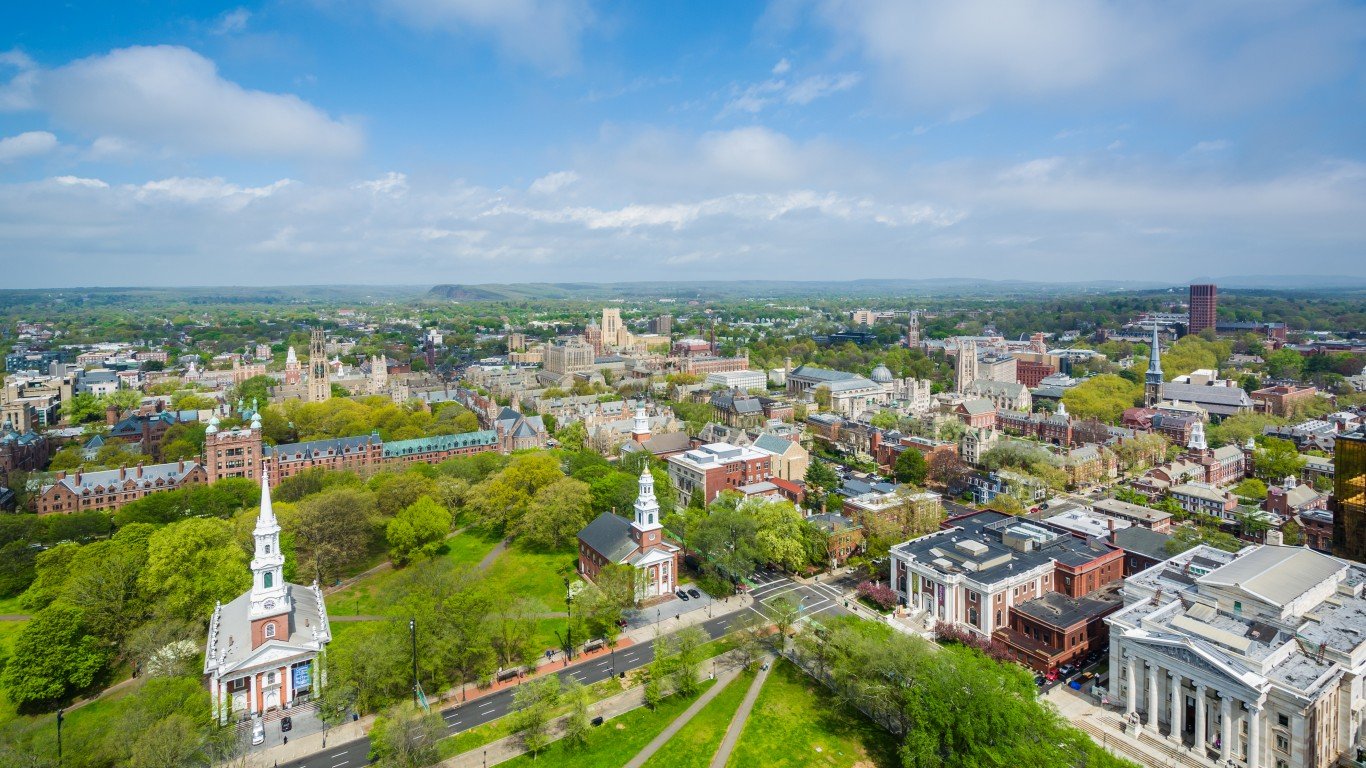
- Annual drug deaths: 1,009 per 100,000 residents
- Population: 870,163 — #70 out of 384 metros
- Poverty rate: 10.50% — #303 out of 384 metros
45. Kansas City, Missouri-Kansas

- Annual drug deaths: 1,031 per 100,000 residents
- Population: 2,209,152 — #31 out of 384 metros
- Poverty rate: 10.70% — #299 out of 384 metros
44. Worcester, Massachusetts-Connecticut

- Annual drug deaths: 1,055 per 100,000 residents
- Population: 980,836 — #57 out of 384 metros
- Poverty rate: 10.70% — #297 out of 384 metros
43. Dayton-Kettering, Ohio

- Annual drug deaths: 1,105 per 100,000 residents
- Population: 812,595 — #76 out of 384 metros
- Poverty rate: 12.60% — #212 out of 384 metros
42. Virginia Beach-Norfolk-Newport News, Virginia-North Carolina

- Annual drug deaths: 1,115 per 100,000 residents
- Population: 1,808,102 — #37 out of 384 metros
- Poverty rate: 11.80% — #246 out of 384 metros
41. Memphis, Tennessee-Mississippi-Arkansas

- Annual drug deaths: 1,145 per 100,000 residents
- Population: 1,330,954 — #44 out of 384 metros
- Poverty rate: 15.70% — #104 out of 384 metros
40. Richmond, Virginia

- Annual drug deaths: 1,153 per 100,000 residents
- Population: 1,341,227 — #43 out of 384 metros
- Poverty rate: 10.70% — #298 out of 384 metros
39. Portland-Vancouver-Hillsboro, Oregon-Washington

- Annual drug deaths: 1,210 per 100,000 residents
- Population: 2,509,140 — #25 out of 384 metros
- Poverty rate: 9.50% — #332 out of 384 metros
38. Sacramento-Roseville-Folsom, California

- Annual drug deaths: 1,218 per 100,000 residents
- Population: 2,416,702 — #27 out of 384 metros
- Poverty rate: 11.20% — #267 out of 384 metros
37. Knoxville, Tennessee

- Annual drug deaths: 1,318 per 100,000 residents
- Population: 906,674 — #63 out of 384 metros
- Poverty rate: 11.80% — #247 out of 384 metros
36. Hartford-East Hartford-Middletown, Connecticut

- Annual drug deaths: 1,323 per 100,000 residents
- Population: 1,221,303 — #48 out of 384 metros
- Poverty rate: 10.10% — #317 out of 384 metros
35. Las Vegas-Henderson-Paradise, Nevada

- Annual drug deaths: 1,541 per 100,000 residents
- Population: 2,322,985 — #29 out of 384 metros
- Poverty rate: 13.10% — #190 out of 384 metros
34. Milwaukee-Waukesha, Wisconsin

- Annual drug deaths: 1,601 per 100,000 residents
- Population: 1,559,792 — #40 out of 384 metros
- Poverty rate: 12.40% — #222 out of 384 metros
33. Jacksonville, Florida

- Annual drug deaths: 1,621 per 100,000 residents
- Population: 1,675,668 — #38 out of 384 metros
- Poverty rate: 11.00% — #275 out of 384 metros
32. Louisville/Jefferson County, Kentucky-Indiana

- Annual drug deaths: 1,674 per 100,000 residents
- Population: 1,285,426 — #45 out of 384 metros
- Poverty rate: 12.10% — #234 out of 384 metros
31. Orlando-Kissimmee-Sanford, Florida

- Annual drug deaths: 1,703 per 100,000 residents
- Population: 2,764,182 — #22 out of 384 metros
- Poverty rate: 12.00% — #239 out of 384 metros
30. New Orleans-Metairie, Louisiana

- Annual drug deaths: 1,707 per 100,000 residents
- Population: 1,246,176 — #47 out of 384 metros
- Poverty rate: 15.70% — #102 out of 384 metros
29. Minneapolis-St. Paul-Bloomington, Minnesota-Wisconsin

- Annual drug deaths: 1,714 per 100,000 residents
- Population: 3,693,729 — #16 out of 384 metros
- Poverty rate: 8.80% — #356 out of 384 metros
28. Charlotte-Concord-Gastonia, North Carolina-South Carolina

- Annual drug deaths: 1,714 per 100,000 residents
- Population: 2,756,069 — #23 out of 384 metros
- Poverty rate: 9.80% — #327 out of 384 metros
27. San Diego-Chula Vista-Carlsbad, California
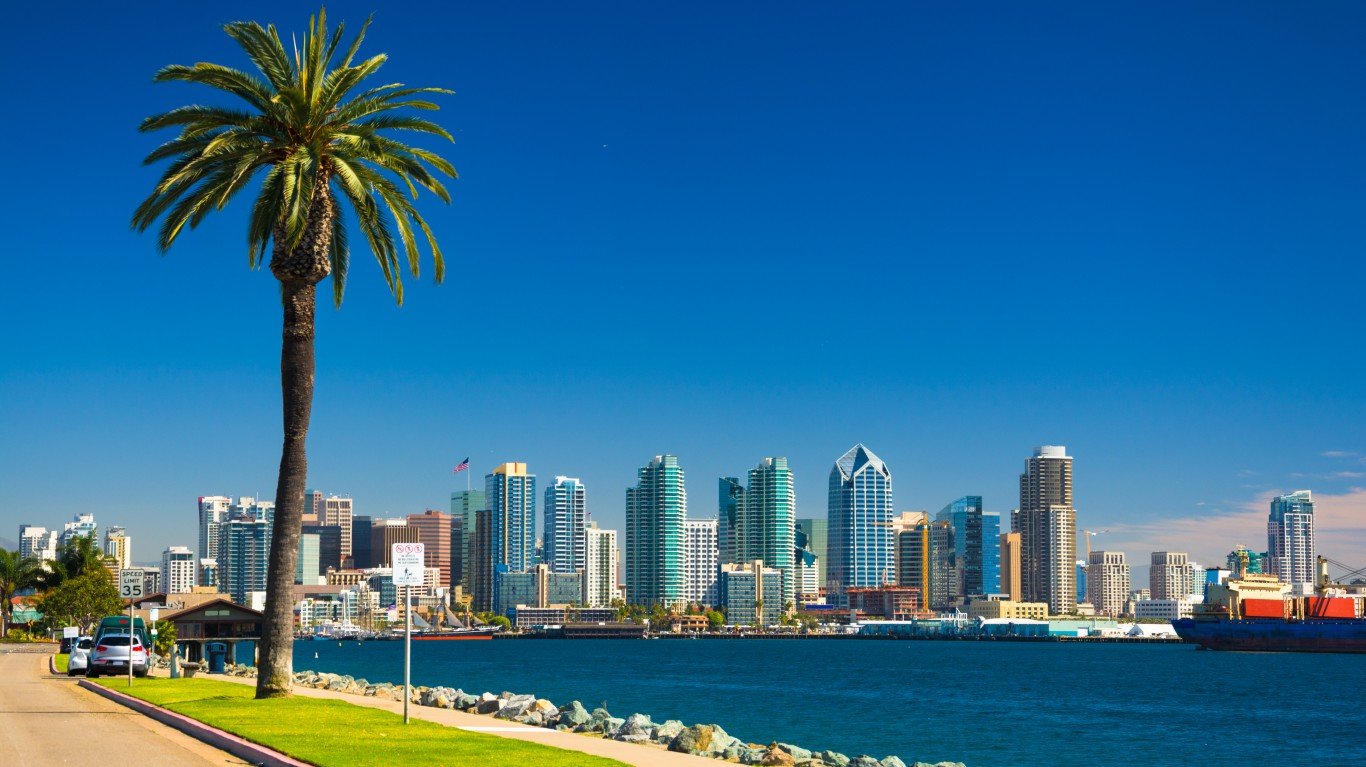
- Annual drug deaths: 1,724 per 100,000 residents
- Population: 3,276,208 — #18 out of 384 metros
- Poverty rate: 10.60% — #300 out of 384 metros
26. Providence-Warwick, Rhode Island-Massachusetts

- Annual drug deaths: 1,792 per 100,000 residents
- Population: 1,673,802 — #39 out of 384 metros
- Poverty rate: 11.00% — #272 out of 384 metros
25. Denver-Aurora-Lakewood, Colorado

- Annual drug deaths: 1,804 per 100,000 residents
- Population: 2,985,871 — #19 out of 384 metros
- Poverty rate: 8.30% — #364 out of 384 metros
24. Indianapolis-Carmel-Anderson, Indiana

- Annual drug deaths: 2,049 per 100,000 residents
- Population: 2,142,193 — #33 out of 384 metros
- Poverty rate: 10.80% — #292 out of 384 metros
23. Nashville-Davidson–Murfreesboro–Franklin, Tennessee

- Annual drug deaths: 2,167 per 100,000 residents
- Population: 2,046,715 — #35 out of 384 metros
- Poverty rate: 9.80% — #323 out of 384 metros
22. Cleveland-Elyria, Ohio

- Annual drug deaths: 2,229 per 100,000 residents
- Population: 2,063,132 — #34 out of 384 metros
- Poverty rate: 13.70% — #168 out of 384 metros
21. Seattle-Tacoma-Bellevue, Washington

- Annual drug deaths: 2,407 per 100,000 residents
- Population: 4,034,248 — #15 out of 384 metros
- Poverty rate: 8.60% — #360 out of 384 metros
20. Columbus, Ohio

- Annual drug deaths: 2,504 per 100,000 residents
- Population: 2,161,511 — #32 out of 384 metros
- Poverty rate: 12.40% — #221 out of 384 metros
19. Dallas-Fort Worth-Arlington, Texas
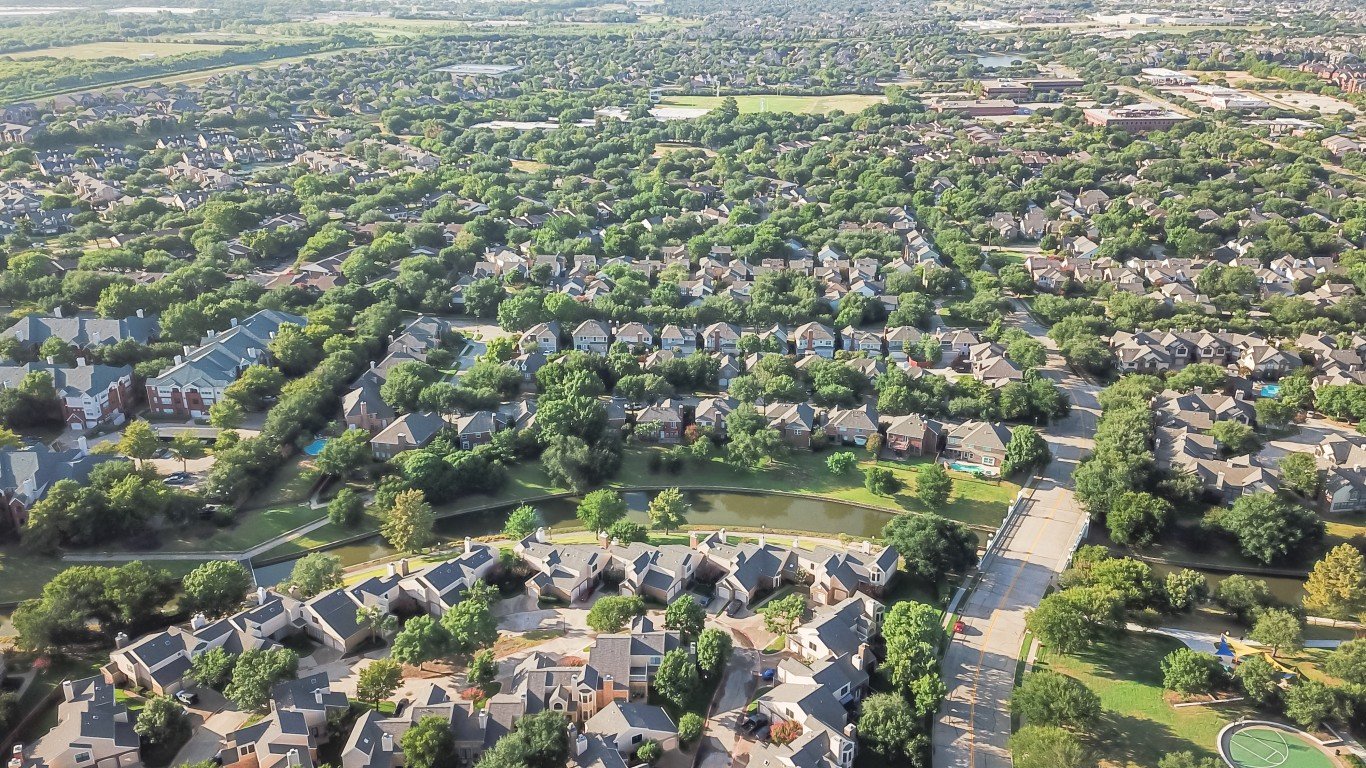
- Annual drug deaths: 2,550 per 100,000 residents
- Population: 7,943,685 — #4 out of 384 metros
- Poverty rate: 10.30% — #310 out of 384 metros
18. Riverside-San Bernardino-Ontario, California
- Annual drug deaths: 2,643 per 100,000 residents
- Population: 4,667,558 — #12 out of 384 metros
- Poverty rate: 12.00% — #242 out of 384 metros
17. Atlanta-Sandy Springs-Alpharetta, Georgia

- Annual drug deaths: 2,648 per 100,000 residents
- Population: 6,222,908 — #8 out of 384 metros
- Poverty rate: 10.00% — #319 out of 384 metros
16. Cincinnati, Ohio-Kentucky-Indiana

- Annual drug deaths: 2,872 per 100,000 residents
- Population: 2,268,393 — #30 out of 384 metros
- Poverty rate: 11.80% — #248 out of 384 metros
15. Pittsburgh, Pennsylvania
- Annual drug deaths: 2,886 per 100,000 residents
- Population: 2,349,172 — #28 out of 384 metros
- Poverty rate: 11.20% — #265 out of 384 metros
14. San Francisco-Oakland-Berkeley, California

- Annual drug deaths: 2,925 per 100,000 residents
- Population: 4,579,599 — #13 out of 384 metros
- Poverty rate: 9.20% — #340 out of 384 metros
13. Houston-The Woodlands-Sugar Land, Texas

- Annual drug deaths: 2,940 per 100,000 residents
- Population: 7,340,118 — #5 out of 384 metros
- Poverty rate: 14.30% — #150 out of 384 metros
12. Tampa-St. Petersburg-Clearwater, Florida

- Annual drug deaths: 3,066 per 100,000 residents
- Population: 3,290,730 — #17 out of 384 metros
- Poverty rate: 12.30% — #230 out of 384 metros
11. St. Louis, Missouri-Illinois

- Annual drug deaths: 3,418 per 100,000 residents
- Population: 2,799,828 — #21 out of 384 metros
- Poverty rate: 11.00% — #277 out of 384 metros
10. Washington-Arlington-Alexandria, DC-Virginia-Maryland-West Virginia

- Annual drug deaths: 3,687 per 100,000 residents
- Population: 6,373,829 — #6 out of 384 metros
- Poverty rate: 7.90% — #371 out of 384 metros
9. Miami-Fort Lauderdale-Pompano Beach, Florida

- Annual drug deaths: 4,023 per 100,000 residents
- Population: 6,139,340 — #9 out of 384 metros
- Poverty rate: 13.20% — #182 out of 384 metros
8. Detroit-Warren-Dearborn, Michigan
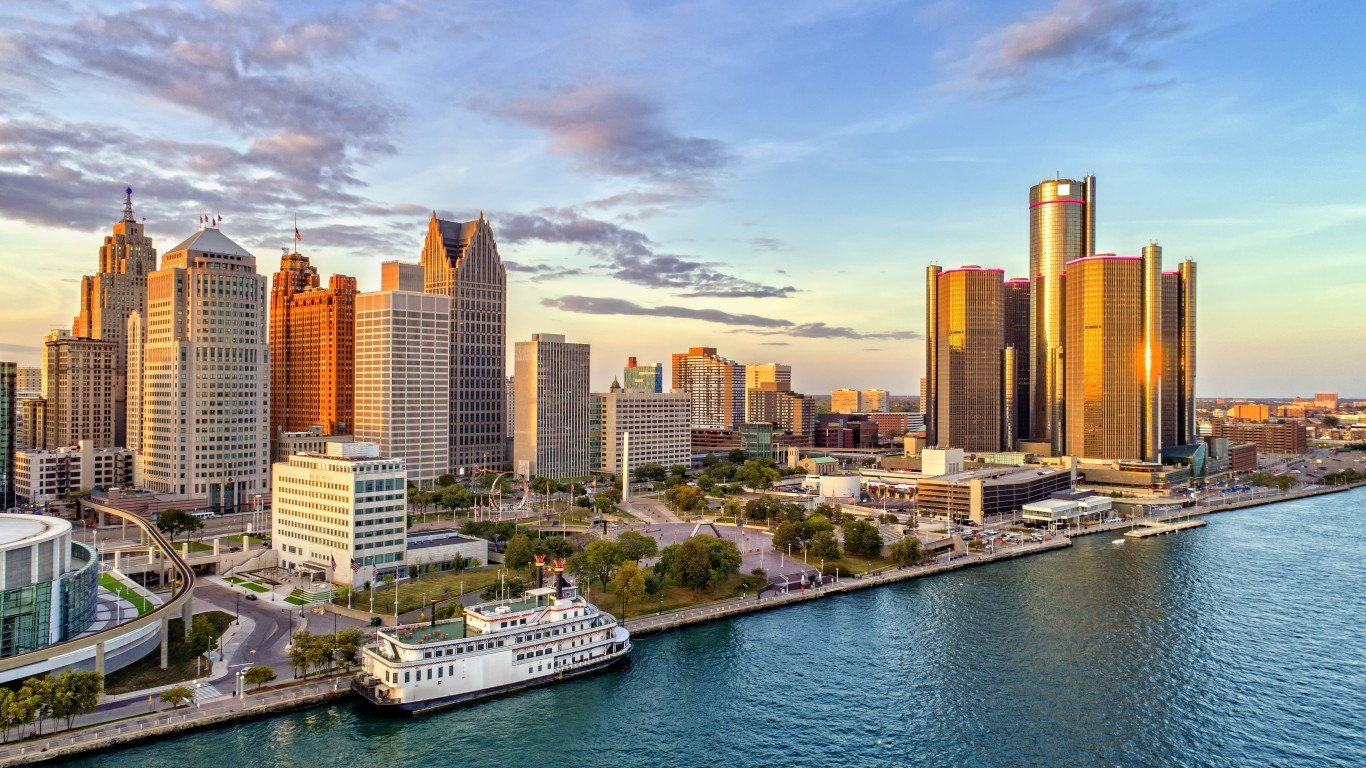
- Annual drug deaths: 4,151 per 100,000 residents
- Population: 4,345,761 — #14 out of 384 metros
- Poverty rate: 13.80% — #164 out of 384 metros
7. Boston-Cambridge-Newton, Massachusetts-New Hampshire

- Annual drug deaths: 4,153 per 100,000 residents
- Population: 4,900,550 — #11 out of 384 metros
- Poverty rate: 9.20% — #343 out of 384 metros
6. Phoenix-Mesa-Chandler, Arizona

- Annual drug deaths: 4,188 per 100,000 residents
- Population: 5,015,678 — #10 out of 384 metros
- Poverty rate: 10.80% — #293 out of 384 metros
5. Baltimore-Columbia-Towson, Maryland

- Annual drug deaths: 4,988 per 100,000 residents
- Population: 2,835,672 — #20 out of 384 metros
- Poverty rate: 10.10% — #313 out of 384 metros
4. Los Angeles-Long Beach-Anaheim, California
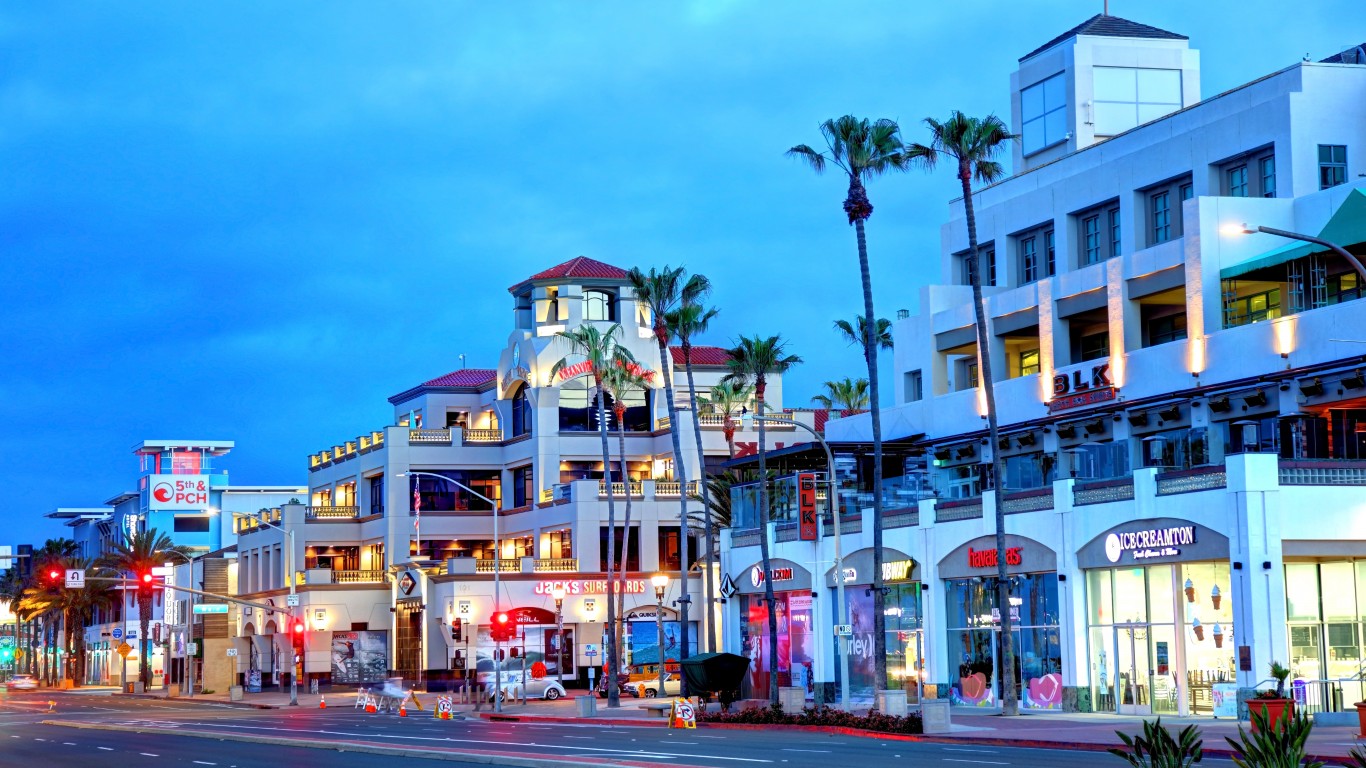
- Annual drug deaths: 5,753 per 100,000 residents
- Population: 12,872,322 — #2 out of 384 metros
- Poverty rate: 12.90% — #196 out of 384 metros
3. Chicago-Naperville-Elgin, Illinois-Indiana-Wisconsin

- Annual drug deaths: 6,935 per 100,000 residents
- Population: 9,442,159 — #3 out of 384 metros
- Poverty rate: 11.20% — #266 out of 384 metros
2. Philadelphia-Camden-Wilmington, Pennsylvania-New Jersey-Delaware-Maryland

- Annual drug deaths: 8,423 per 100,000 residents
- Population: 6,241,164 — #7 out of 384 metros
- Poverty rate: 11.40% — #258 out of 384 metros
1. New York-Newark-Jersey City, New York-New Jersey-Pennsylvania

- Annual drug deaths: 12,568 per 100,000 residents
- Population: 19,617,869 — #1 out of 384 metros
- Poverty rate: 12.80% — #201 out of 384 metros

