
It has been pointed out often that we’re a fast-food nation. Estimates suggest that at least 30% of us, of all ages, eat fast food once a day or more, while 83% of American families indulge in it at least once a week.
The obvious problem with frequent fast-food consumption is that the choices offered on most of the genre’s menus just aren’t very healthy. They tend to be high in calories and salt, and often of only marginal nutritional value. Throw in an oversized soft drink, typically included in fast-food meal packages, and you’re overloading on sugar, too.
One advantage to fast food, it is commonly believed, is that in addition to being, well, fast, it’s inexpensive. But that’s not always true. As with the prices of just about everything else, what you’ll pay for burgers and tacos and chicken sandwiches and the like at what food service professionals prefer to call quick service restaurants can vary widely from state to state and even from city to city. Inhabitants of some metro areas, in fact, pay a premium of 10% or more over national average prices.
To compile a ranking of the American cities where people pay the most for fast food, 24/7 Tempo reviewed a study of takeout food prices by NetCredit, an online loan provider, which computed the average cost of takeout food in some 260 cities across the nation.
The site began by collecting menus from seven of the most popular and widely distributed chains — McDonald’s, Pizza Hut, Subway, Burger King, KFC, Popeyes, and Taco Bell — then chose key items from each one (Taco Bell’s Crunchwrap Supreme, Burger King’s Whopper, etc.) and analyzed data on their prices in different cities from Grubhub. Next, they computed the average national price for the items overall and for each individual chain, then calculated how much prices in each of the cities on their list varied from that average.
The majority of the 50 cities where diners pay the most for fast food are found in one of two regions, on opposite sides of the country: 18 are in New England, while 20 are on the West Coast, including Alaska and Hawaii. In fact, cities in those two states occupy the top three positions on the list, with diners in Anchorage and Honolulu paying a premium of more than 18% on their fast-food purchases, and those in Fairbanks ponying up almost that much more. (These are the 20 fast foods with the most calories.)
Here is a list of the cities where people pay the most (and least) for fast food:
50. Paterson, NJ

- Difference from the nat’l avg a resident should pay for take out: 5.36%
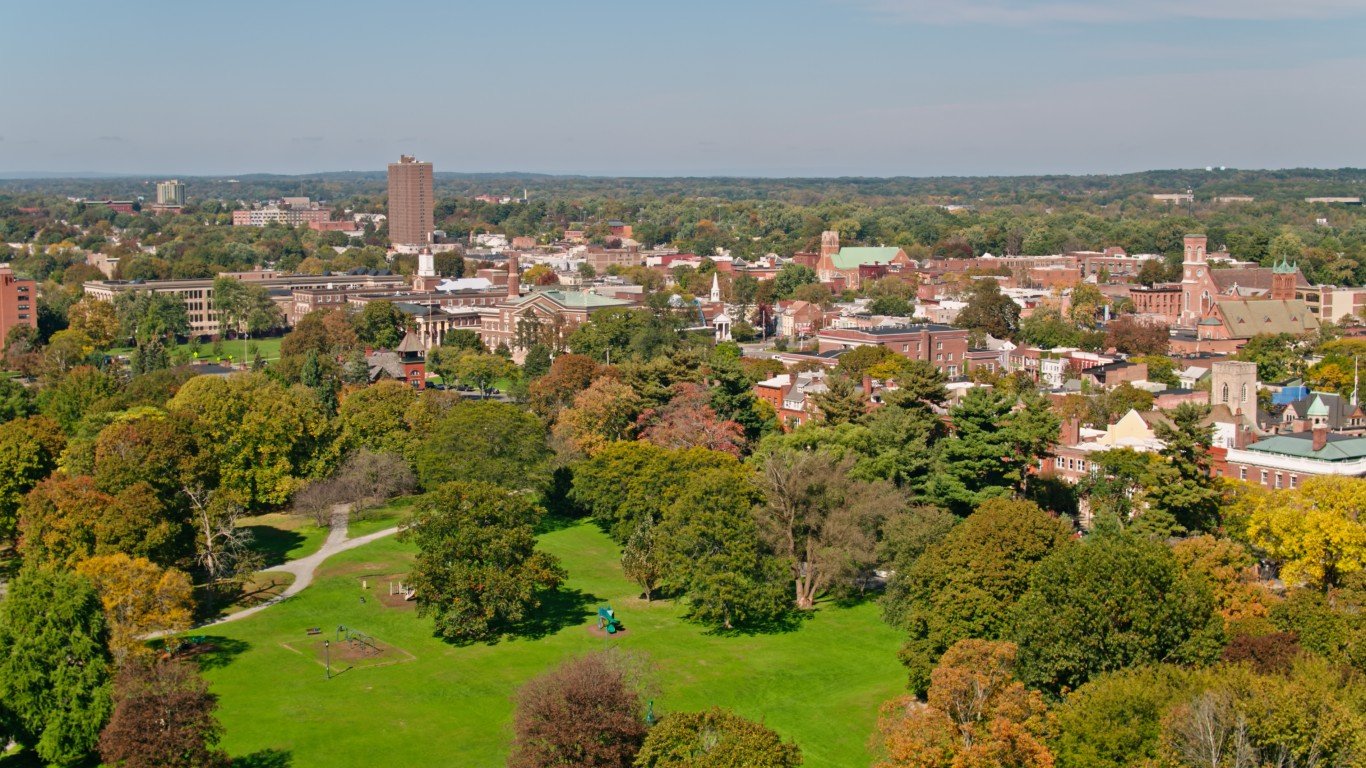
49. Hartford, CT

- Difference from the nat’l avg a resident should pay for take out: 5.41%
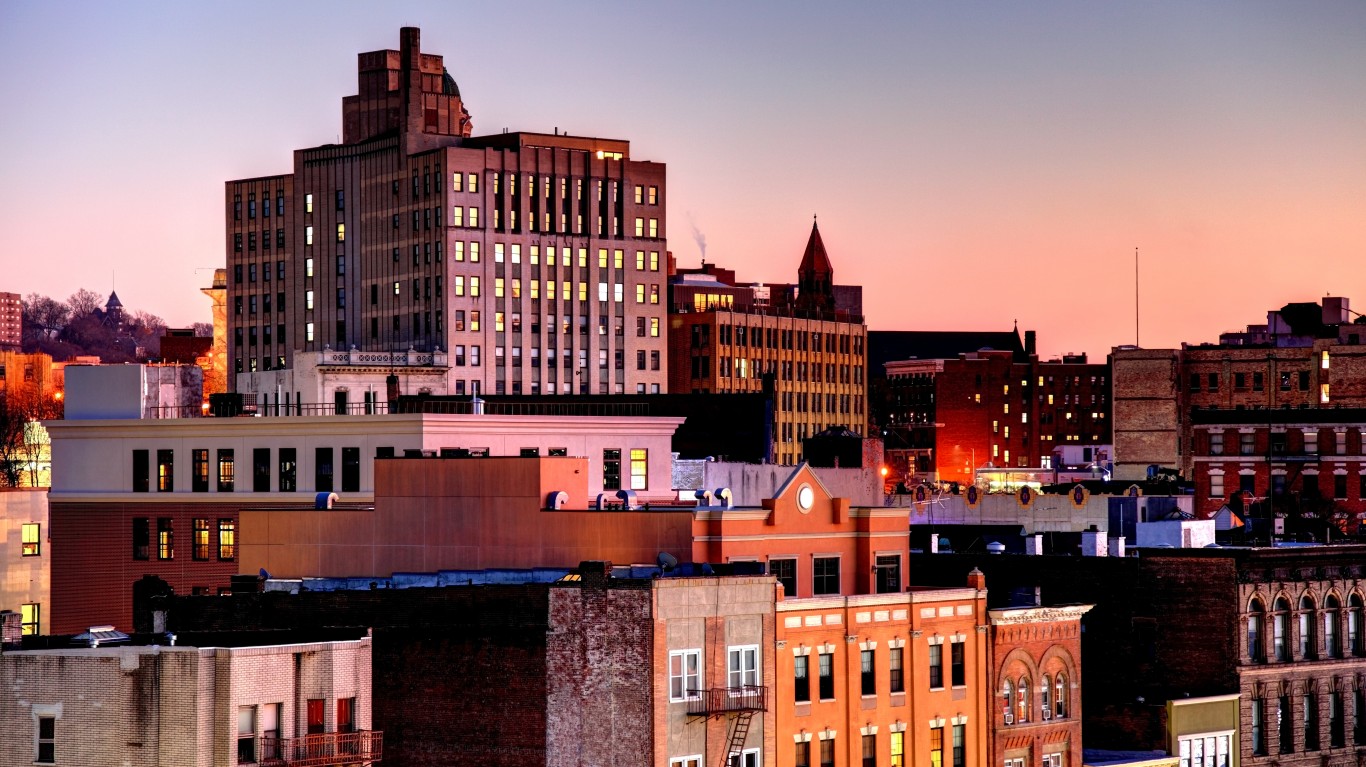
48. Huntington, WV

- Difference from the nat’l avg a resident should pay for take out: 5.42%
47. Hillsboro, OR
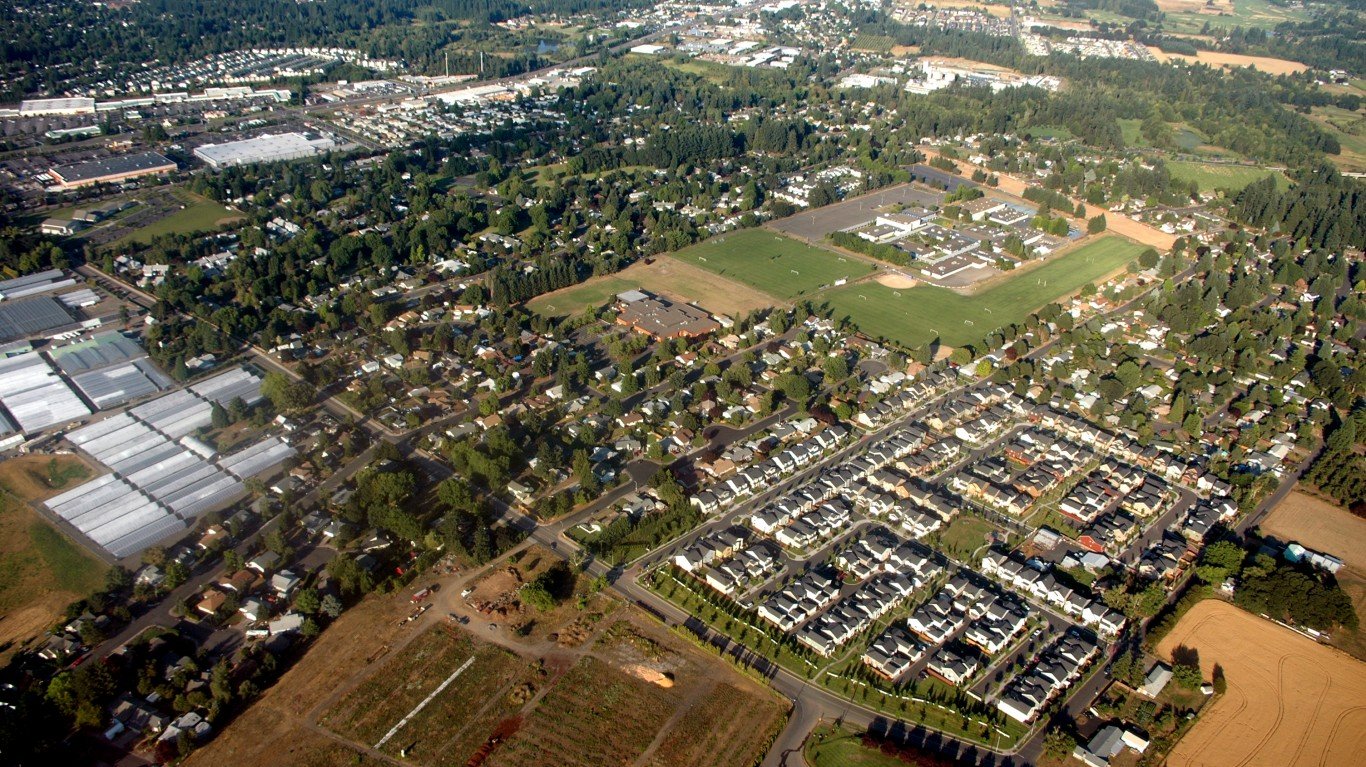
- Difference from the nat’l avg a resident should pay for take out: 5.51%
46. Vancouver, WA

- Difference from the nat’l avg a resident should pay for take out: 5.58%
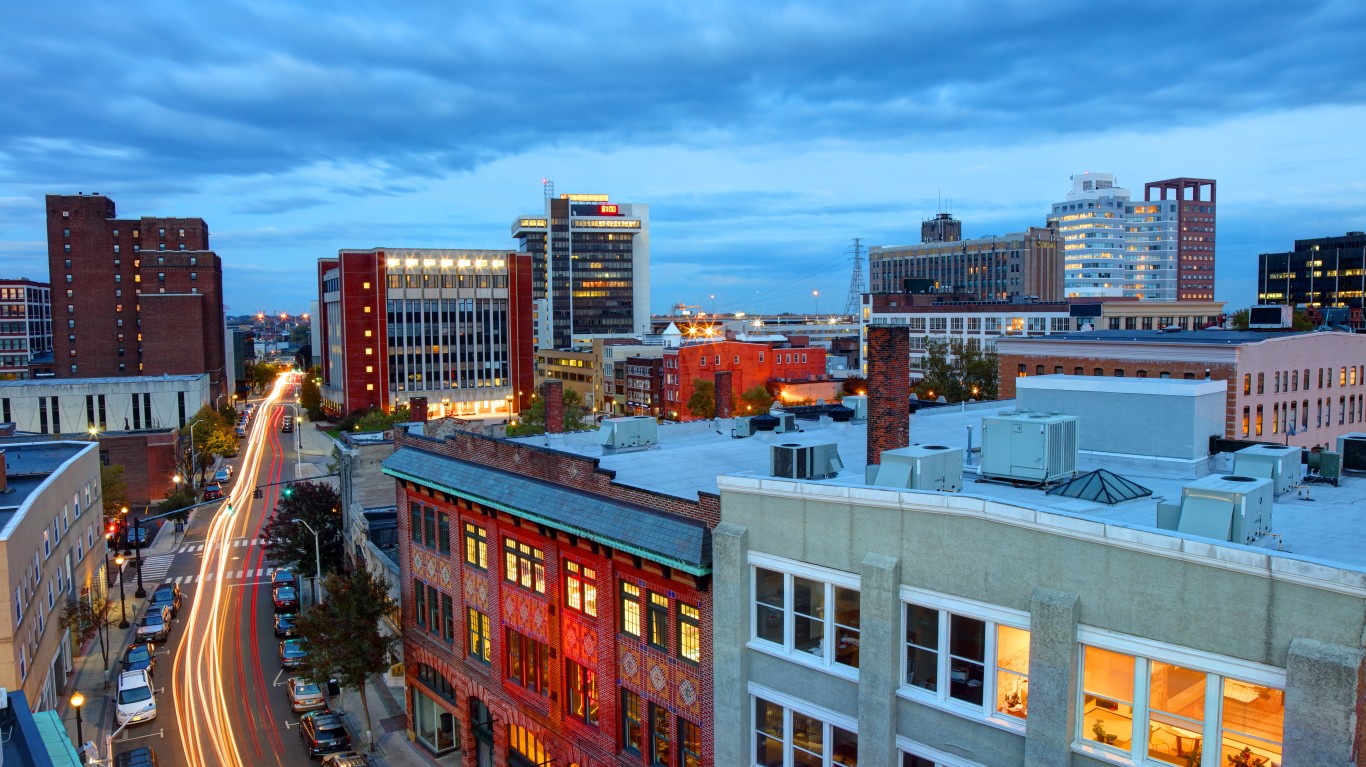
45. Stamford, CT

- Difference from the nat’l avg a resident should pay for take out: 6.23%
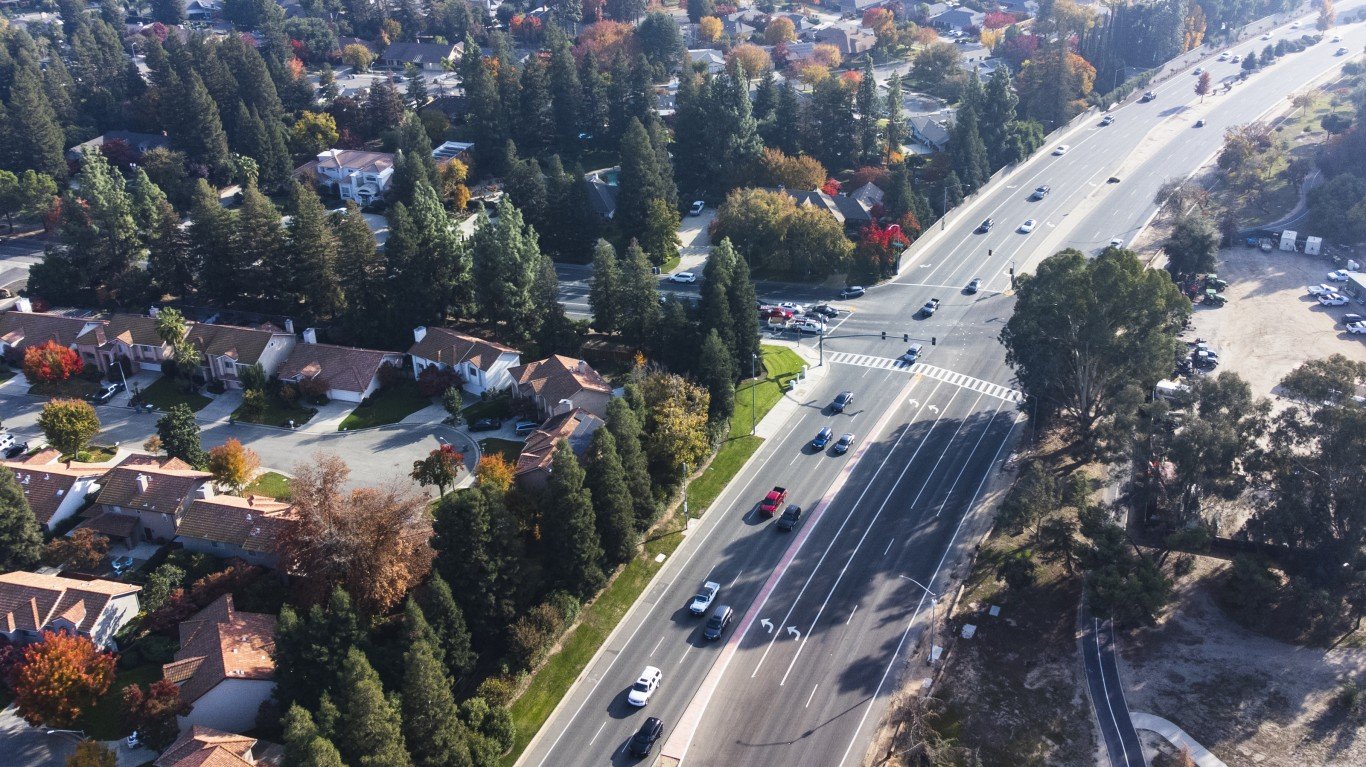
44. San Jose, CA
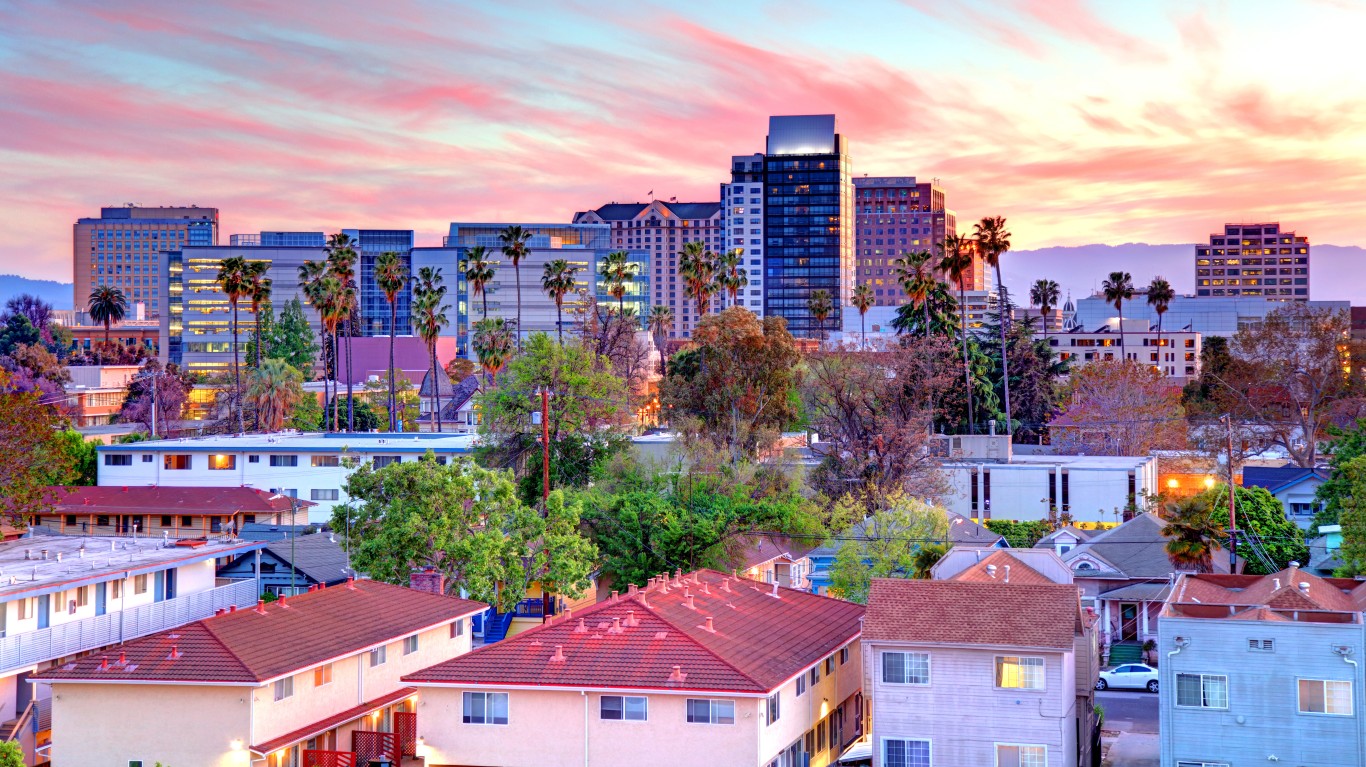
- Difference from the nat’l avg a resident should pay for take out: 6.32%
43. Des Moines, IA

- Difference from the nat’l avg a resident should pay for take out: 6.40%
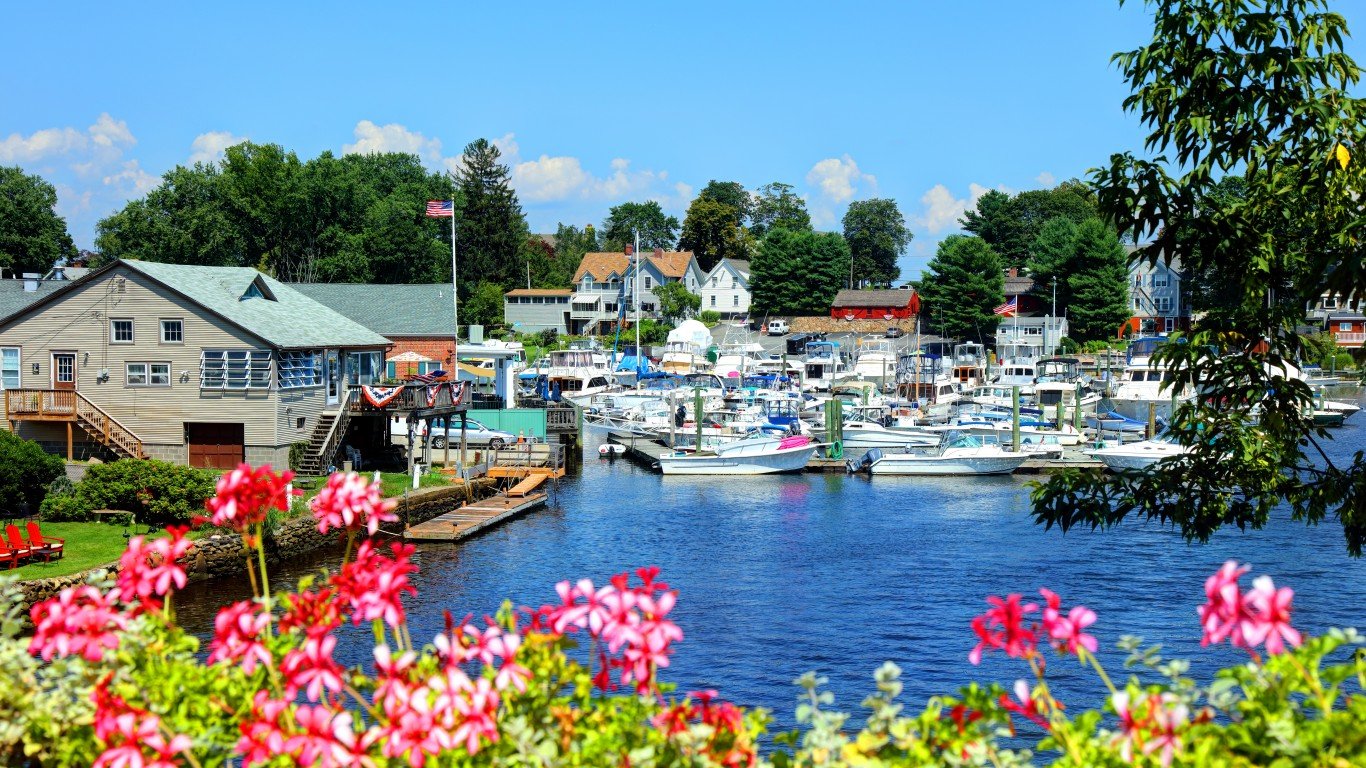
42. Bangor, ME

- Difference from the nat’l avg a resident should pay for take out: 6.41%
41. Mesa, AZ

- Difference from the nat’l avg a resident should pay for take out: 6.42%
40. South Portland, ME

- Difference from the nat’l avg a resident should pay for take out: 6.53%
39. Washington, D.C.

- Difference from the nat’l avg a resident should pay for take out: 6.65%
38. Bridgeport, CT
- Difference from the nat’l avg a resident should pay for take out: 6.68%
37. Pawtucket, RI
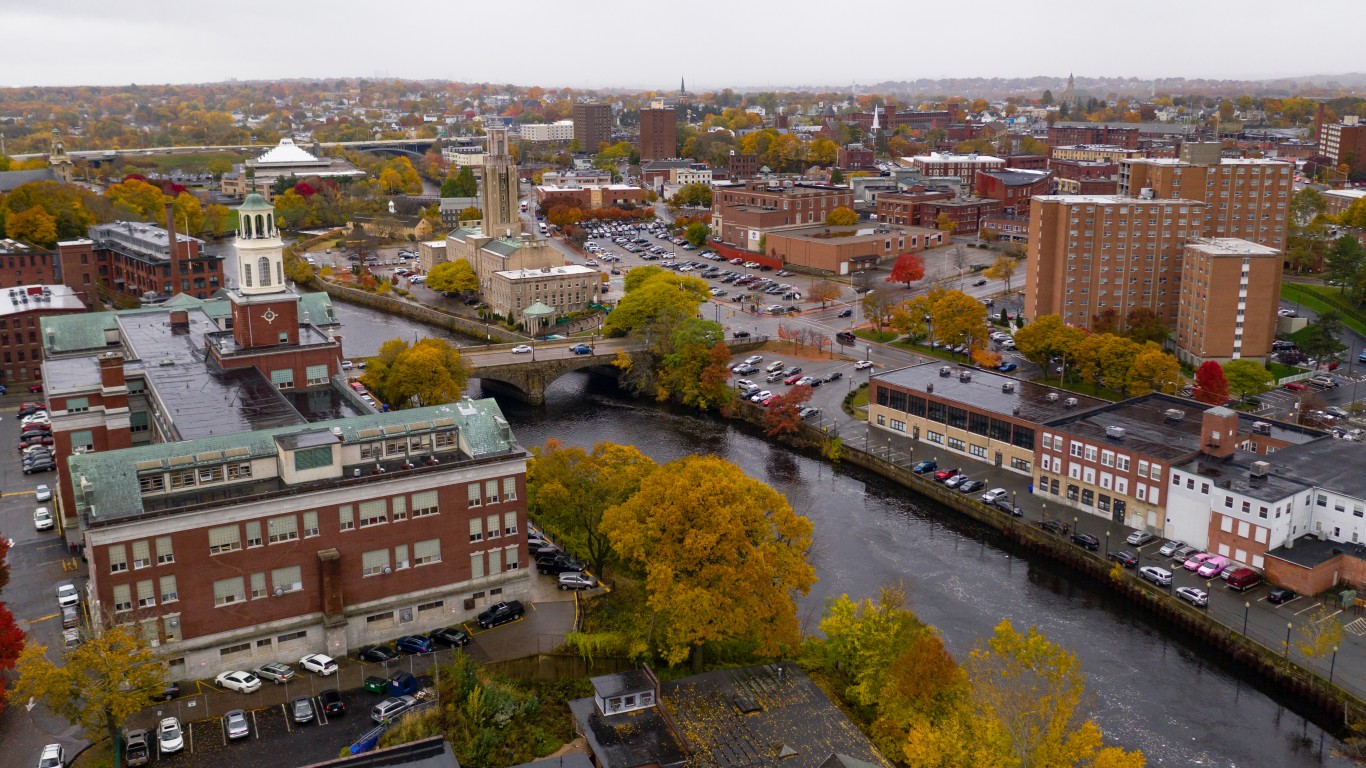
- Difference from the nat’l avg a resident should pay for take out: 6.76%
36. Warwick, RI

- Difference from the nat’l avg a resident should pay for take out: 6.76%
35. Concord, NH

- Difference from the nat’l avg a resident should pay for take out: 7.31%
34. Burlington, VT
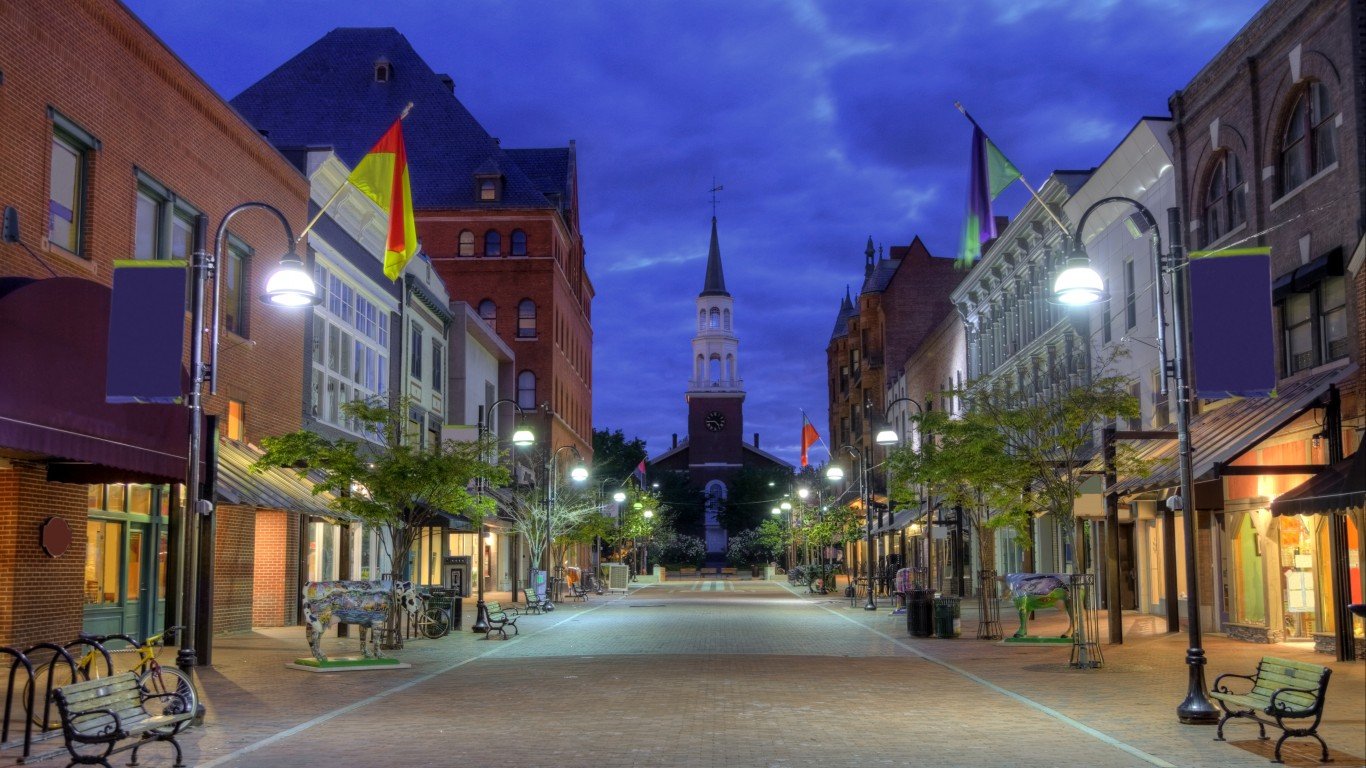
- Difference from the nat’l avg a resident should pay for take out: 7.64%
33. Bellevue, NE
- Difference from the nat’l avg a resident should pay for take out: 7.65%
32. Providence, RI
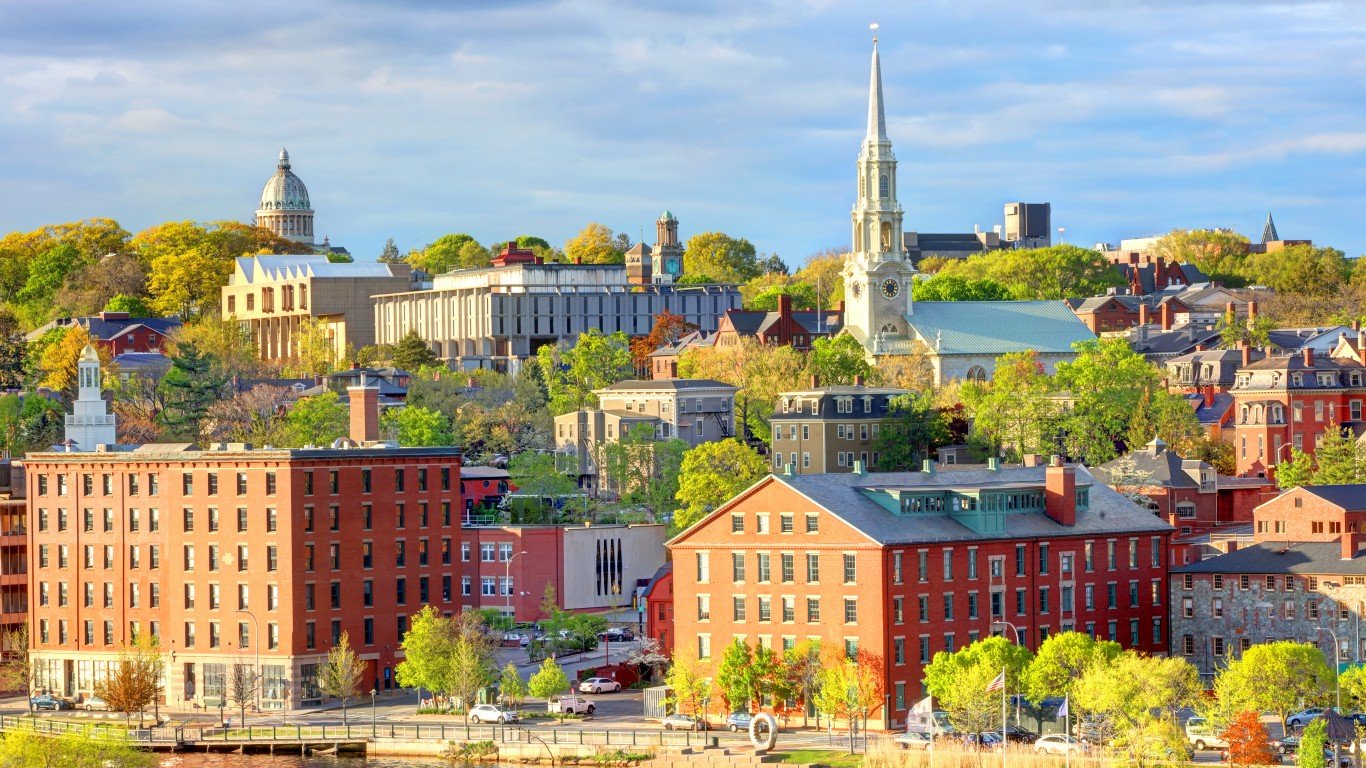
- Difference from the nat’l avg a resident should pay for take out: 7.66%
31. Boston, MA
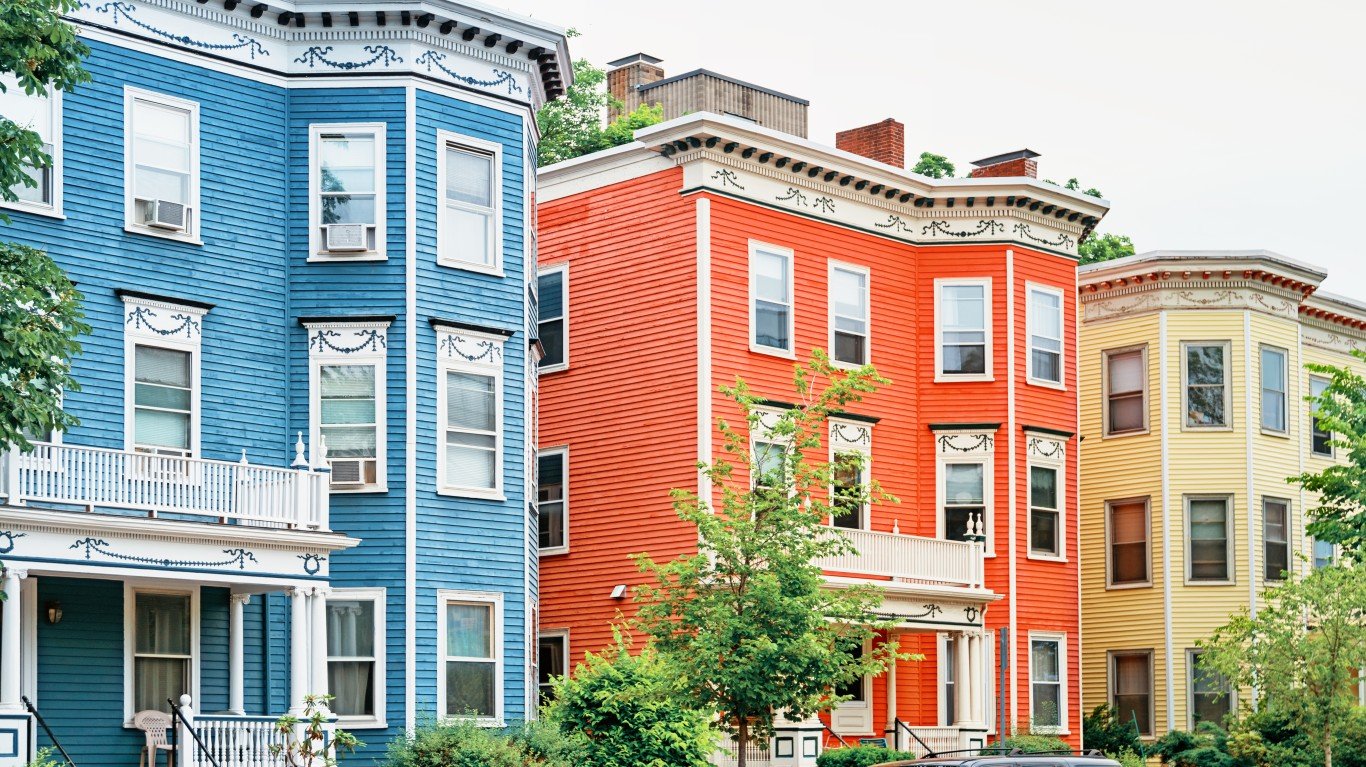
- Difference from the nat’l avg a resident should pay for take out: 7.90%
30. Cranston, RI
- Difference from the nat’l avg a resident should pay for take out: 7.96%
29. Fresno, CA
- Difference from the nat’l avg a resident should pay for take out: 8.04%
28. South Burlington, VT

- Difference from the nat’l avg a resident should pay for take out: 8.15%
27. Yonkers, NY
- Difference from the nat’l avg a resident should pay for take out: 8.29%
26. Portland, ME

- Difference from the nat’l avg a resident should pay for take out: 8.54%
25. Cambridge, MA

- Difference from the nat’l avg a resident should pay for take out: 8.67%
24. Nashua, NH

- Difference from the nat’l avg a resident should pay for take out: 8.80%
23. Portland, OR

- Difference from the nat’l avg a resident should pay for take out: 8.91%
22. Trenton, NJ

- Difference from the nat’l avg a resident should pay for take out: 9.30%
21. Albany, NY
- Difference from the nat’l avg a resident should pay for take out: 9.44%
20. Manchester, NH

- Difference from the nat’l avg a resident should pay for take out: 10.42%
19. Pearl City, HI

- Difference from the nat’l avg a resident should pay for take out: 10.47%
18. Worcester, MA
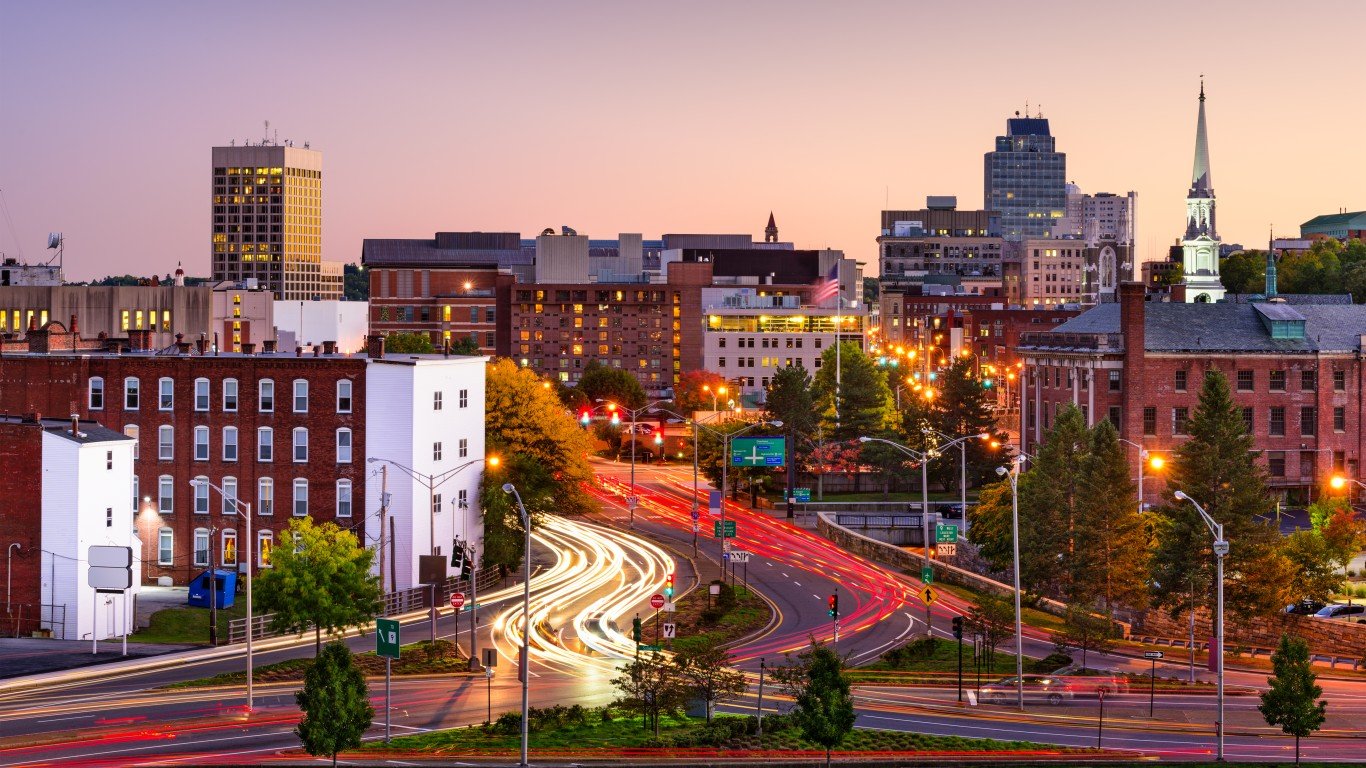
- Difference from the nat’l avg a resident should pay for take out: 10.80%
17. Spokane, WA

- Difference from the nat’l avg a resident should pay for take out: 11.17%
16. Salem, OR
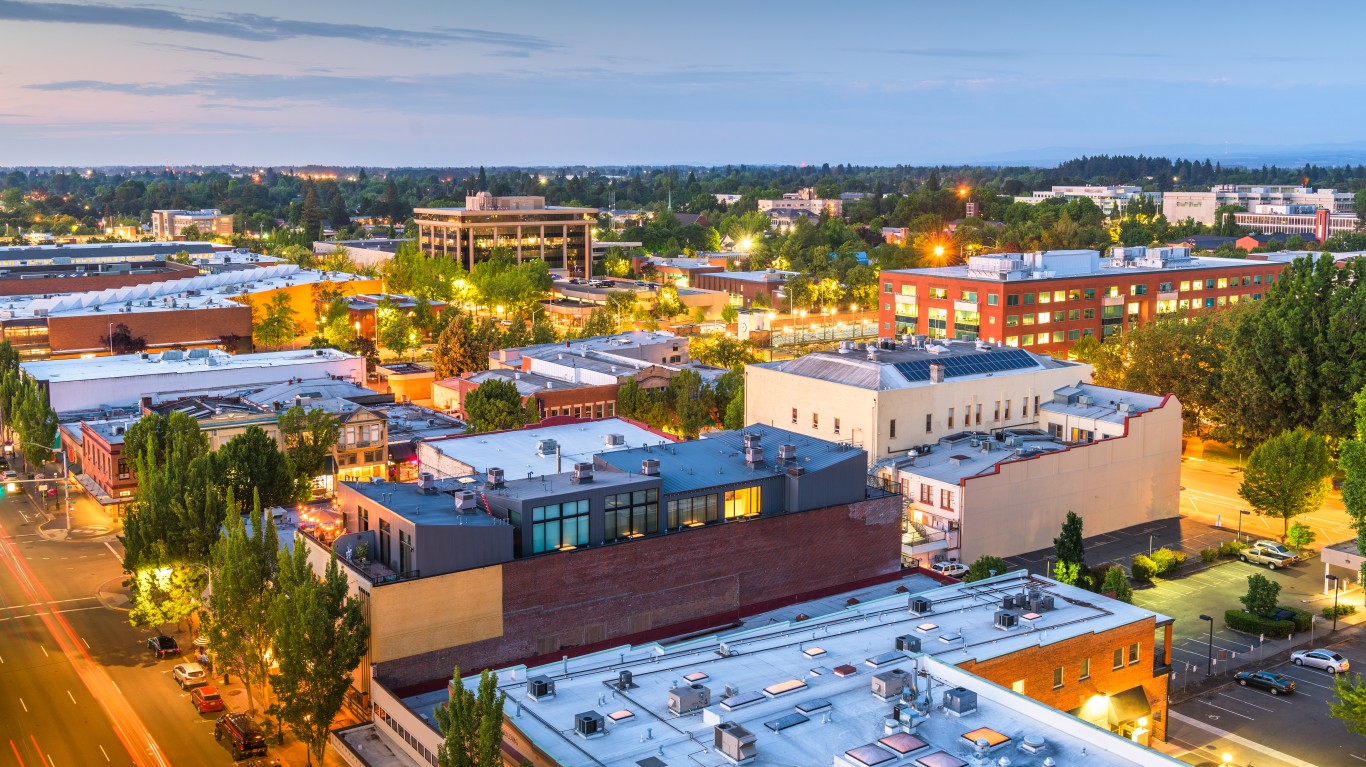
- Difference from the nat’l avg a resident should pay for take out: 11.53%
15. Olympia, WA
- Difference from the nat’l avg a resident should pay for take out: 11.75%
14. Sacramento, CA

- Difference from the nat’l avg a resident should pay for take out: 11.76%
13. Middletown, DE

- Difference from the nat’l avg a resident should pay for take out: 12.07%
12. Kailua, HI
- Difference from the nat’l avg a resident should pay for take out: 13.11%
11. San Francisco, CA

- Difference from the nat’l avg a resident should pay for take out: 13.39%
10. San Diego, CA

- Difference from the nat’l avg a resident should pay for take out: 14.60%
9. New York, NY
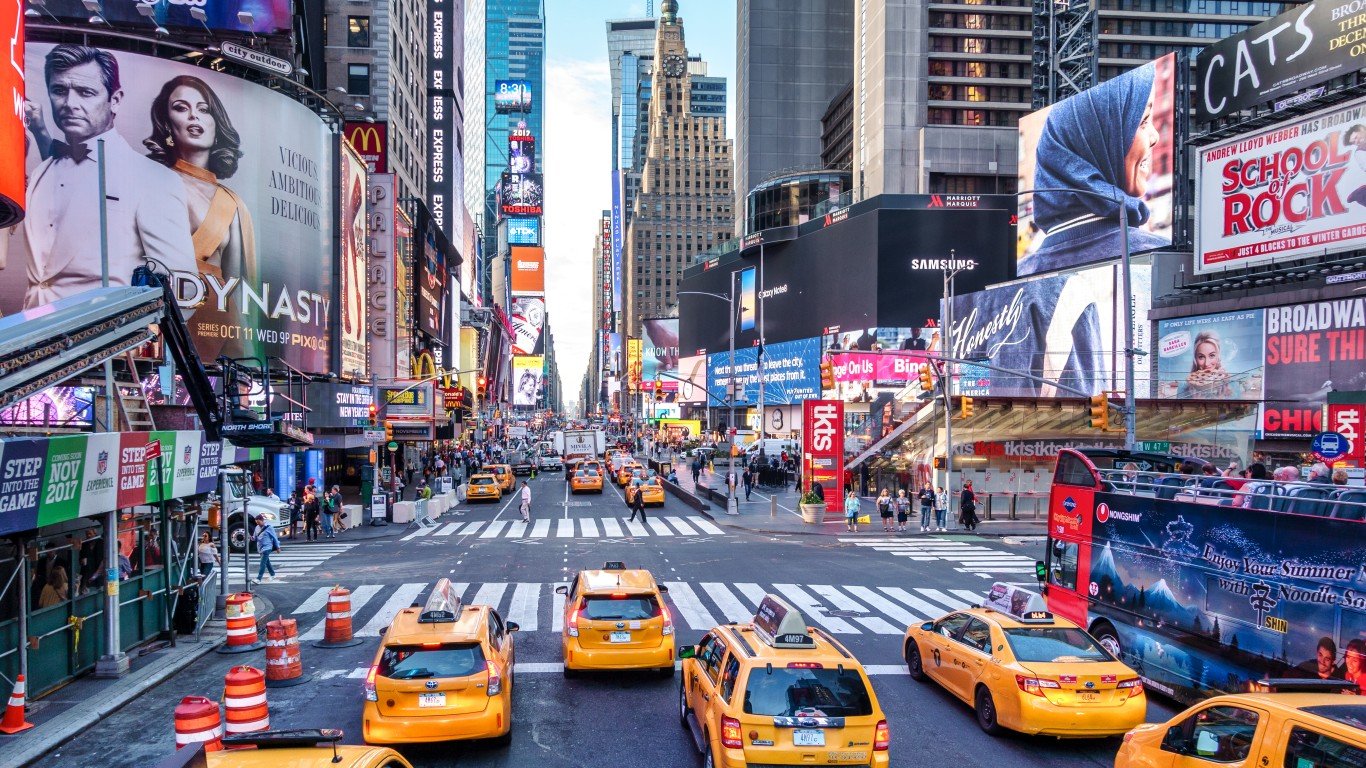
- Difference from the nat’l avg a resident should pay for take out: 14.60%
8. Seattle, WA

- Difference from the nat’l avg a resident should pay for take out: 14.95%
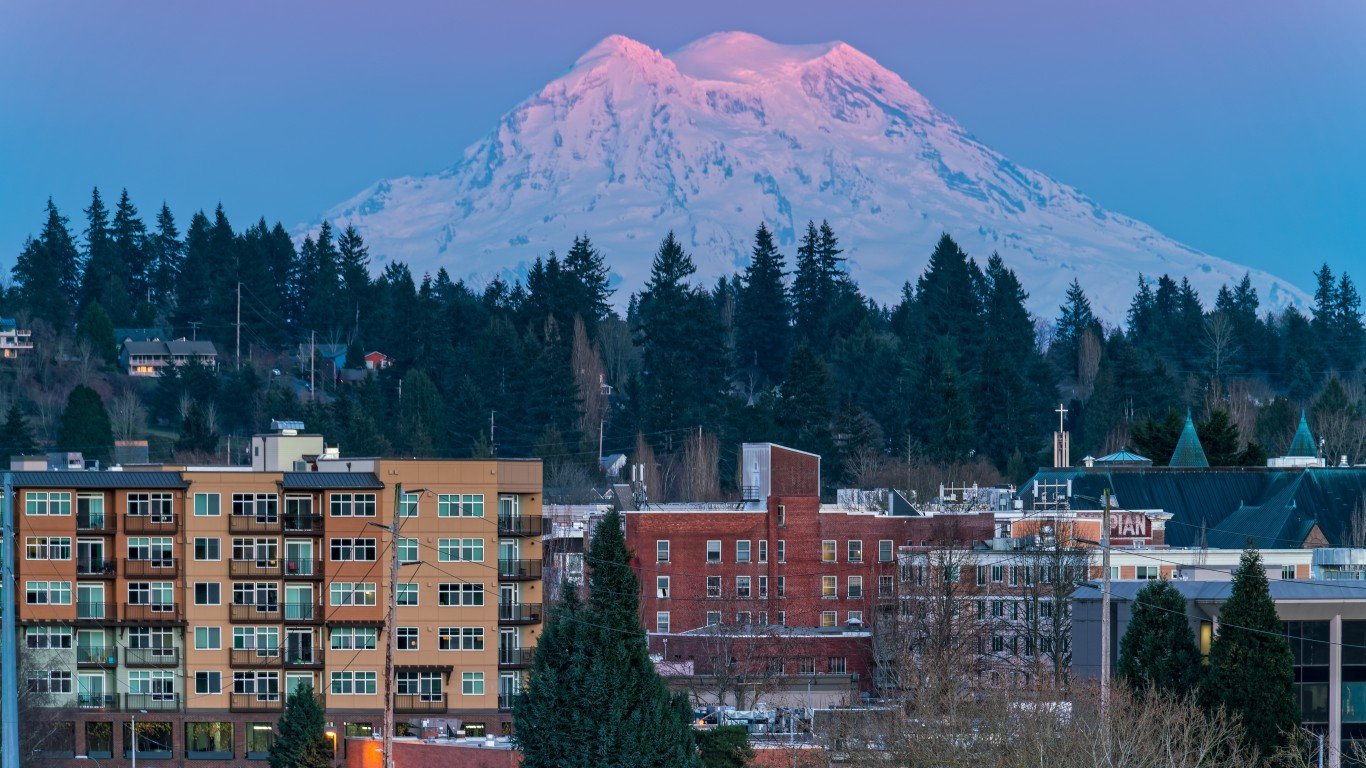
7. Tacoma, WA
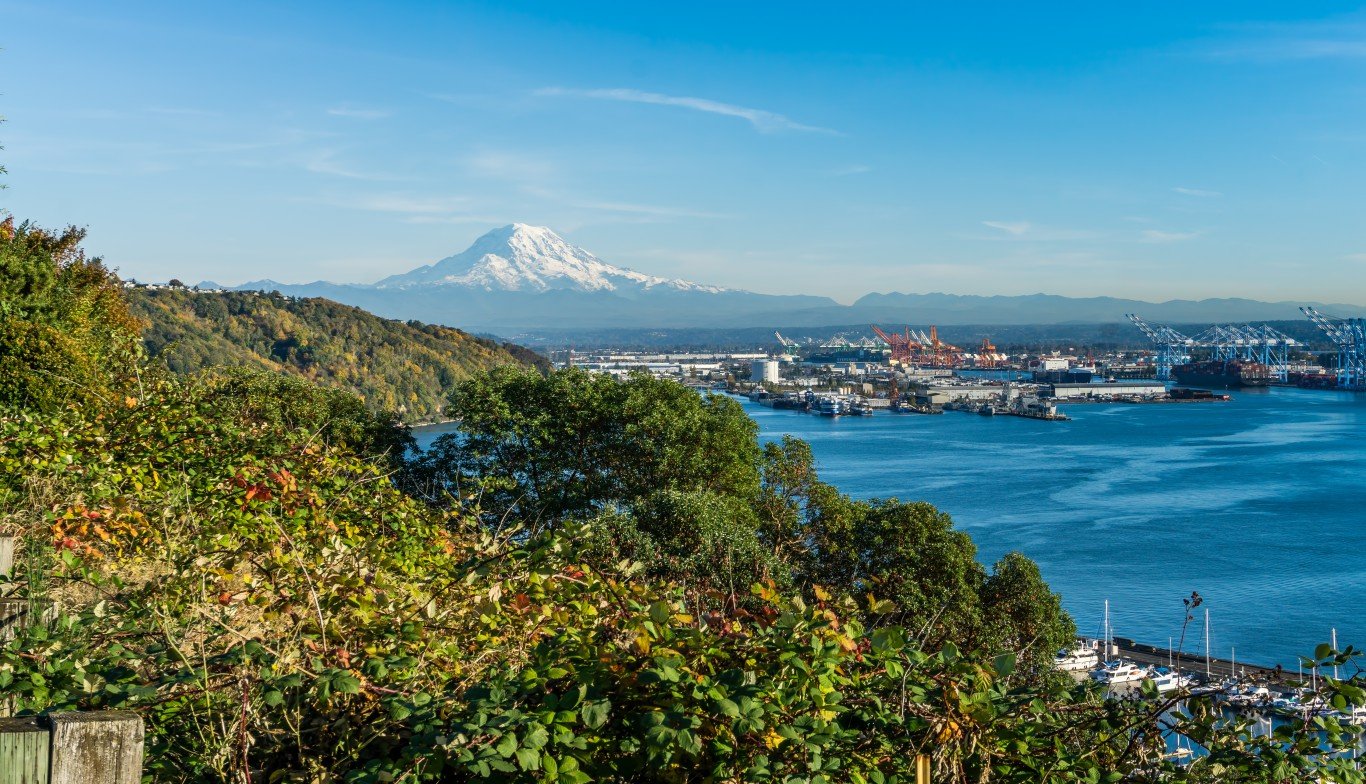
- Difference from the nat’l avg a resident should pay for take out: 15.19%
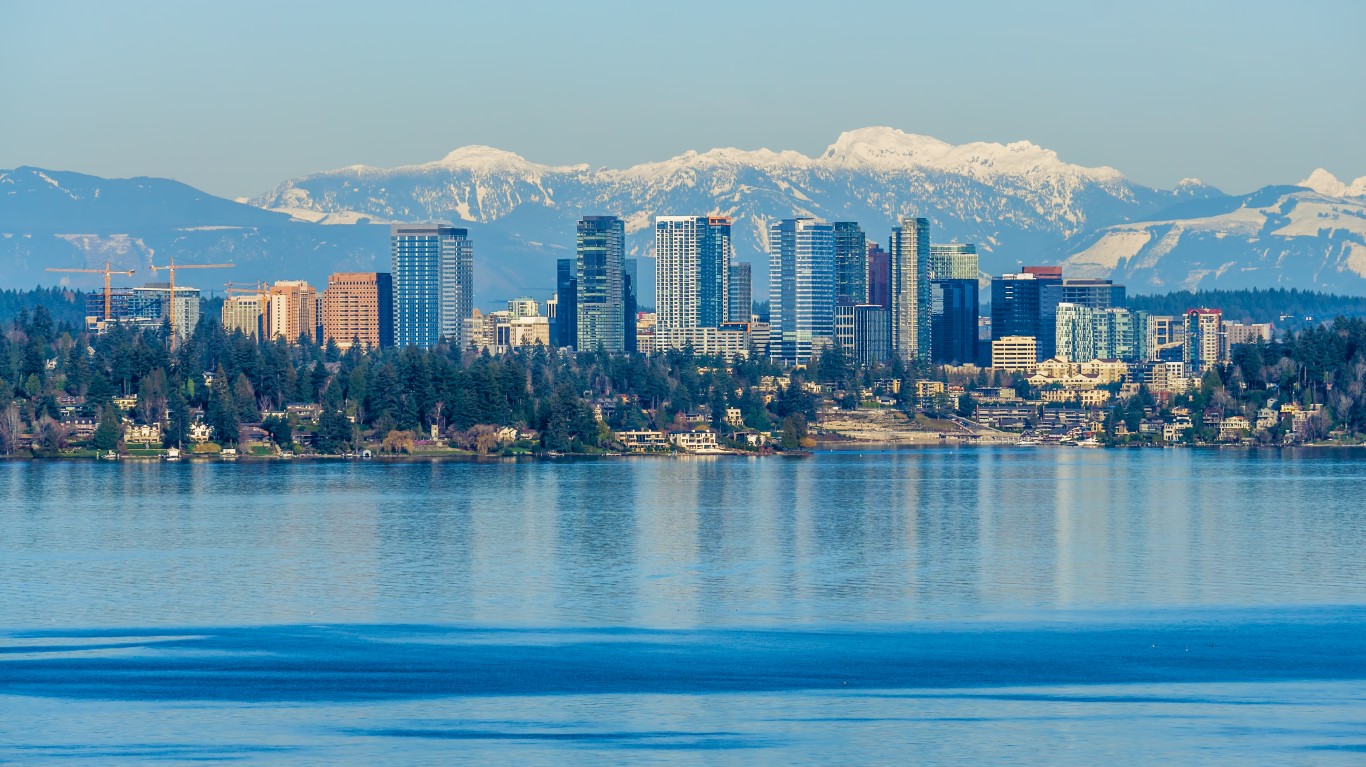
6. Bellevue, WA
- Difference from the nat’l avg a resident should pay for take out: 16.67%
5. Edmond, OK

- Difference from the nat’l avg a resident should pay for take out: 16.85%
4. Los Angeles, CA
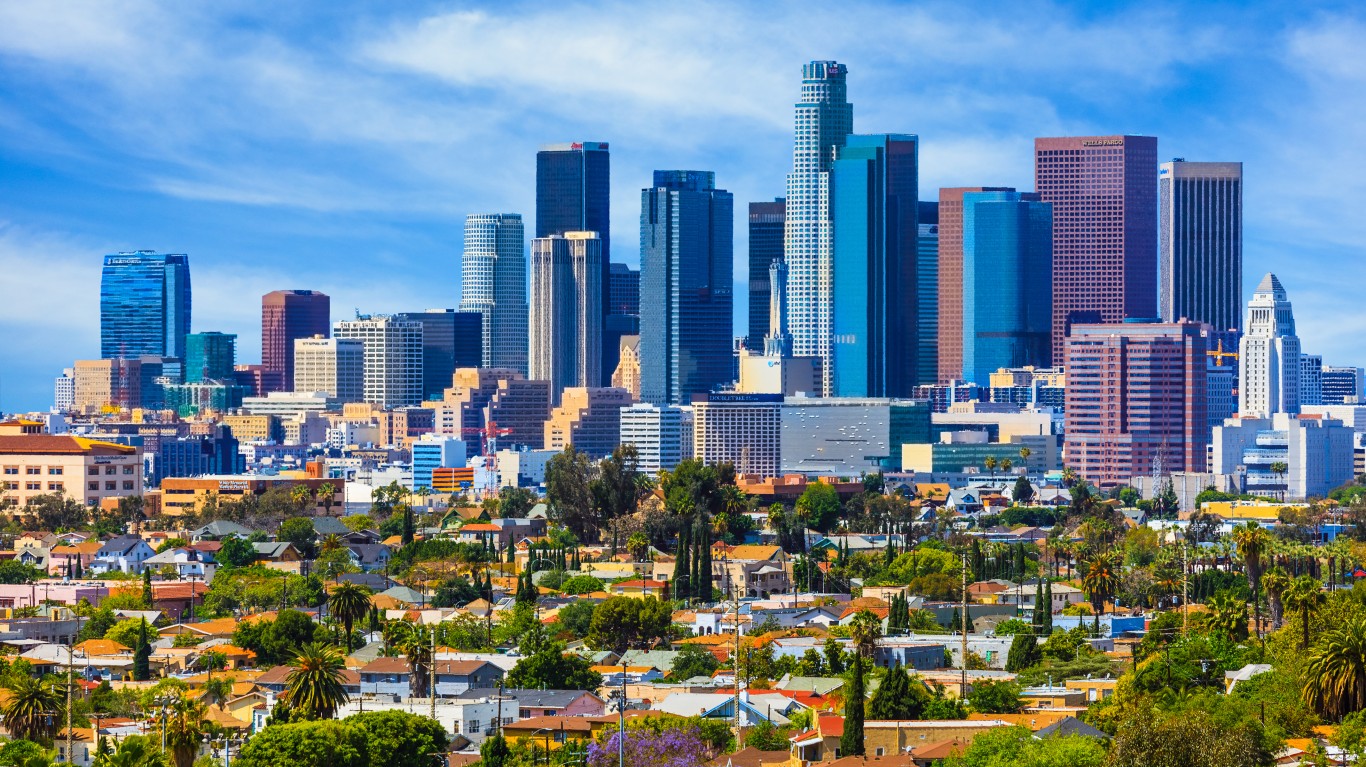
- Difference from the nat’l avg a resident should pay for take out: 17.93%
3. Fairbanks, AK

- Difference from the nat’l avg a resident should pay for take out: 17.99%
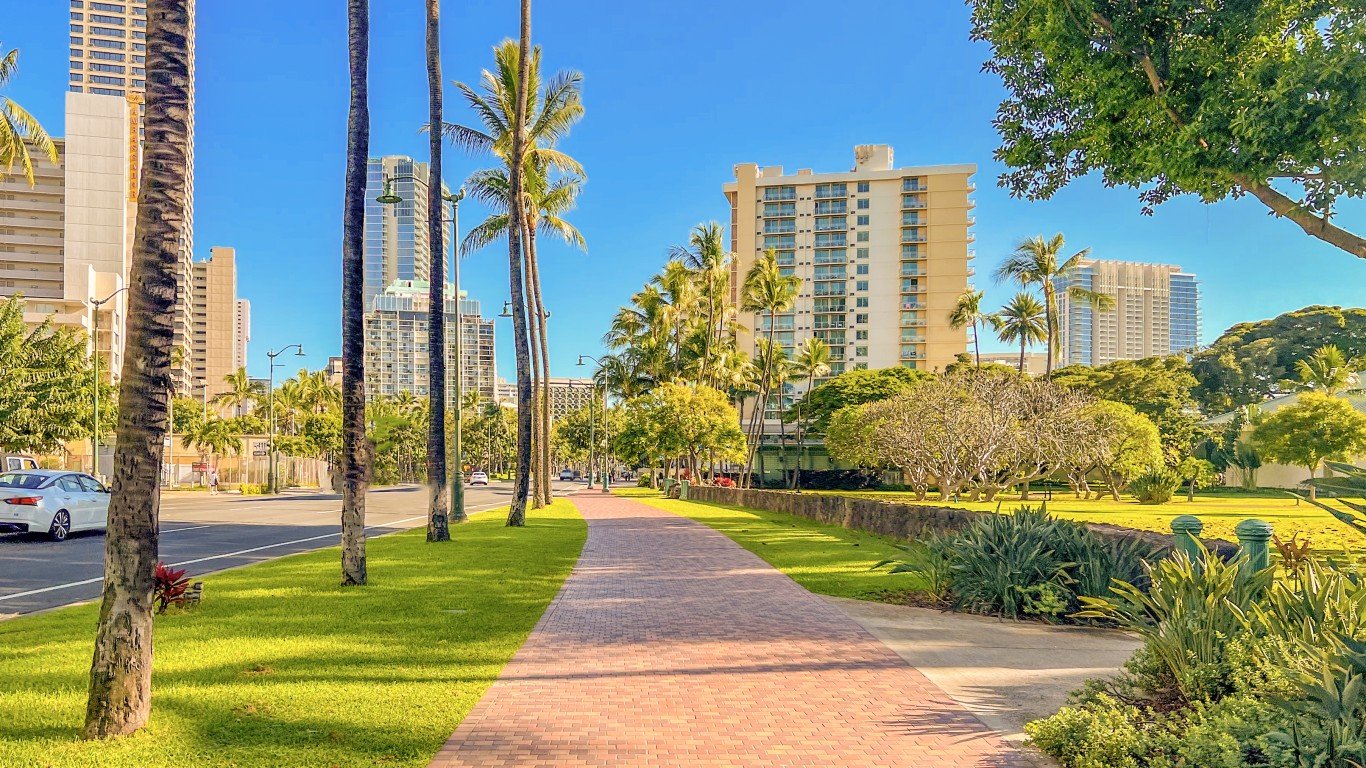
2. Honolulu, HI
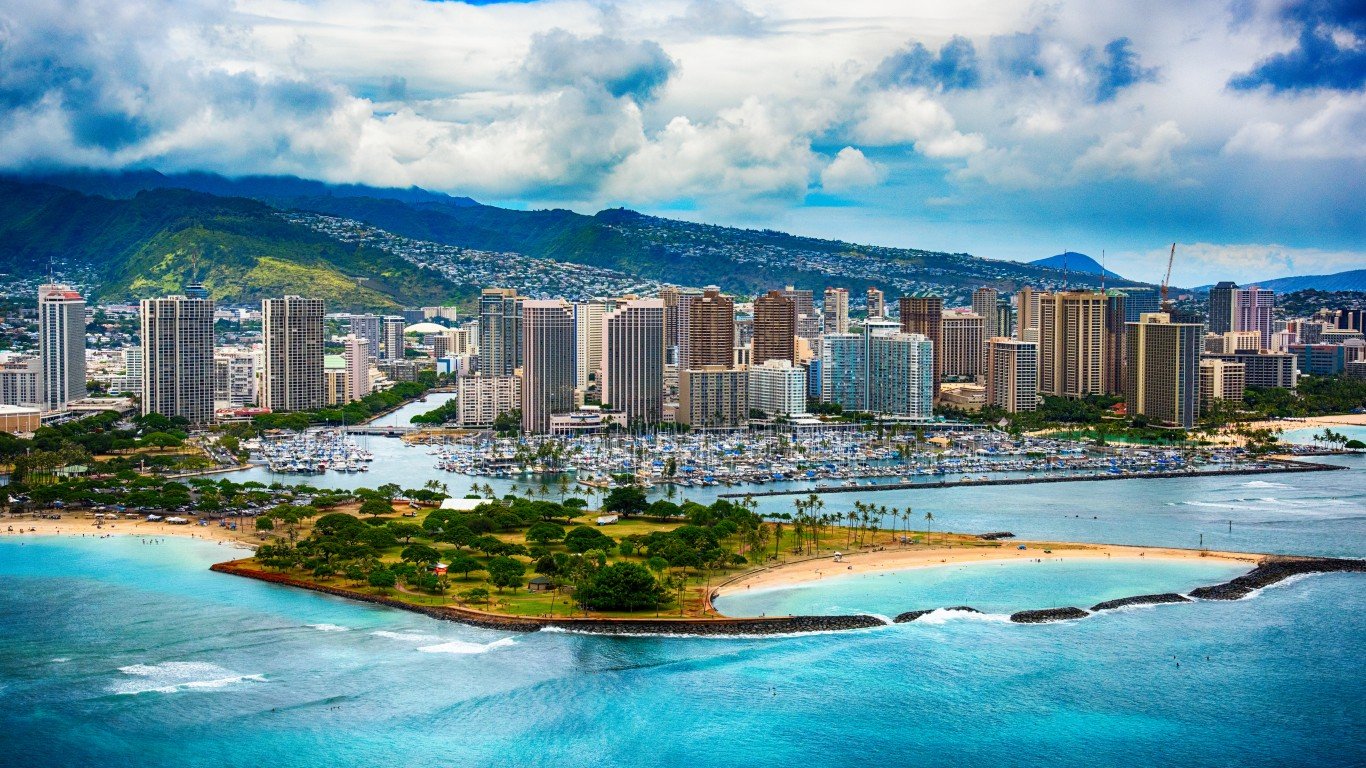
- Difference from the nat’l avg a resident should pay for take out: 18.07%
1. Anchorage, AK

- Difference from the nat’l avg a resident should pay for take out: 18.29%