
If you are looking for a way to eat locally sourced foods and support the local economy then you should start shopping at the farmers market. Farmers markets are popping up more and more across America as places where farmers can sell their seasonal goods directly to the consumer. Shopping at the outdoor markets is an excellent way to learn more about where your food comes from and the hard-working folks who produce it. Some farmers markets are open year-round, and others are seasonal operations only from late spring to early fall. Check with your local market to learn more about their days and hours.
When you taste the difference between fresh produce and store-bought you will be sold on the farmers market experience. And if that wasn’t enough, buying fresh fruits and vegetables from your local farmers market helps the environment by cutting out the middle man so fresh produce doesn’t have to travel far to get into the hands of home cooks.
Besides fresh produce, market vendors sell products made from locally sourced ingredients. You can find unique products like homemade jellies, jams, chutneys, bread, pastries, and even locally-produced honey. While some farmers markets only sell foods, others have other items like handmade jewelry, soaps, fresh-cut flowers, and houseplants. You never know what cool things are hiding at the farmers market.
Every small town and big city has a farmers market. Some are just a handful of tables; others are big, bustling markets with food trucks, musicians, face painters, and more. If you want to learn more about farmers markets across the U.S. and learn about the cities with the most farmers markets per capita, then read on and see how your own farmers market ranks. (Interested in a different kind of place to get groceries? Next, check out The Best Supermarkets in America.)
Methodology:
To determine the cities with the most farmers markets, 24/7 Tempo reviewed data on farmers market listings from the USDA. Cities were ranked based on the total number of farmers market listings per 100,000 residents. Place boundary definitions came from the U.S. Census Bureau and were buffered five miles to include farmers’ markets just outside the city boundary. Data on population is from the U.S. Census Bureau’s American Community Survey. Only cities with at least 50,000 residents were considered.
50. Syracuse, NY

- Concentration of farmers markets: 4.8 per 100,000 residents
- Farmers market count: 7 listings
- Total population: 146,134
49. Madison, WI
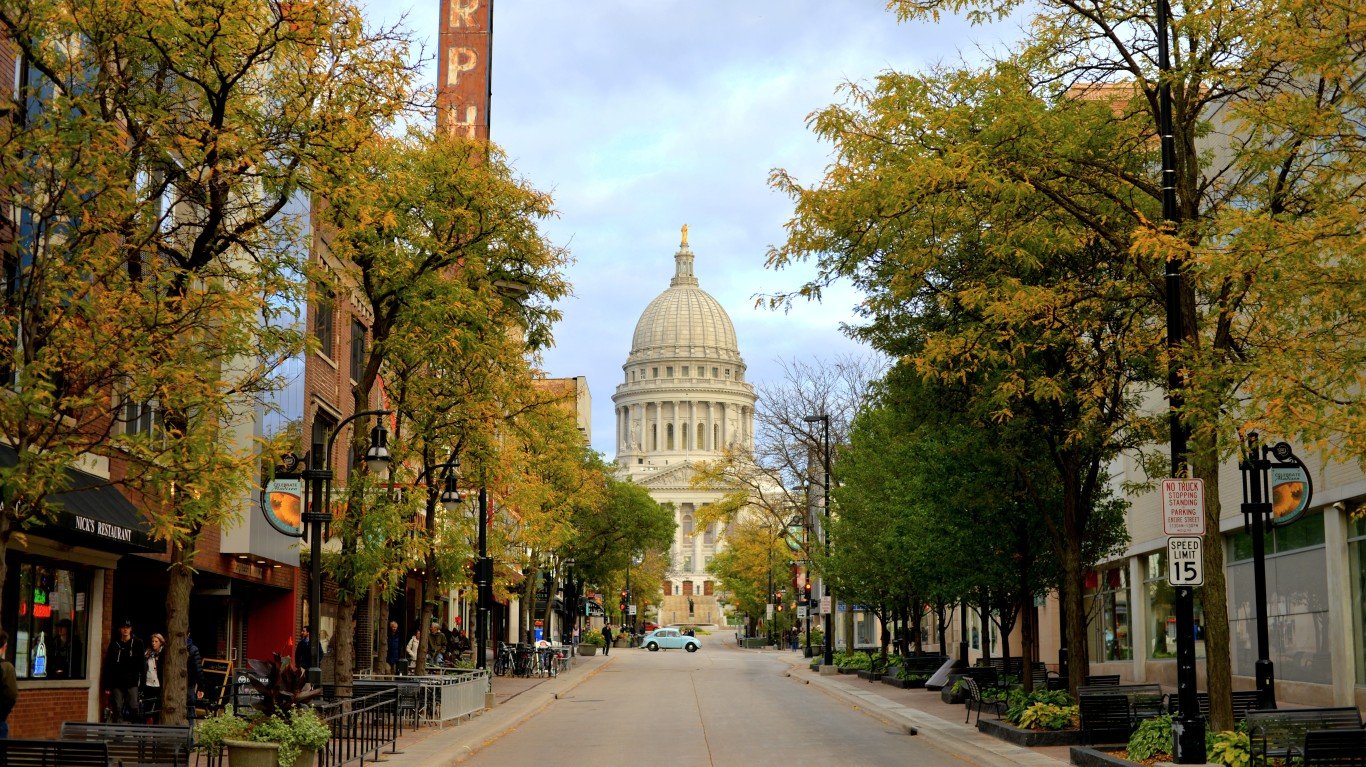
- Concentration of farmers markets: 4.8 per 100,000 residents
- Farmers market count: 13 listings
- Total population: 268,516
48. Chico, CA
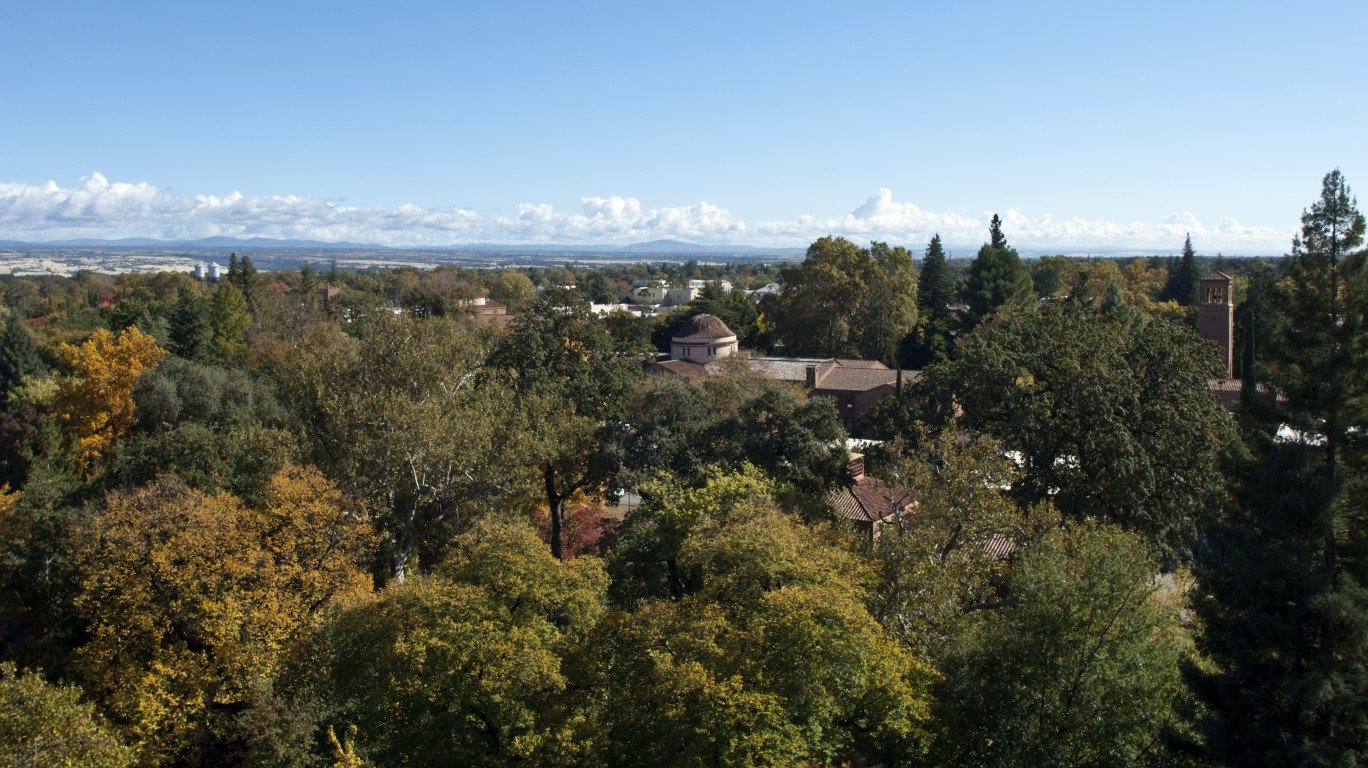
- Concentration of farmers markets: 4.9 per 100,000 residents
- Farmers market count: 5 listings
- Total population: 102,790
47. Denver, CO
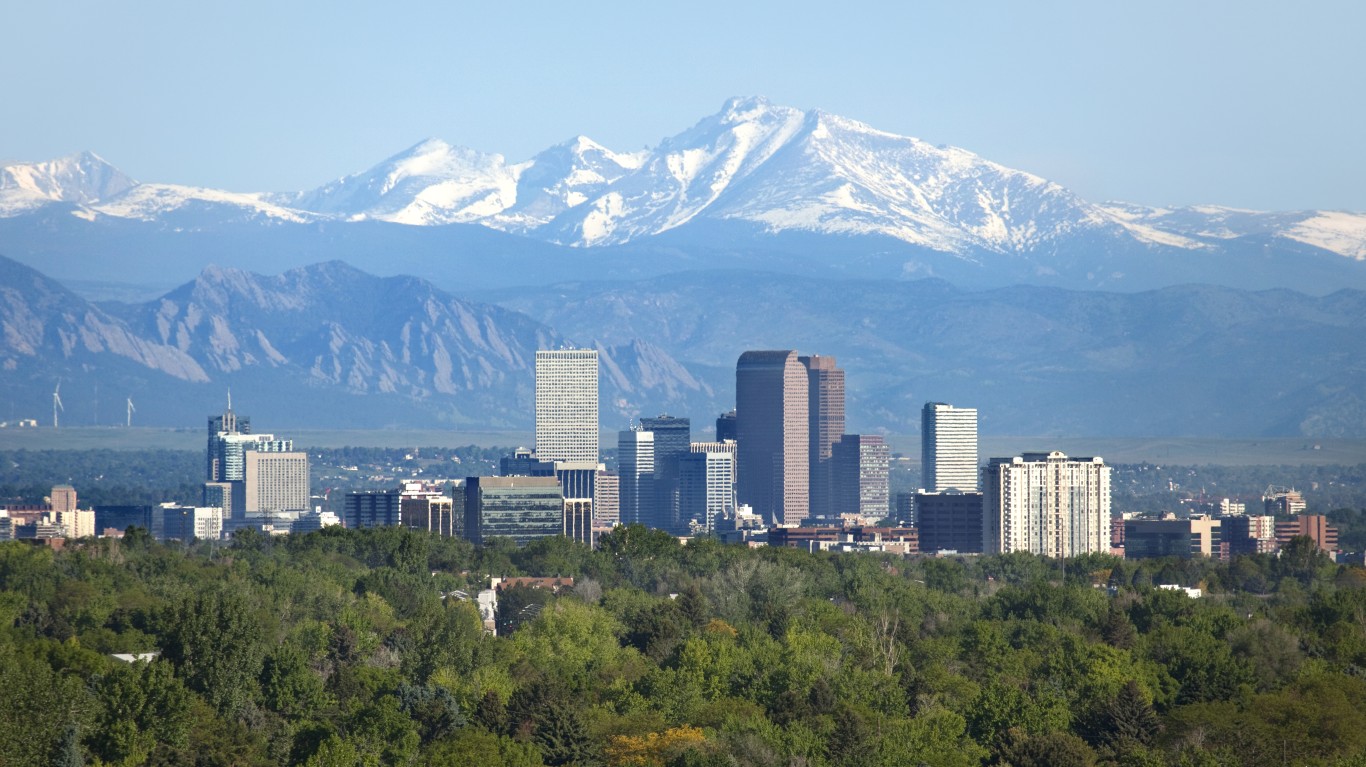
- Concentration of farmers markets: 4.9 per 100,000 residents
- Farmers market count: 35 listings
- Total population: 710,800
46. Milwaukee, WI
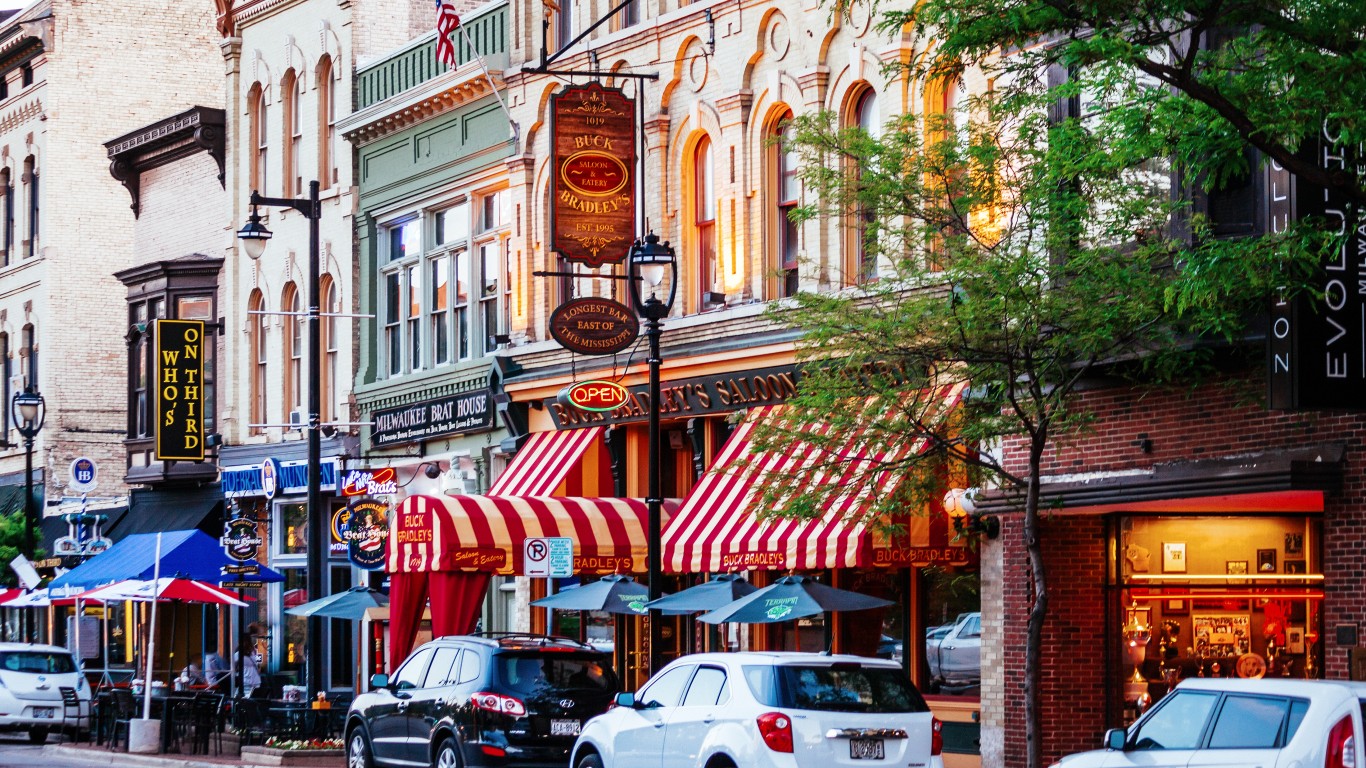
- Concentration of farmers markets: 5.1 per 100,000 residents
- Farmers market count: 29 listings
- Total population: 573,299
45. Lawrence, KS

- Concentration of farmers markets: 5.3 per 100,000 residents
- Farmers market count: 5 listings
- Total population: 95,103
44. Portland, OR

- Concentration of farmers markets: 5.4 per 100,000 residents
- Farmers market count: 35 listings
- Total population: 646,101
43. Anchorage, AK
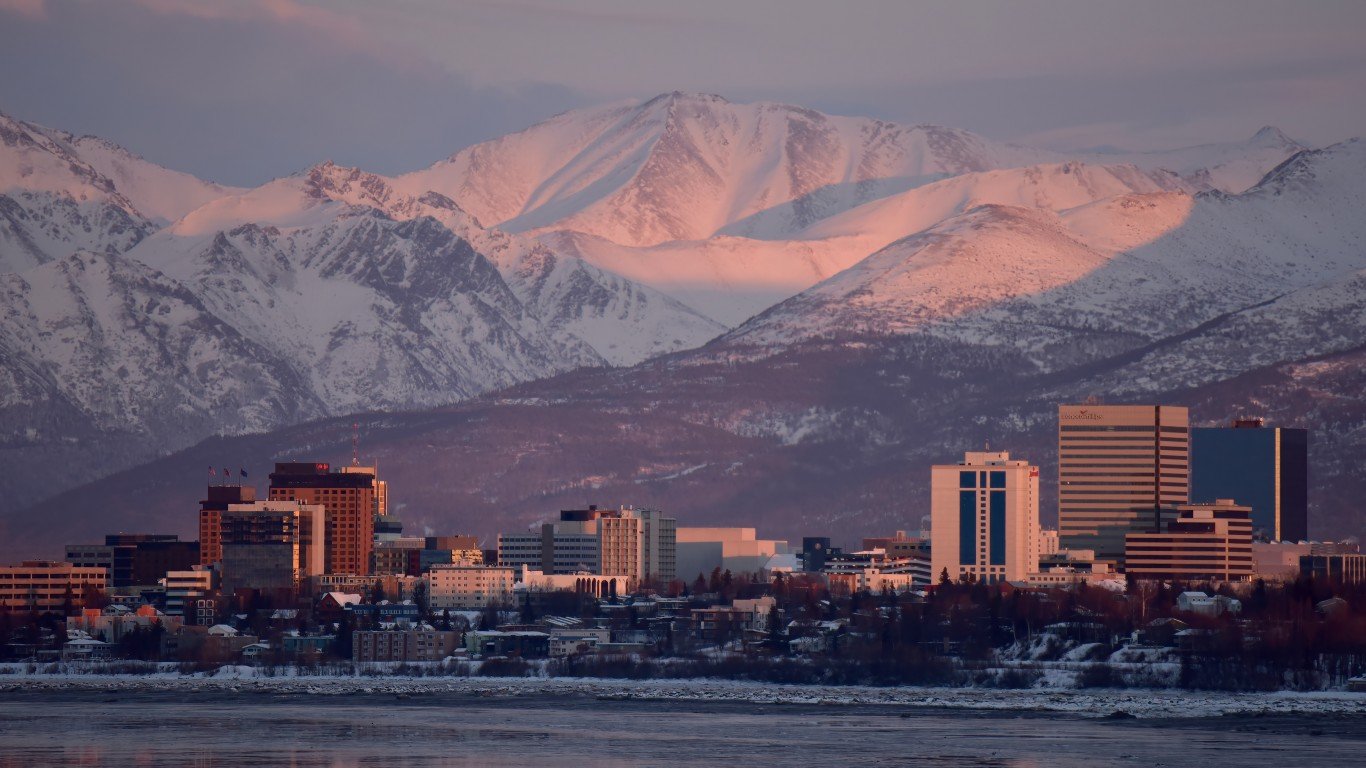
- Concentration of farmers markets: 5.5 per 100,000 residents
- Farmers market count: 16 listings
- Total population: 290,674
42. Chattanooga, TN

- Concentration of farmers markets: 5.5 per 100,000 residents
- Farmers market count: 10 listings
- Total population: 181,288
41. Greenville, NC
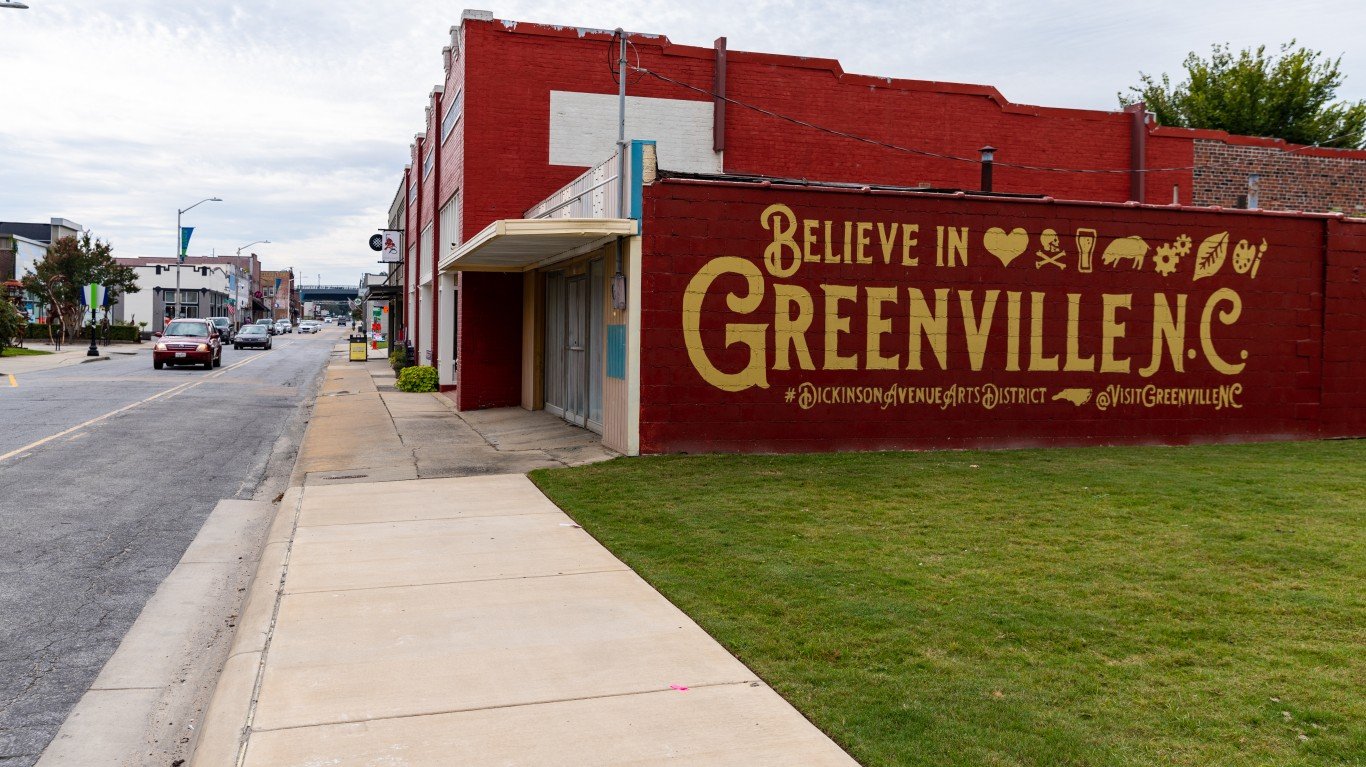
- Concentration of farmers markets: 5.7 per 100,000 residents
- Farmers market count: 5 listings
- Total population: 87,894
40. Lafayette, LA

- Concentration of farmers markets: 5.8 per 100,000 residents
- Farmers market count: 7 listings
- Total population: 121,706
39. Mobile, AL
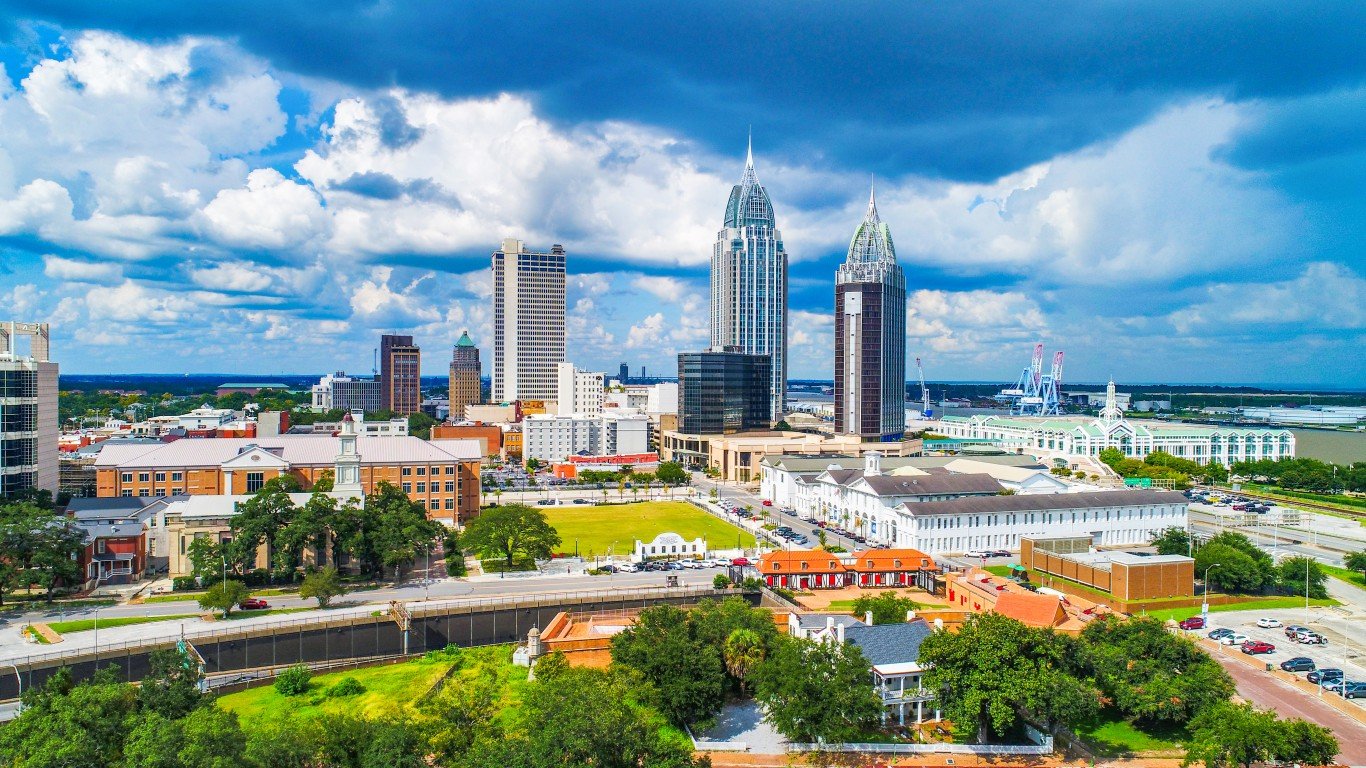
- Concentration of farmers markets: 5.9 per 100,000 residents
- Farmers market count: 11 listings
- Total population: 186,316
38. Boston, MA

- Concentration of farmers markets: 6.2 per 100,000 residents
- Farmers market count: 41 listings
- Total population: 665,945
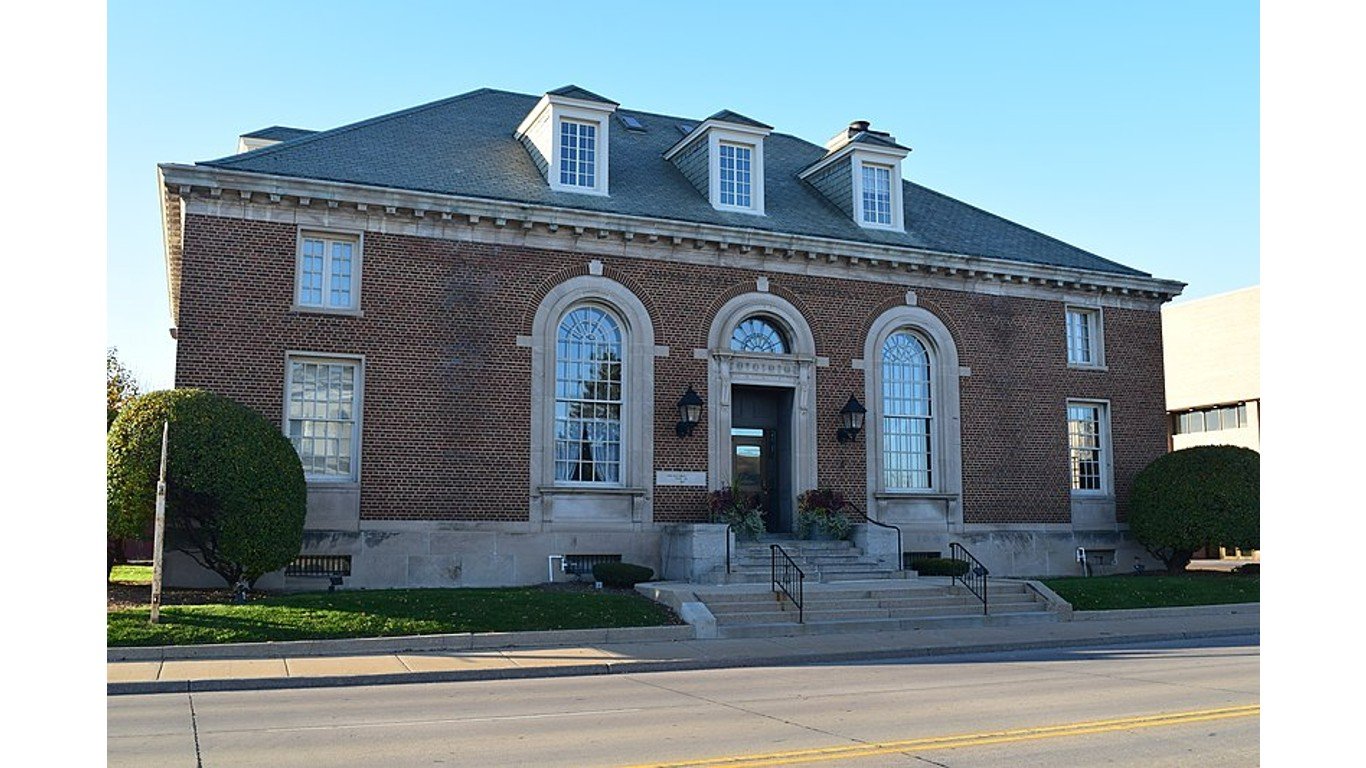
37. Peoria, IL

- Concentration of farmers markets: 6.2 per 100,000 residents
- Farmers market count: 7 listings
- Total population: 113,054
36. Redding, CA

- Concentration of farmers markets: 6.4 per 100,000 residents
- Farmers market count: 6 listings
- Total population: 93,327
35. Grand Rapids, MI
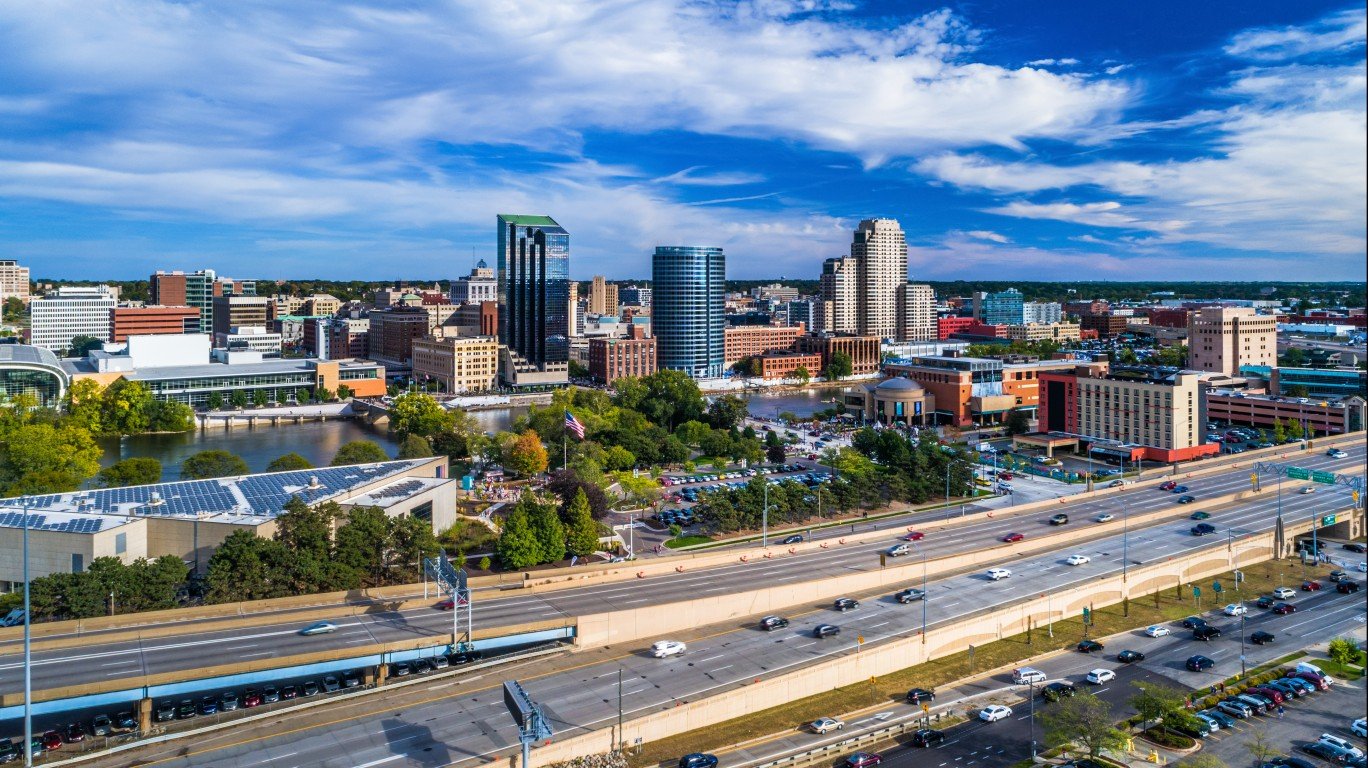
- Concentration of farmers markets: 6.6 per 100,000 residents
- Farmers market count: 13 listings
- Total population: 198,096
34. Des Moines, IA
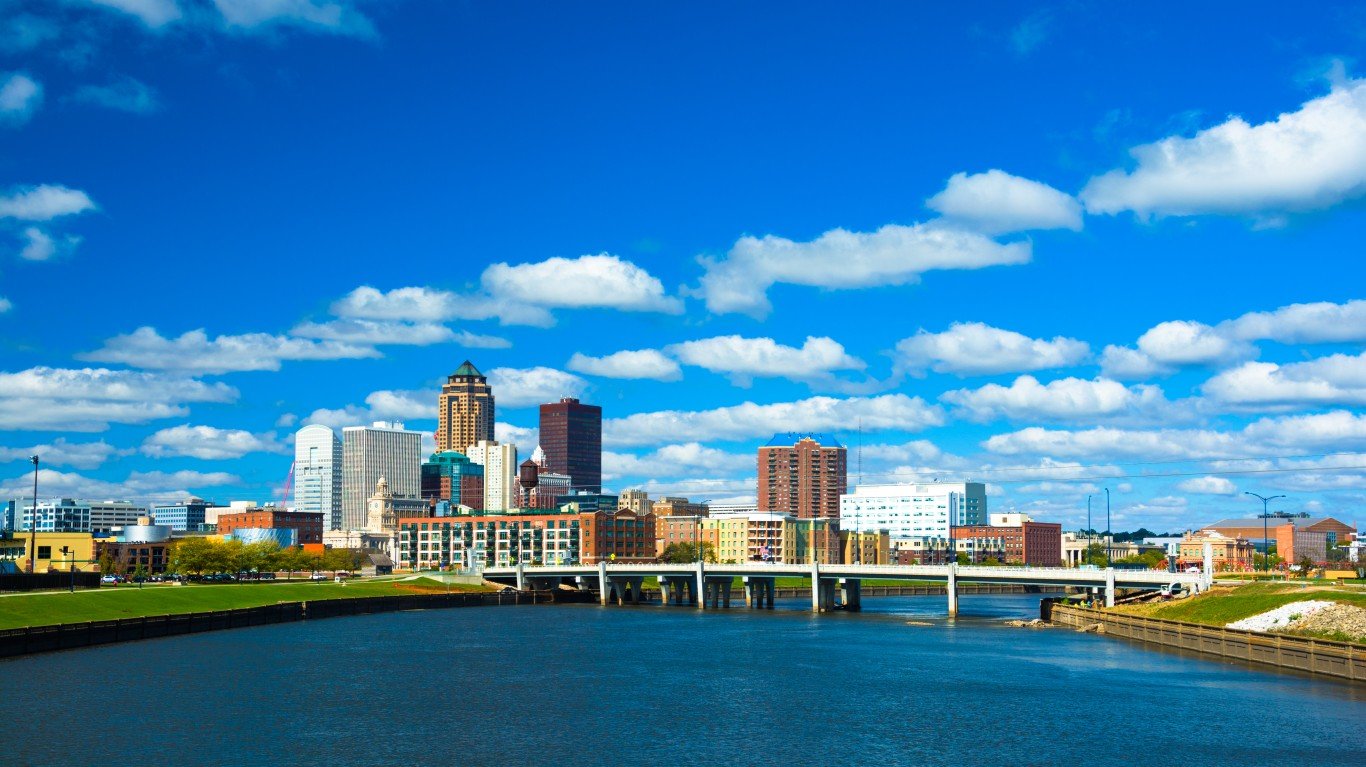
- Concentration of farmers markets: 6.6 per 100,000 residents
- Farmers market count: 14 listings
- Total population: 213,164
33. Missoula, MT

- Concentration of farmers markets: 6.7 per 100,000 residents
- Farmers market count: 5 listings
- Total population: 74,627
32. Rockford, IL

- Concentration of farmers markets: 6.7 per 100,000 residents
- Farmers market count: 10 listings
- Total population: 148,173
31. South Bend, IN

- Concentration of farmers markets: 6.8 per 100,000 residents
- Farmers market count: 7 listings
- Total population: 103,084
30. Fort Collins, CO
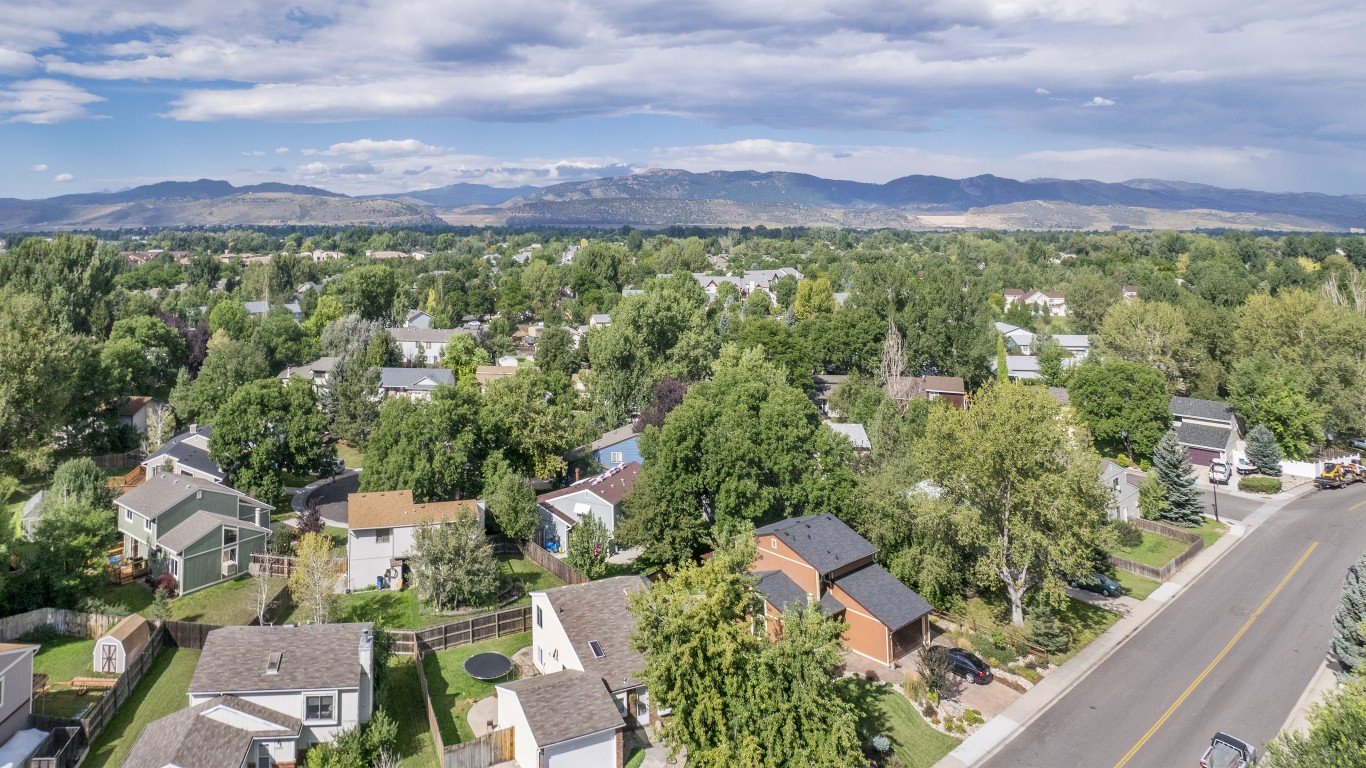
- Concentration of farmers markets: 7.1 per 100,000 residents
- Farmers market count: 12 listings
- Total population: 168,758
29. Cincinnati, OH

- Concentration of farmers markets: 7.1 per 100,000 residents
- Farmers market count: 22 listings
- Total population: 308,870
28. Manhattan, KS
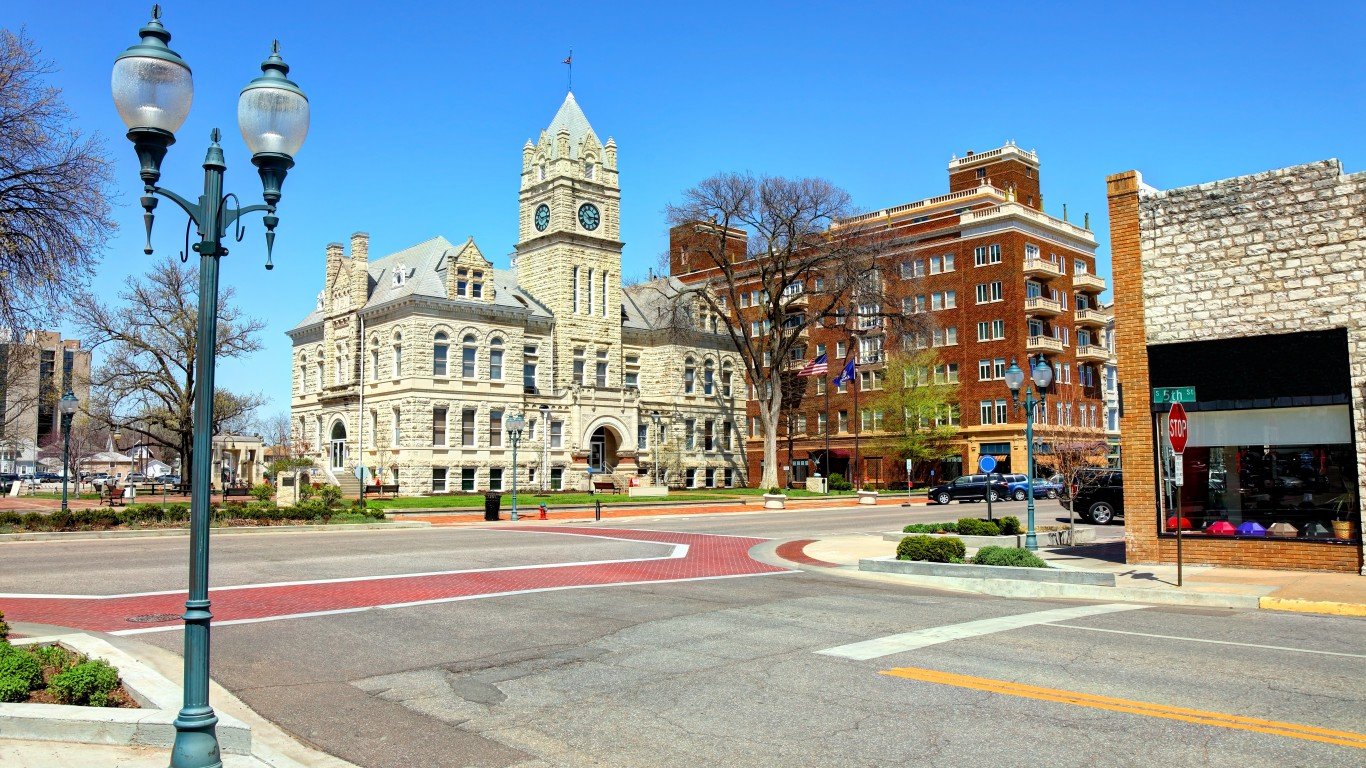
- Concentration of farmers markets: 7.4 per 100,000 residents
- Farmers market count: 4 listings
- Total population: 54,287
27. Asheville, NC
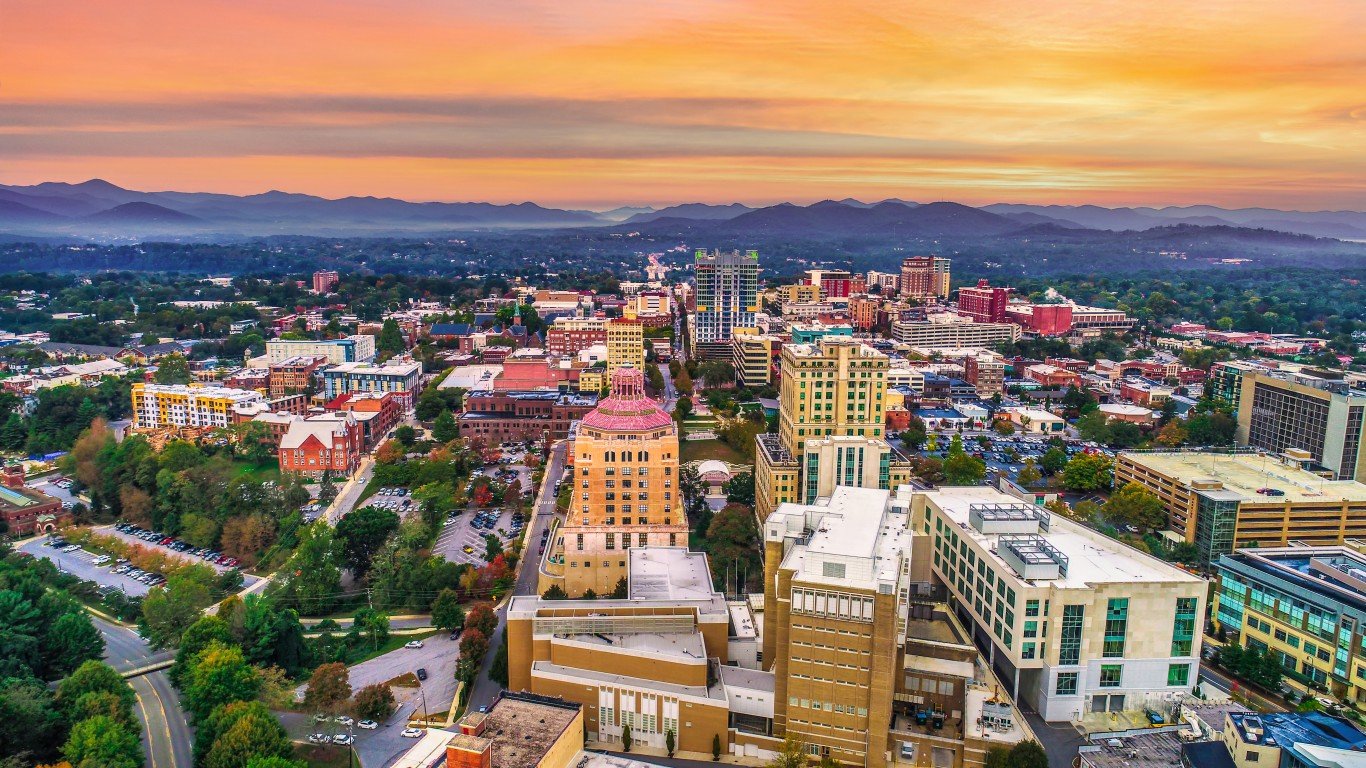
- Concentration of farmers markets: 7.5 per 100,000 residents
- Farmers market count: 7 listings
- Total population: 93,695
26. Oshkosh, WI
- Concentration of farmers markets: 7.5 per 100,000 residents
- Farmers market count: 5 listings
- Total population: 66,373
25. Bloomington, IN
- Concentration of farmers markets: 7.6 per 100,000 residents
- Farmers market count: 6 listings
- Total population: 79,006
24. Springfield, MA

- Concentration of farmers markets: 7.7 per 100,000 residents
- Farmers market count: 12 listings
- Total population: 155,305
23. Dayton, OH

- Concentration of farmers markets: 8.0 per 100,000 residents
- Farmers market count: 11 listings
- Total population: 137,305
22. Ann Arbor, MI
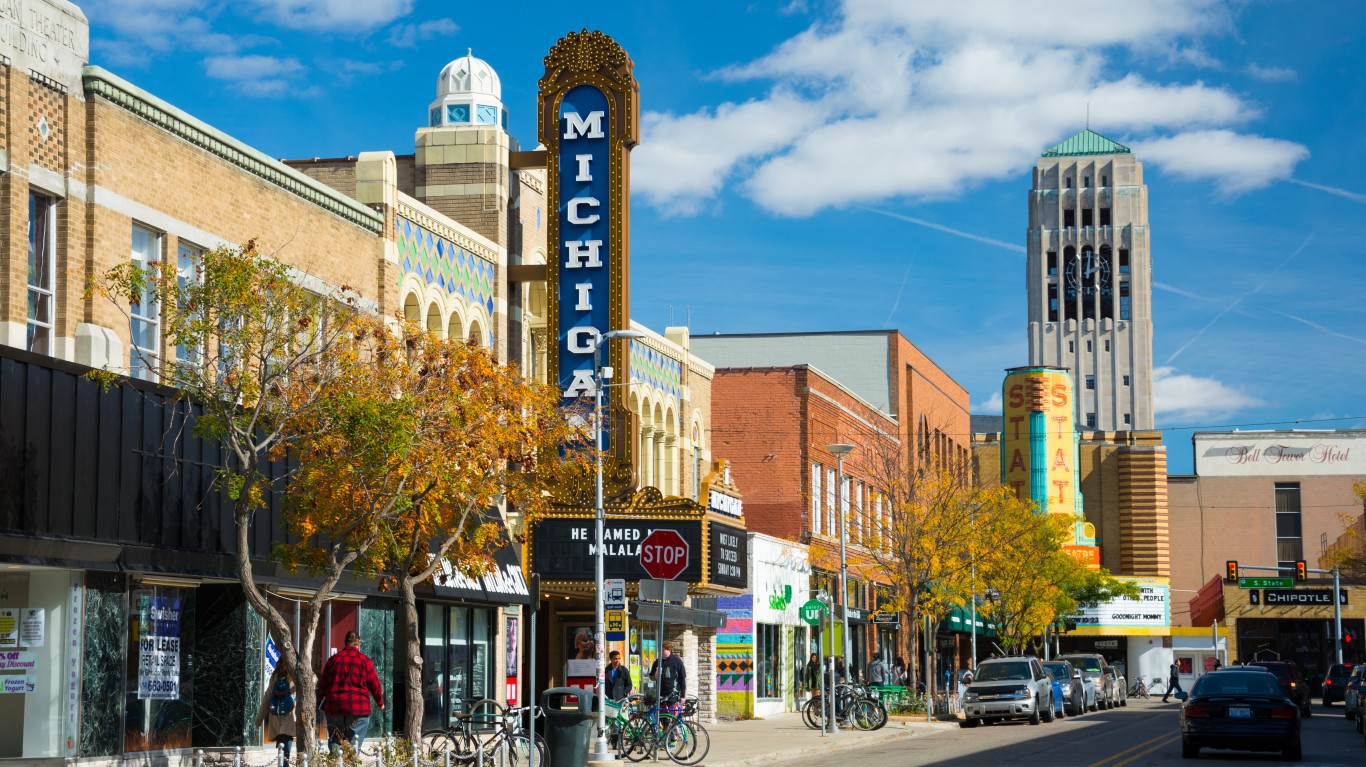
- Concentration of farmers markets: 8.2 per 100,000 residents
- Farmers market count: 10 listings
- Total population: 122,216
21. Atlanta, GA

- Concentration of farmers markets: 8.3 per 100,000 residents
- Farmers market count: 41 listings
- Total population: 494,838
20. Bowling Green, KY
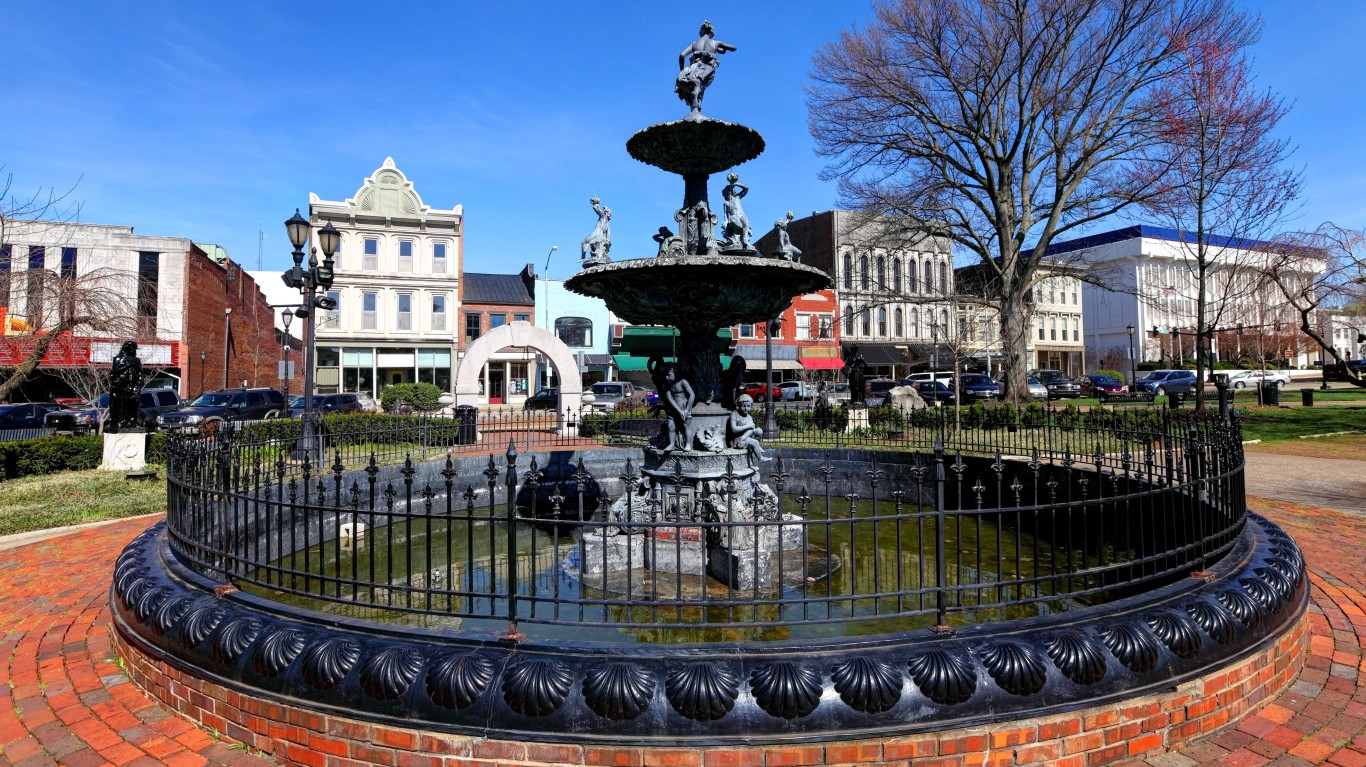
- Concentration of farmers markets: 8.3 per 100,000 residents
- Farmers market count: 6 listings
- Total population: 72,385
19. Richmond, VA

- Concentration of farmers markets: 8.4 per 100,000 residents
- Farmers market count: 19 listings
- Total population: 227,171
18. Bridgeport, CT

- Concentration of farmers markets: 8.8 per 100,000 residents
- Farmers market count: 13 listings
- Total population: 148,470
17. Worcester, MA
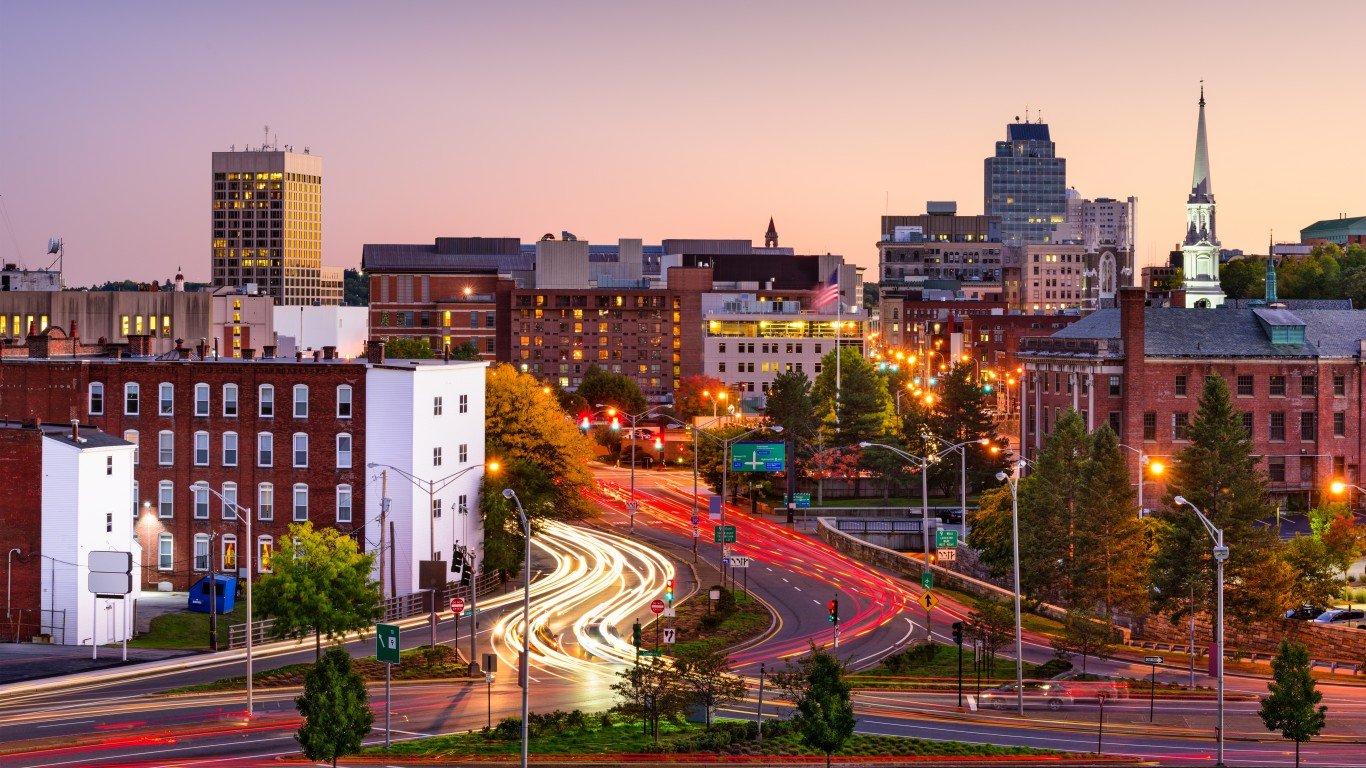
- Concentration of farmers markets: 8.8 per 100,000 residents
- Farmers market count: 18 listings
- Total population: 204,191
16. Providence, RI

- Concentration of farmers markets: 9.0 per 100,000 residents
- Farmers market count: 17 listings
- Total population: 189,715
15. Birmingham, AL
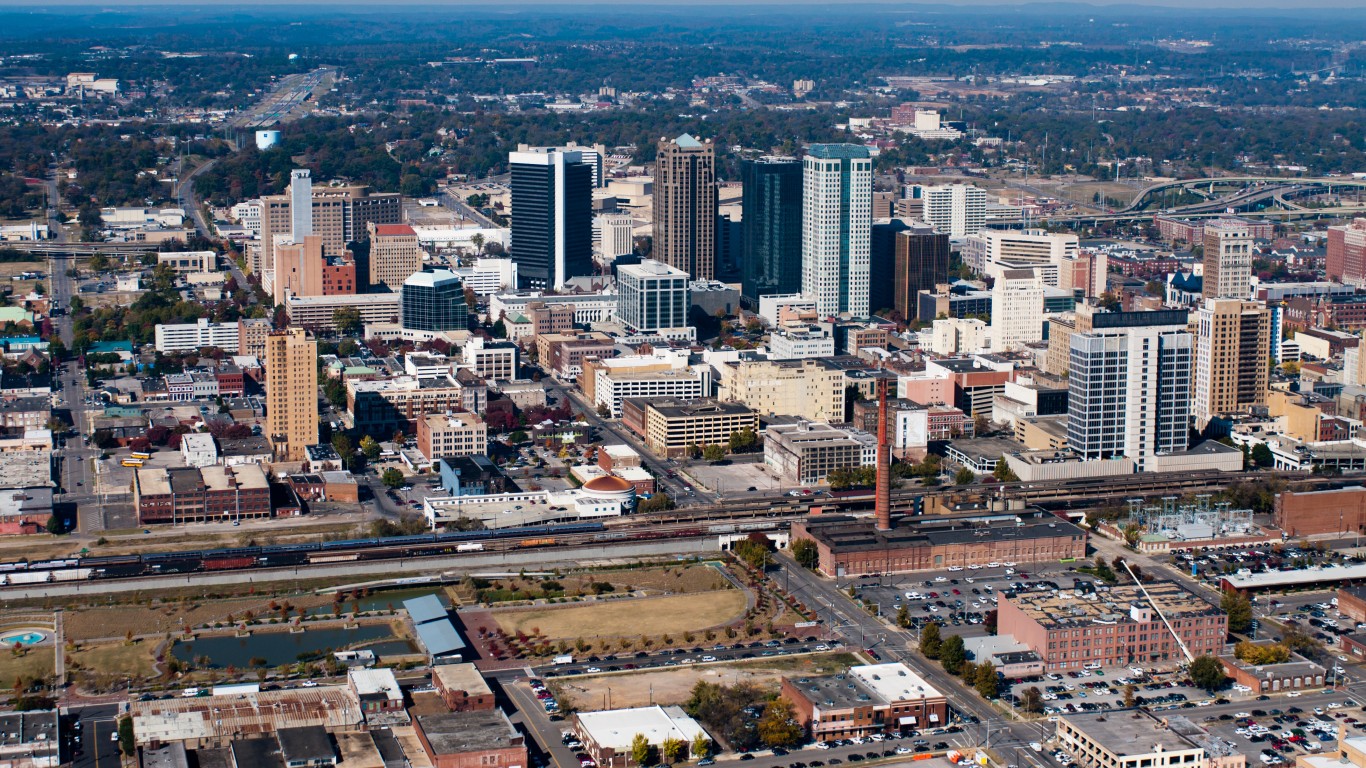
- Concentration of farmers markets: 9.0 per 100,000 residents
- Farmers market count: 18 listings
- Total population: 200,431
14. Roanoke, VA

- Concentration of farmers markets: 9.1 per 100,000 residents
- Farmers market count: 9 listings
- Total population: 99,213
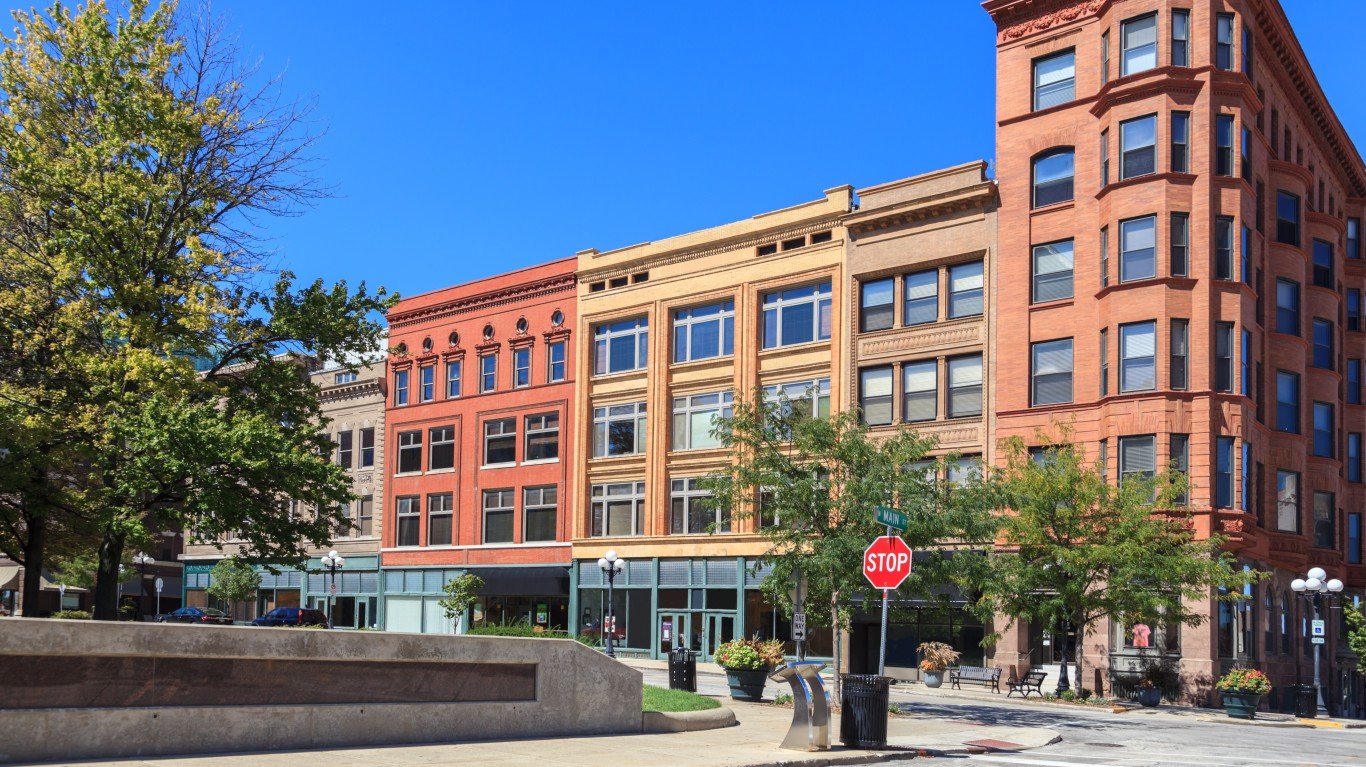
13. Waterloo, IA
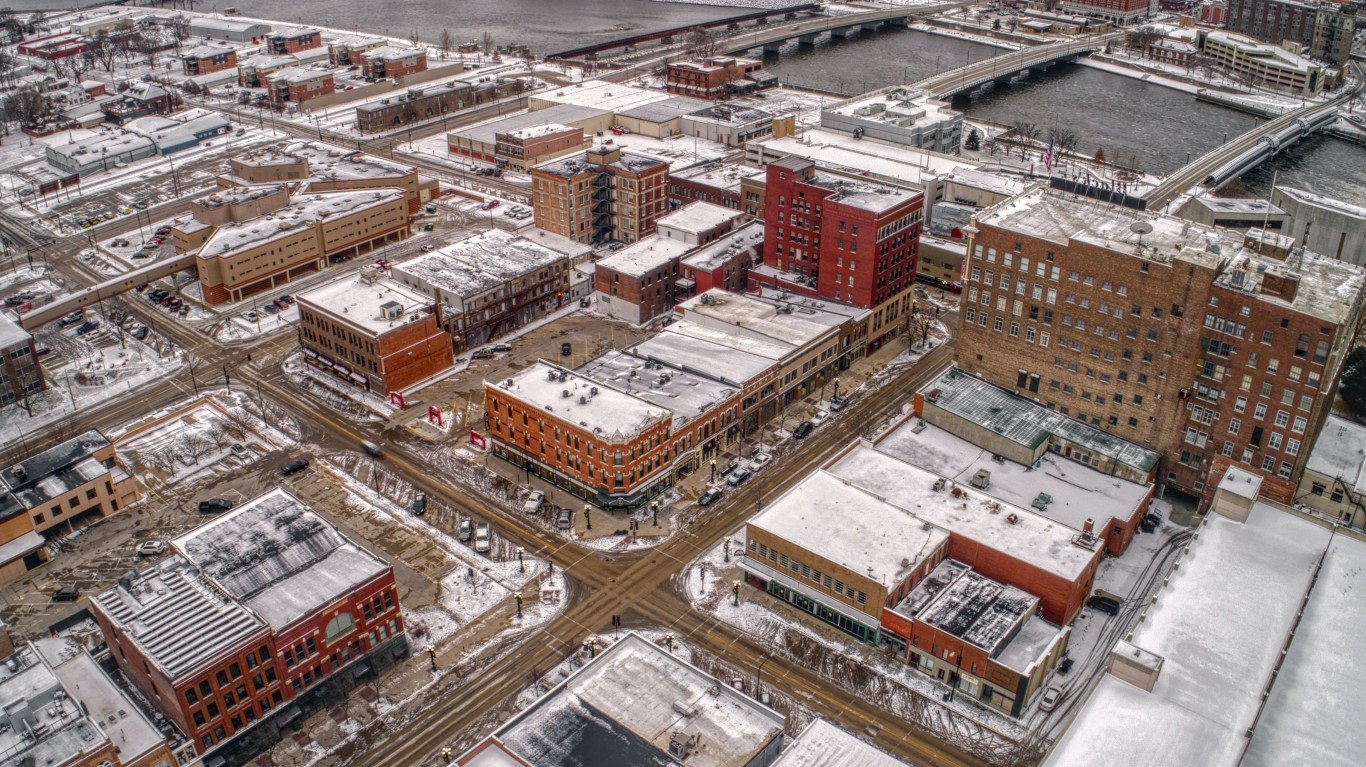
- Concentration of farmers markets: 10.4 per 100,000 residents
- Farmers market count: 7 listings
- Total population: 67,256
12. New Haven, CT

- Concentration of farmers markets: 11.1 per 100,000 residents
- Farmers market count: 15 listings
- Total population: 135,736
11. Kenosha, WI
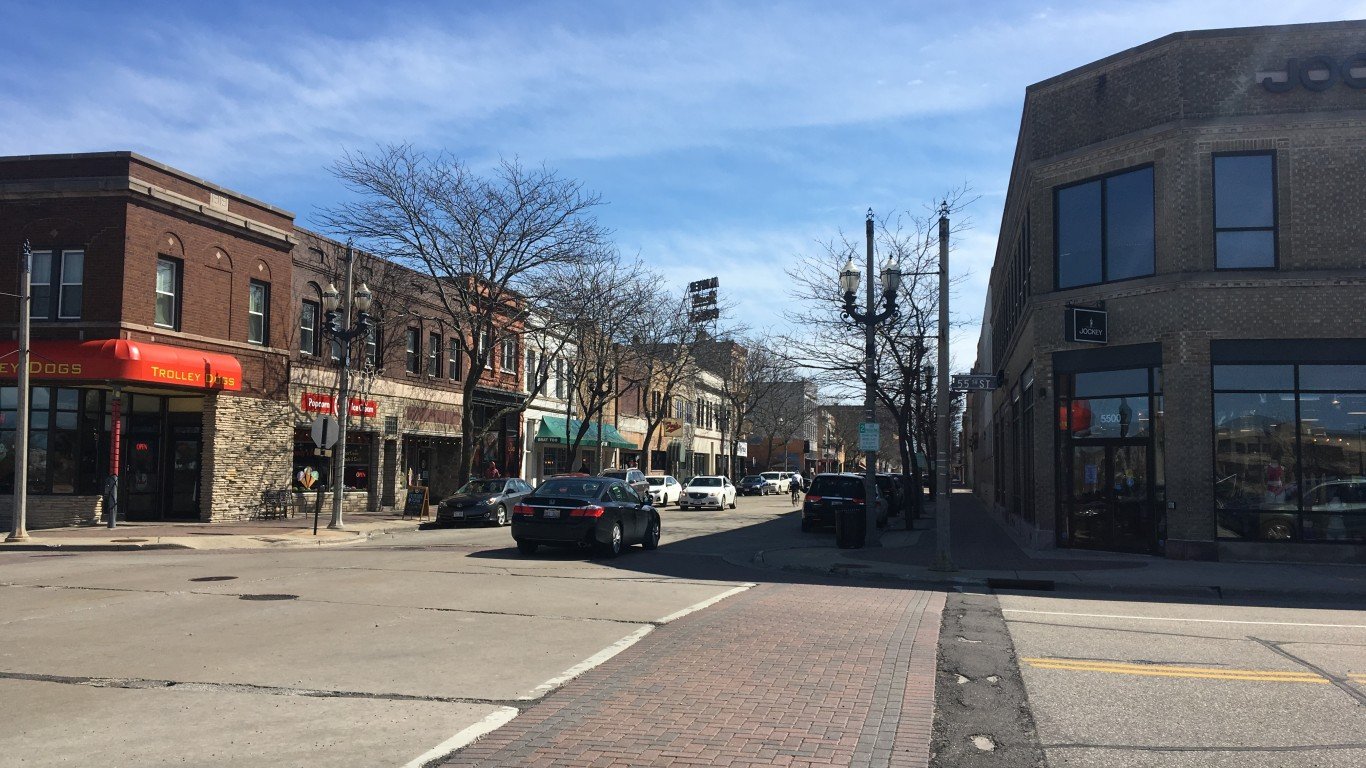
- Concentration of farmers markets: 11.1 per 100,000 residents
- Farmers market count: 11 listings
- Total population: 99,493
10. Hartford, CT

- Concentration of farmers markets: 11.6 per 100,000 residents
- Farmers market count: 14 listings
- Total population: 121,057
9. Minneapolis, MN

- Concentration of farmers markets: 11.7 per 100,000 residents
- Farmers market count: 50 listings
- Total population: 426,877
8. Casper, WY
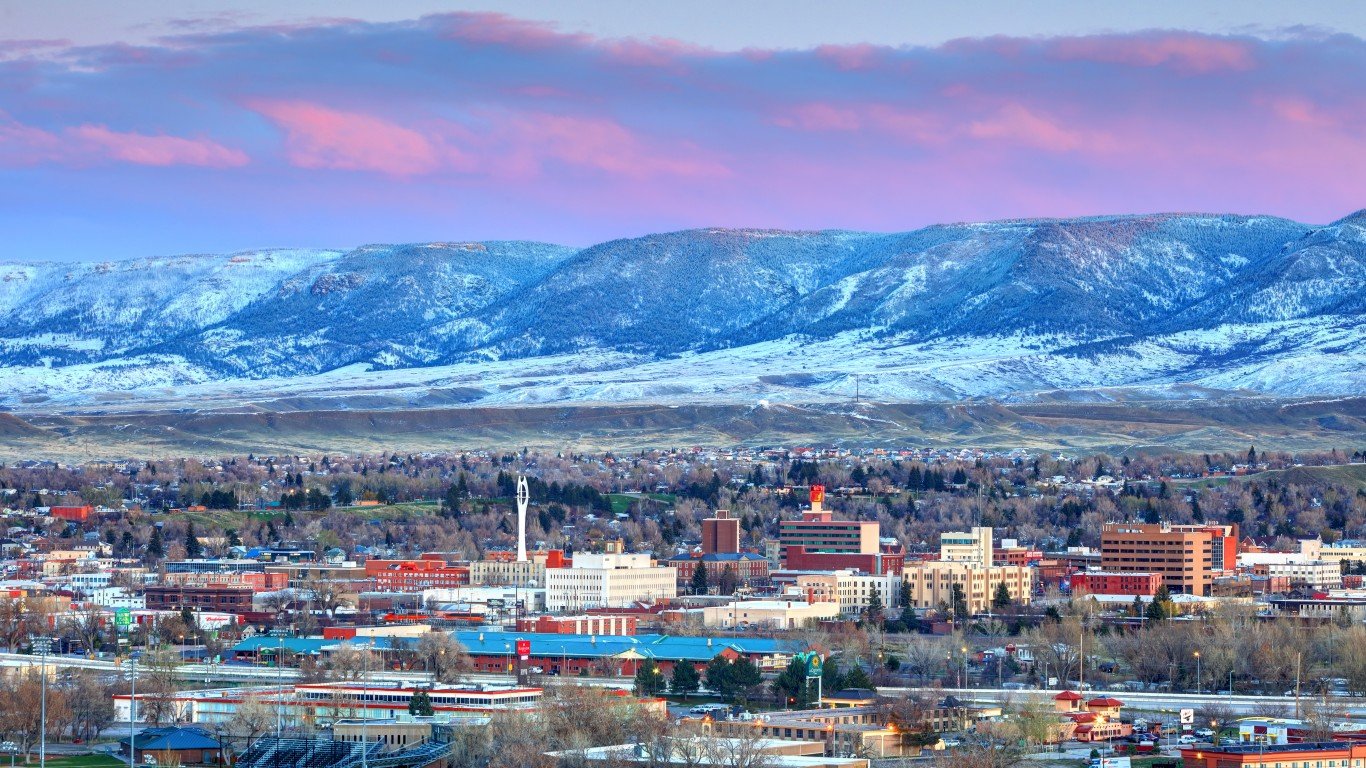
- Concentration of farmers markets: 11.9 per 100,000 residents
- Farmers market count: 7 listings
- Total population: 58,631
7. Appleton, WI

- Concentration of farmers markets: 12.0 per 100,000 residents
- Farmers market count: 9 listings
- Total population: 75,133
6. Columbia, SC
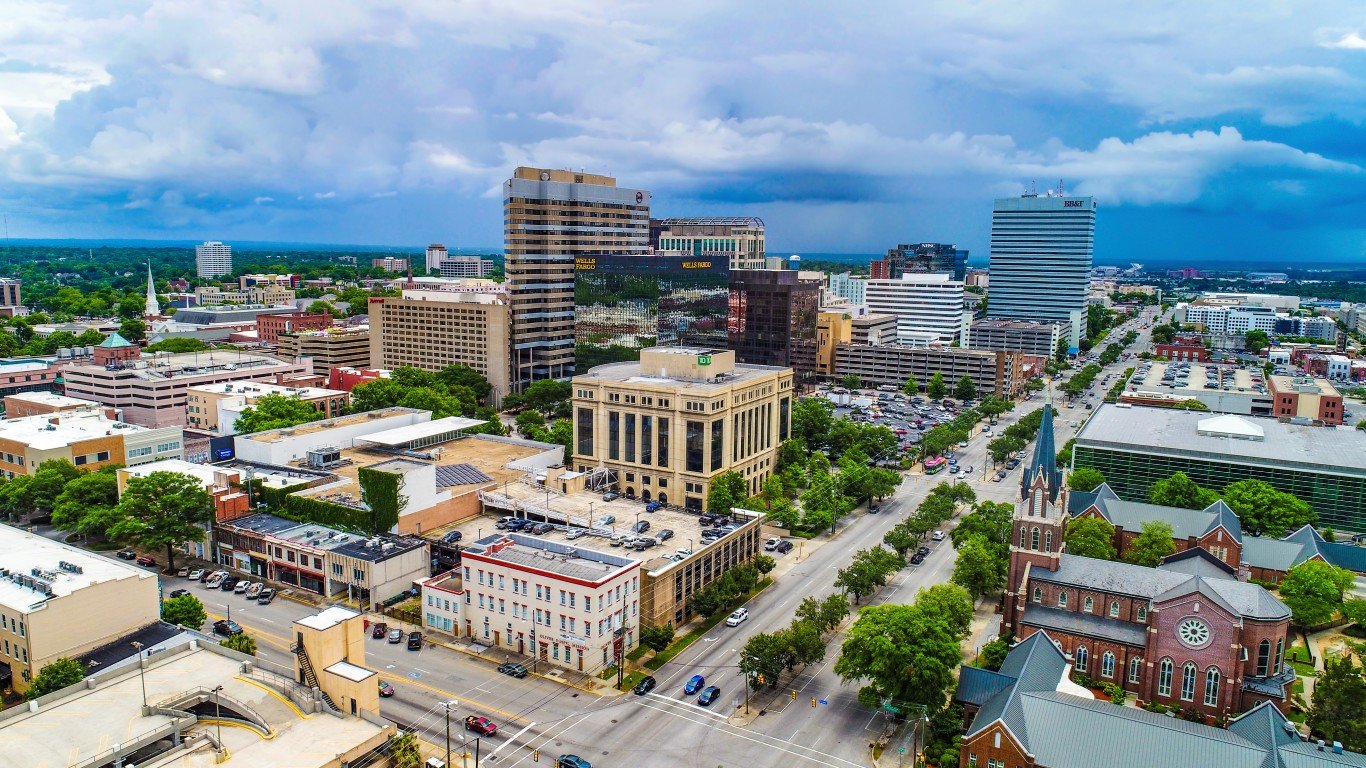
- Concentration of farmers markets: 13.2 per 100,000 residents
- Farmers market count: 18 listings
- Total population: 136,754
5. Lansing, MI

- Concentration of farmers markets: 13.3 per 100,000 residents
- Farmers market count: 15 listings
- Total population: 112,986
4. Duluth, MN

- Concentration of farmers markets: 13.8 per 100,000 residents
- Farmers market count: 12 listings
- Total population: 86,772
3. Washington, D.C.

- Concentration of farmers markets: 14.0 per 100,000 residents
- Farmers market count: 94 listings
- Total population: 670,587
2. Albany, NY

- Concentration of farmers markets: 15.0 per 100,000 residents
- Farmers market count: 15 listings
- Total population: 99,692
1. Harrisburg, PA

- Concentration of farmers markets: 18.0 per 100,000 residents
- Farmers market count: 9 listings
- Total population: 50,055