
According to the National Institute of Health, alcohol consumption, including high-risk drinking, in the United States has been on the rise for the last 10 years. This increase has been more notable in certain groups, among them women, low-income individuals, older adults, racial/ethnic minorities, and sexual minorities. While the amount of drinks consumed per week dropped slightly – from four to three per week – the numbers are still rather high. Perhaps too high.
Binge drinking remains an issue in America. According to the National Institute on Alcohol Abuse and Alcoholism, in a 2022 survey conducted by the National Survey on Drug Use and Health (NSDUH), almost 22% of Americans aged 12 and older claimed to binge drink. The parameters for what defines binge drinking differ as well. The definition may remain the same – a pattern of drinking that brings blood alcohol levels to 0,08 or greater – but for males, the rate is five beverages in two hours; for females, it is four.
To compile a list of each state’s most boozy urban hub, 24/7 Tempo reviewed the percentage of men and women over 18 who reported heavy or binge drinking in each state’s metropolitan areas and then singled out the city or urban area with the highest rate. Only one metro area was considered in Delaware, New Hampshire, Rhode Island, and Vermont. (These are the drunkest states in America.)
Metro-level data was aggregated from the 2023 County Health Rankings & Roadmaps, a Robert Wood Johnson Foundation and University of Wisconsin Population Health Institute joint program. County-level data on the number of alcohol-related Countywide driving deaths also came from the CHR.
Not only is excessive alcohol use responsible for more than 140,000 deaths in the United States each year, but binge drinking is also accountable for many fatalities. Excess alcoholic consumption imperils drivers and passengers in vehicles, and in 2021, 13,384 in the U.S. perished in alcohol-impaired driving traffic deaths. Drunk-driving crashes take the lives of about 37 people daily.
Excessive drinking also has the potential for serious health consequences. Studies have shown that it can be a factor in chronic conditions such as liver disease, cancer, heart disease, and hypertension. (See how deaths from alcohol-related cirrhosis have gone up almost every year since 2000.) Per the Centers for Disease Control and Prevention, one in six American adults binge drinks.
Interestingly, Ocean City, New Jersey made this list. Ocean City is a town that has prohibited alcohol sales and drinking in public since it was founded by Methodist ministers in 1879.
Alabama

- Drunkest metro area: Daphne-Fairhope-Foley; population – 246,435
- Adults who drink excessively: 19.0%
- Countywide driving deaths involving alcohol: 32.2%
Alaska
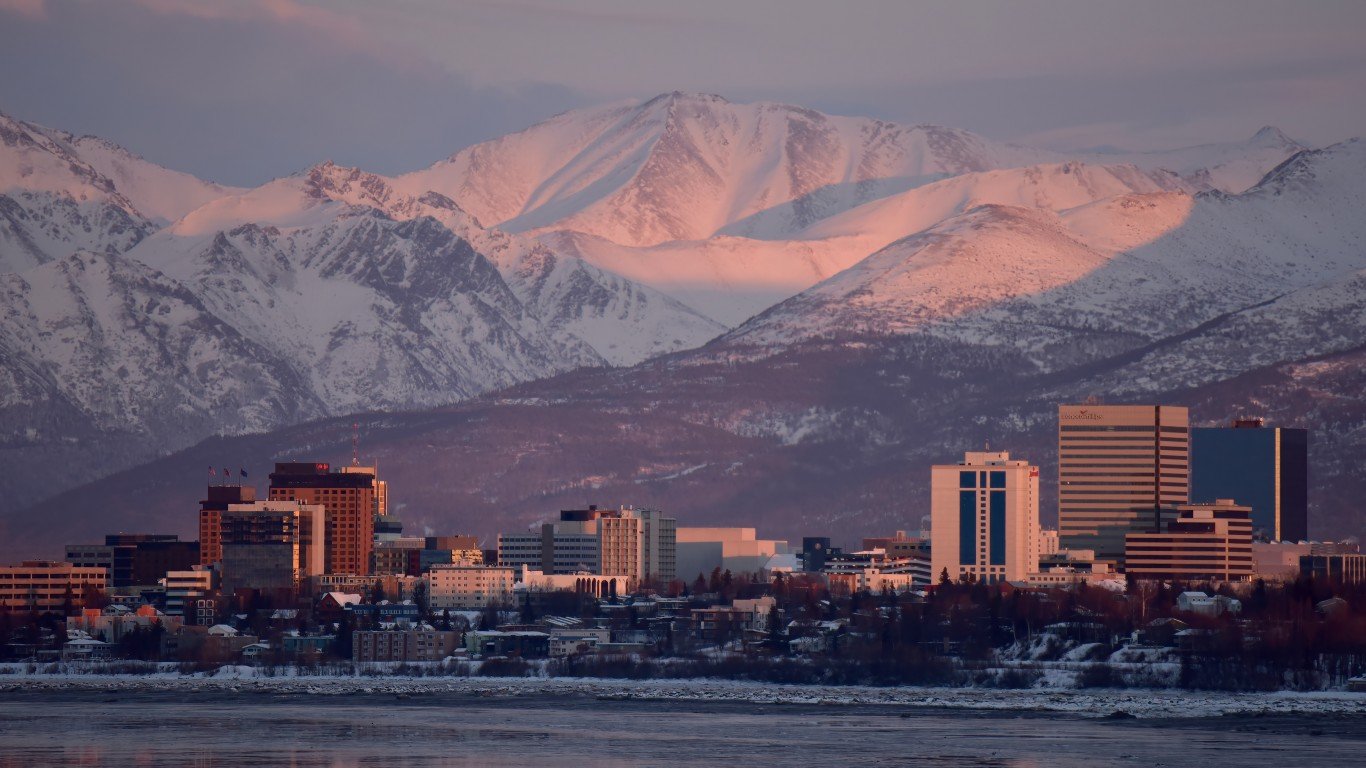
- Drunkest metro area: Anchorage; population – 400,470
- Adults who drink excessively: 21.6%
- Countywide driving deaths involving alcohol: 30.3%
Arizona

- Drunkest metro area: Lake Havasu City-Kingman; population – 220,816
- Adults who drink excessively: 22.3%
- Countywide driving deaths involving alcohol: 22.5%
Arkansas

- Drunkest metro area: Fayetteville-Springdale-Rogers; population – 576,724
- Adults who drink excessively: 18.0%
- Countywide driving deaths involving alcohol: 25.7%
California

- Drunkest metro area: Santa Rosa-Petaluma; population – 482,650
- Adults who drink excessively: 23.2%
- Countywide driving deaths involving alcohol: 32.8%
Colorado

- Drunkest metro area: Fort Collins; population – 366,778
- Adults who drink excessively: 22.2%
- Countywide driving deaths involving alcohol: 33.3%
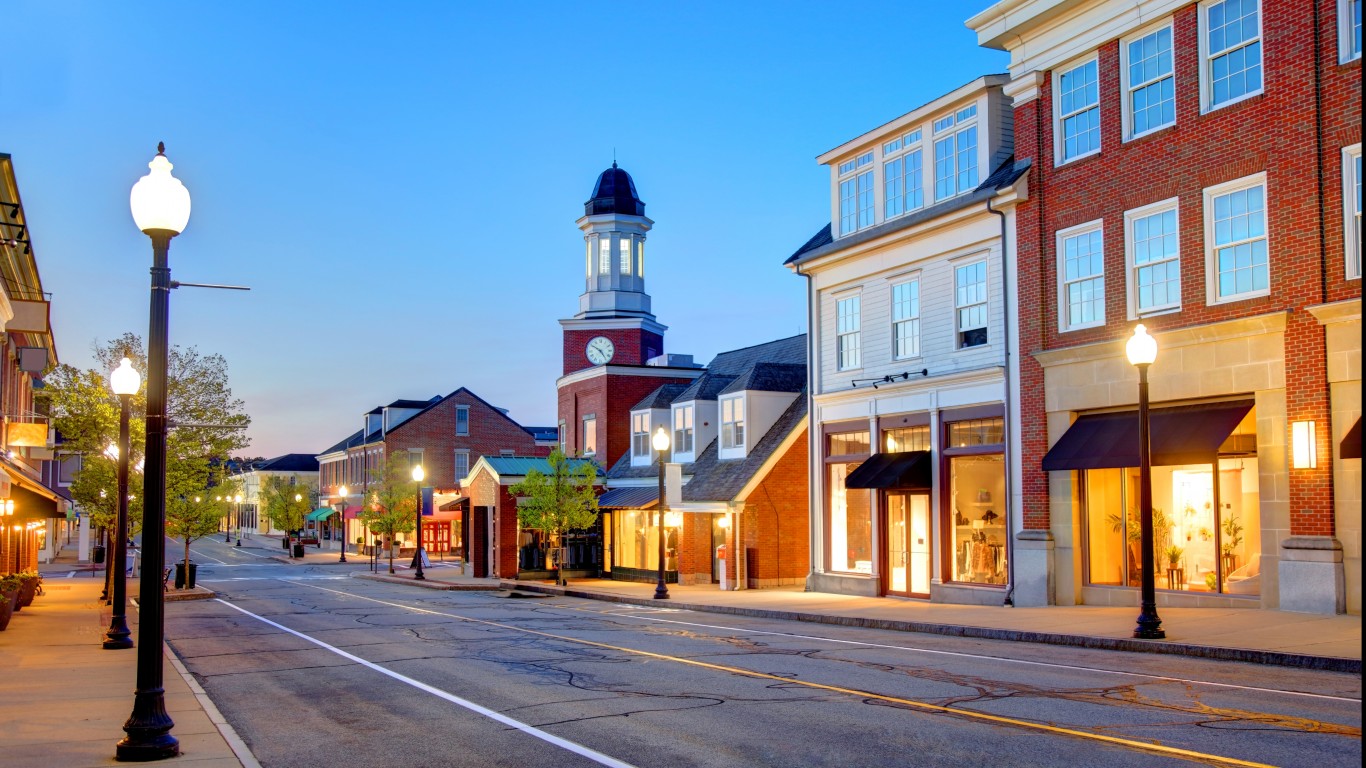
Connecticut

- Drunkest metro area: Norwich-New London; population – 269,902
- Adults who drink excessively: 20.8%
- Countywide driving deaths involving alcohol: 34.1%
Delaware

- Drunkest metro area: Dover; population – 186,946
- Adults who drink excessively: 16.1%
- Countywide driving deaths involving alcohol: 28.0%
Florida

- Drunkest metro area: Homosassa Springs; population – 162,529
- Adults who drink excessively: 21.6%
- Countywide driving deaths involving alcohol: 21.9%
Georgia

- Drunkest metro area: Gainesville; population – 212,692
- Adults who drink excessively: 17.5%
- Countywide driving deaths involving alcohol: 17.6%
Hawaii

- Drunkest metro area: Kahului-Wailuku-Lahaina; population – 164,365
- Adults who drink excessively: 21.5%
- Countywide driving deaths involving alcohol: 44.8%
Idaho

- Drunkest metro area: Lewiston; population – 65,512
- Adults who drink excessively: 20.3%
- Countywide driving deaths involving alcohol: 28.2%
Illinois
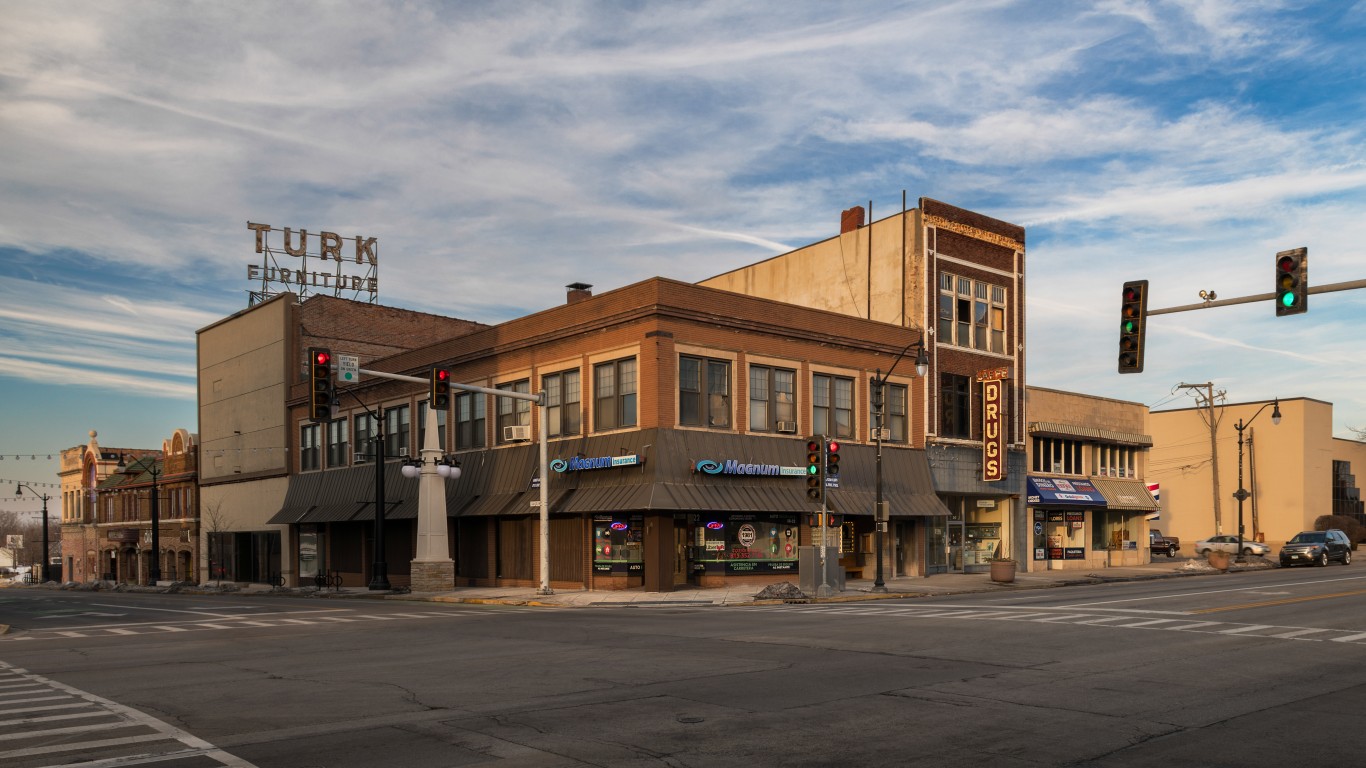
- Drunkest metro area: Kankakee; population – 106,074
- Adults who drink excessively: 17.2%
- Countywide driving deaths involving alcohol: 40.0%
Indiana

- Drunkest metro area: Bloomington; population – 161, 227
- Adults who drink excessively: 19.4%
- Countywide driving deaths involving alcohol: 12.3%
Iowa
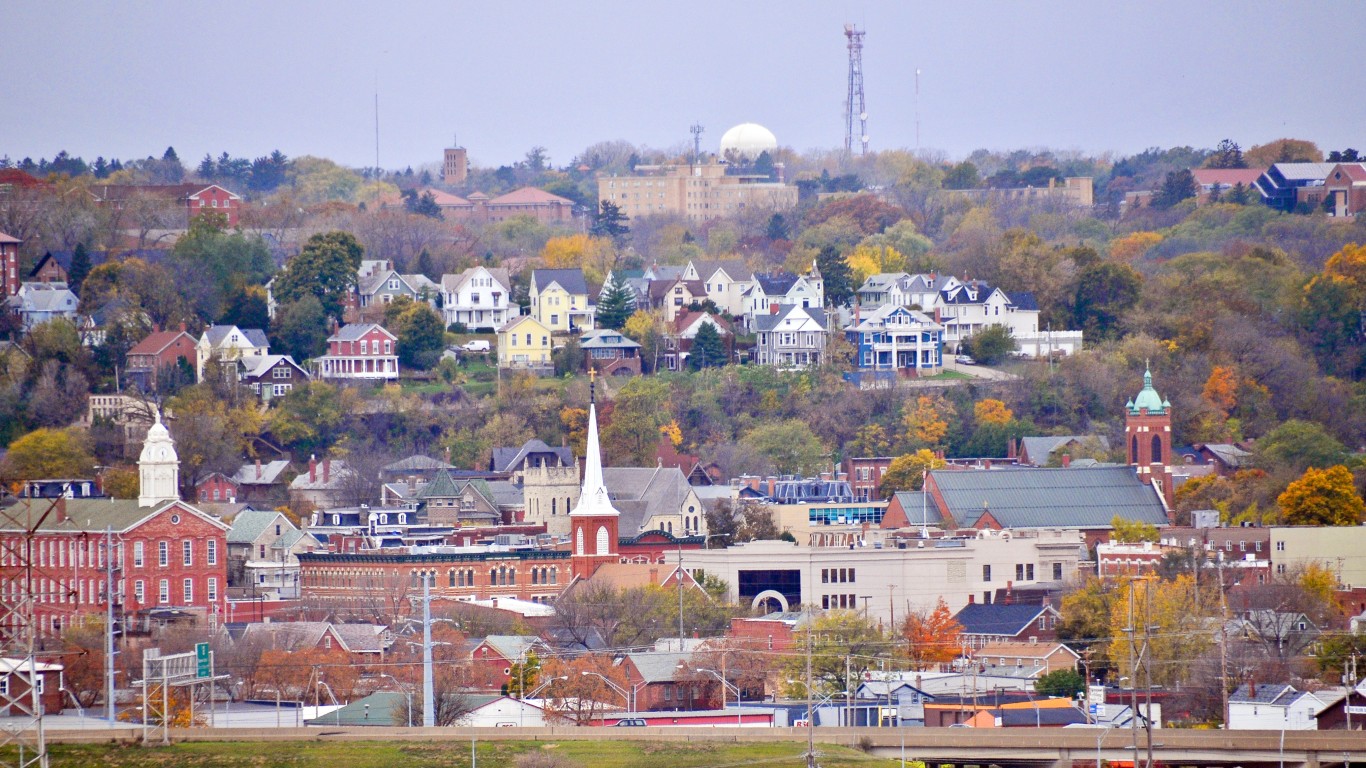
- Drunkest metro area: Dubuque; population – 98,677
- Adults who drink excessively: 27.4%
- Countywide driving deaths involving alcohol: 19.4%
Kansas
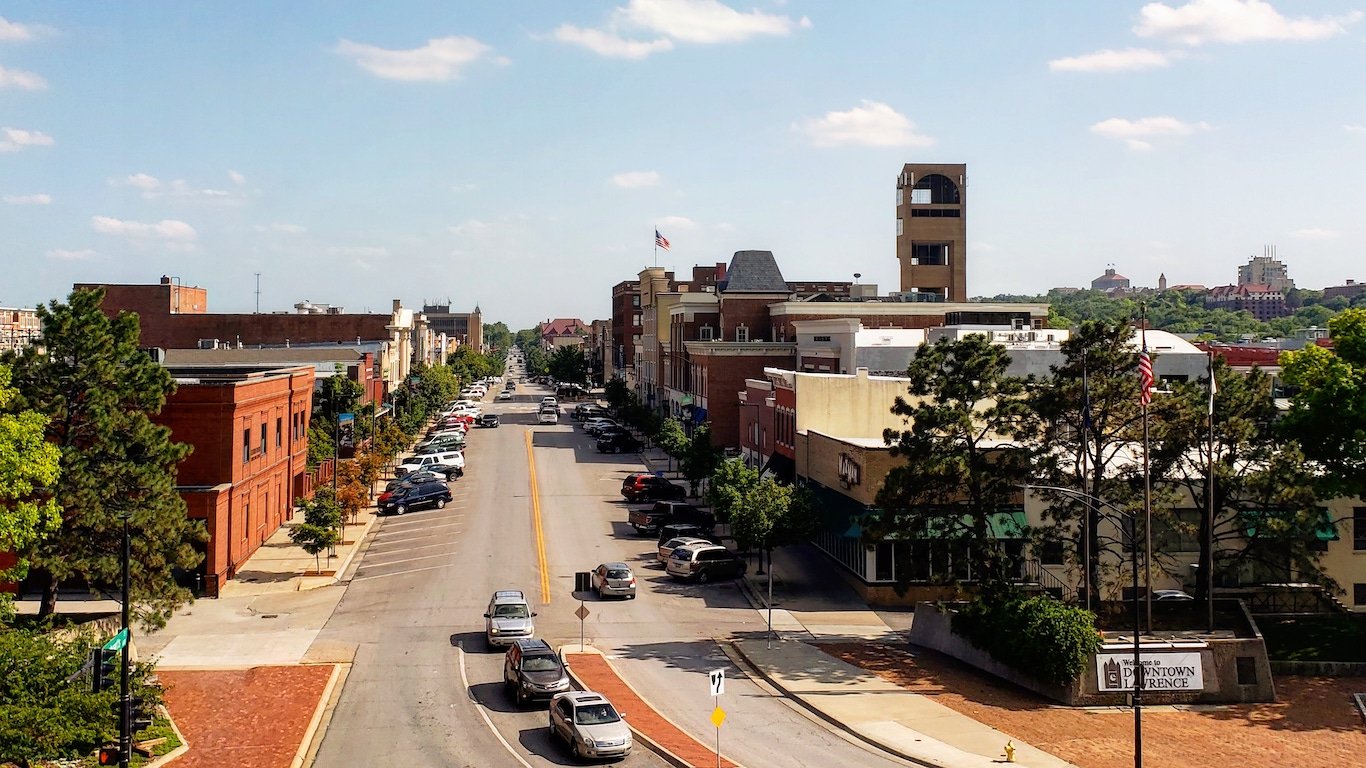
- Drunkest metro area: Lawrence; population – 119,964
- Adults who drink excessively: 20.6%
- Countywide driving deaths involving alcohol: 33.3%
Kentucky

- Drunkest metro area: Louisville/Jefferson County; population – 1,285,426
- Adults who drink excessively: 18.1%
- Countywide driving deaths involving alcohol: 24.4%
Louisiana
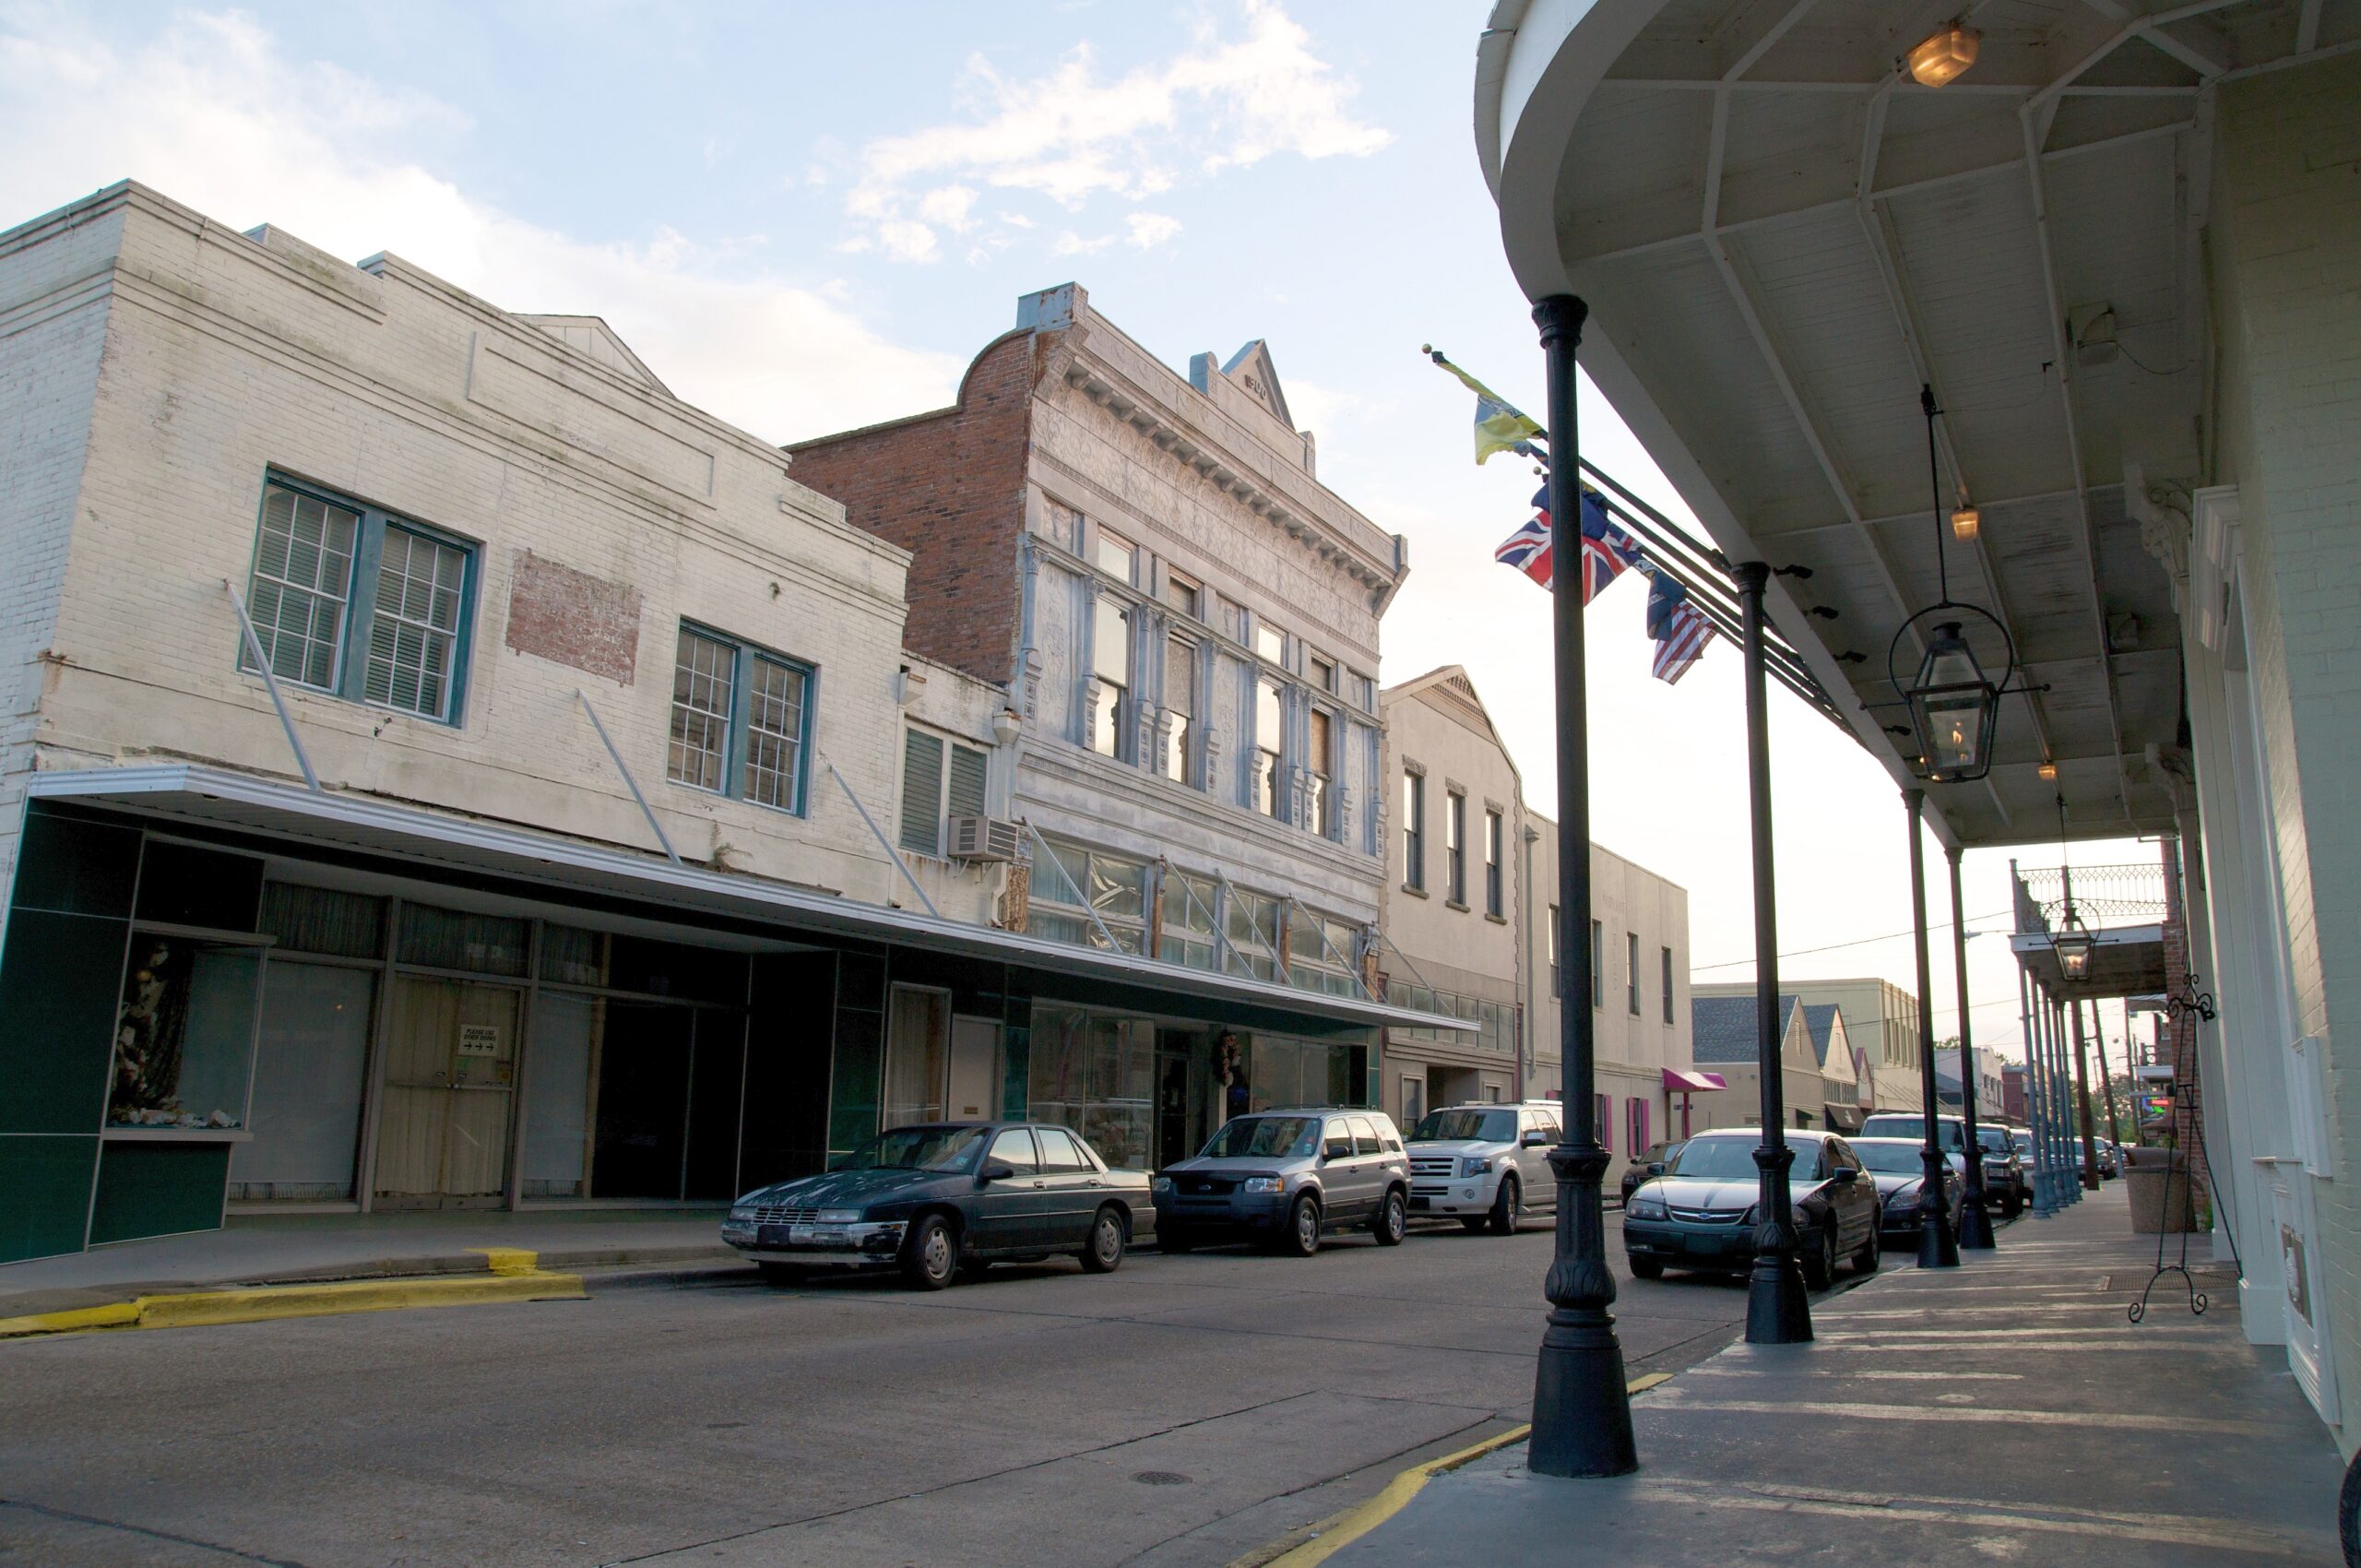
- Drunkest metro area: Houma-Thibodaux; population – 200,656
- Adults who drink excessively: 22.7%
- Countywide driving deaths involving alcohol: 37.0%
Maine

- Drunkest metro area: Portland-South Portland; population – 561,576
- Adults who drink excessively: 20.3%
- Countywide driving deaths involving alcohol: 28.2%
Maryland

- Drunkest metro area: Baltimore-Columbia-Towson; population – 2,832,672
- Adults who drink excessively: 17.1%
- Countywide driving deaths involving alcohol: 25.8%
Massachusetts
- Drunkest metro area: Barnstable Town; population – 232,457
- Adults who drink excessively: 24.2%
- Countywide driving deaths involving alcohol: 38.8%
Michigan

- Drunkest metro area: Bay City; population – 102,821
- Adults who drink excessively: 23.8%
- Countywide driving deaths involving alcohol: 28.3%
Minnesota
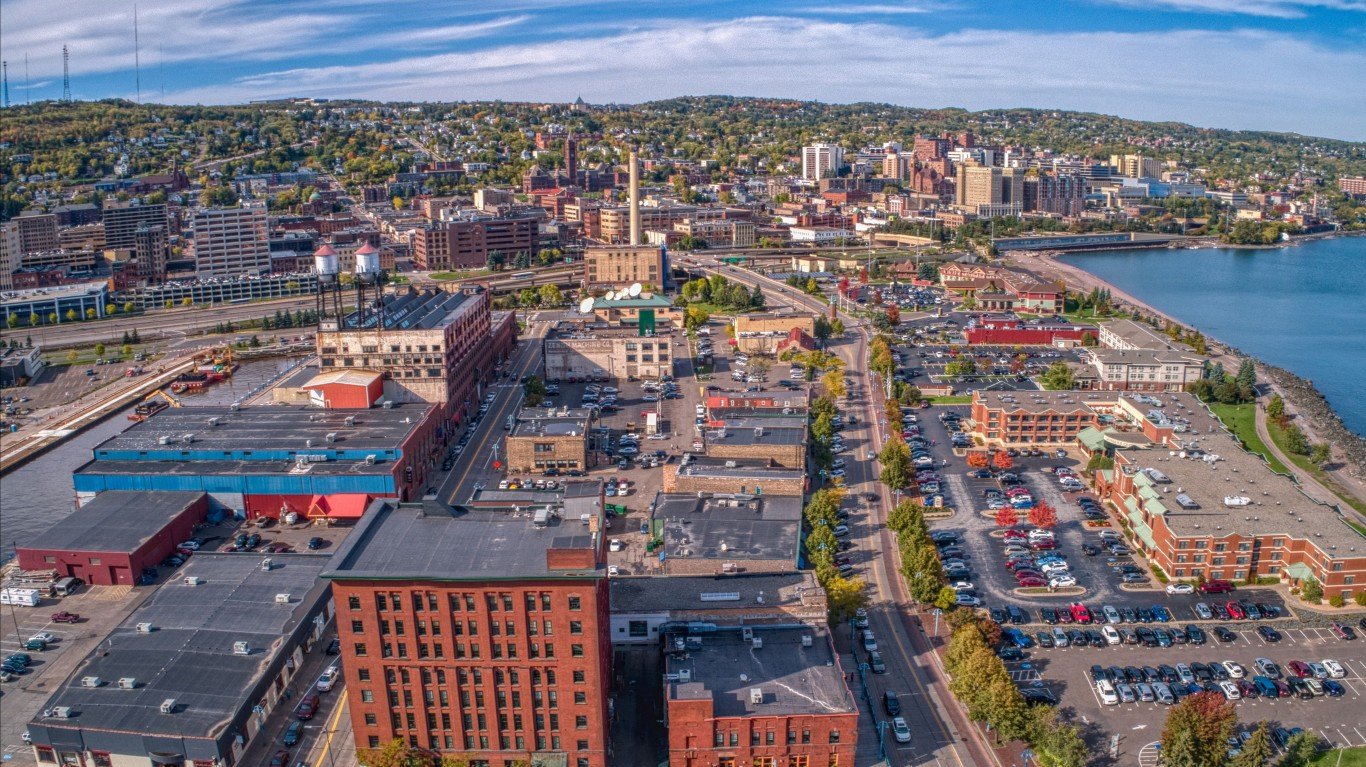
- Drunkest metro area: Duluth; population – 291,931
- Adults who drink excessively: 24.2%
- Countywide driving deaths involving alcohol: 38.2%
Mississippi

- Drunkest metro area: Gulfport-Biloxi; population – 420,782
- Adults who drink excessively: 18.3%
- Countywide driving deaths involving alcohol: 21.1%
Missouri

- Drunkest metro area: Cape Girardeau; population – 95,449
- Adults who drink excessively: 20.8%
- Countywide driving deaths involving alcohol: 23.6%
Montana

- Drunkest metro area: Missoula; population – 121,041
- Adults who drink excessively: 24.9%
- Countywide driving deaths involving alcohol: 34.3%
Nebraska

- Drunkest metro area: Lincoln; population – 341,229
- Adults who drink excessively: 24.1%
- Countywide driving deaths involving alcohol: 33.9%
Nevada

- Drunkest metro area: Reno; population – 501,206
- Adults who drink excessively: 22.6%
- Countywide driving deaths involving alcohol: 37.1%
New Hampshire

- Drunkest metro area: Manchester-Nashua; population – 426,594
- Adults who drink excessively: 20.7%
- Countywide driving deaths involving alcohol: 33.6%
New Jersey
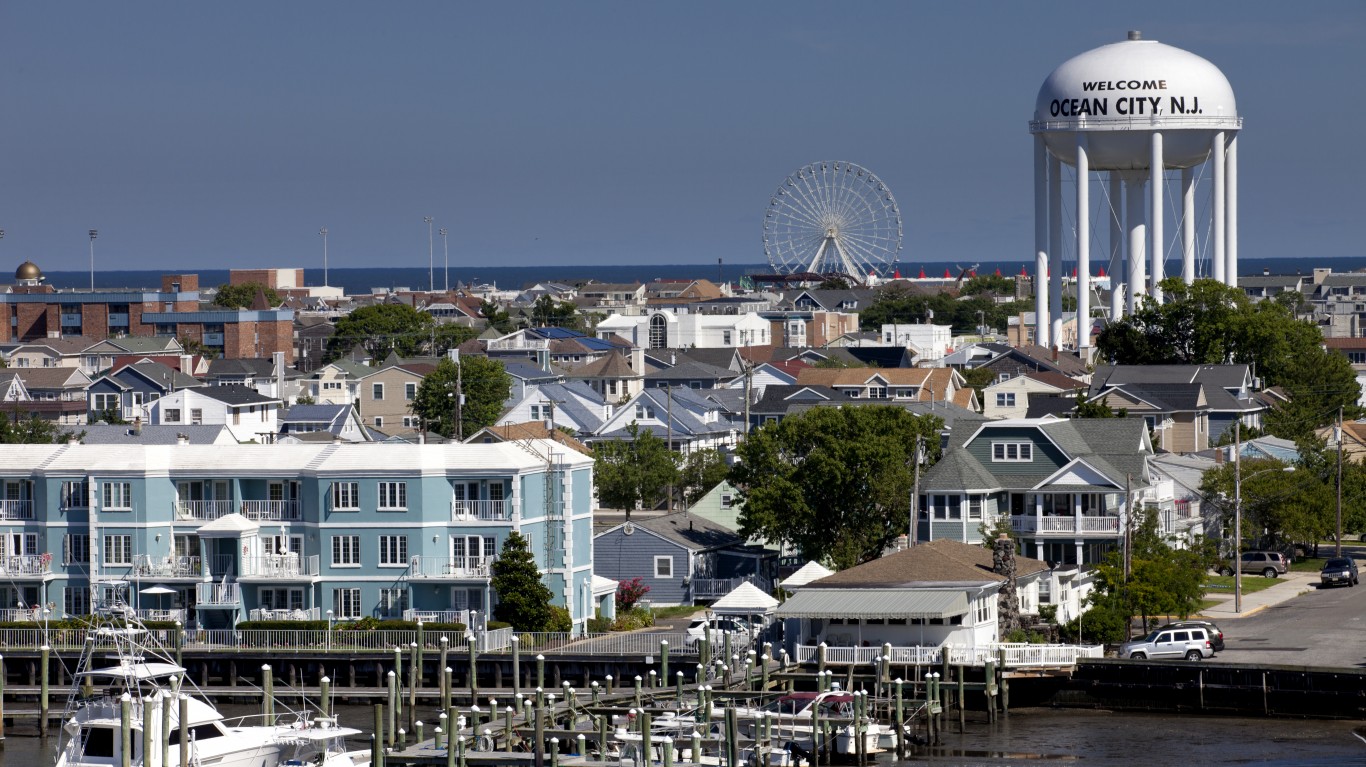
- Drunkest metro area: Ocean City; population – 95,634
- Adults who drink excessively: 23.3%
- Countywide driving deaths involving alcohol: 31.7%
New Mexico
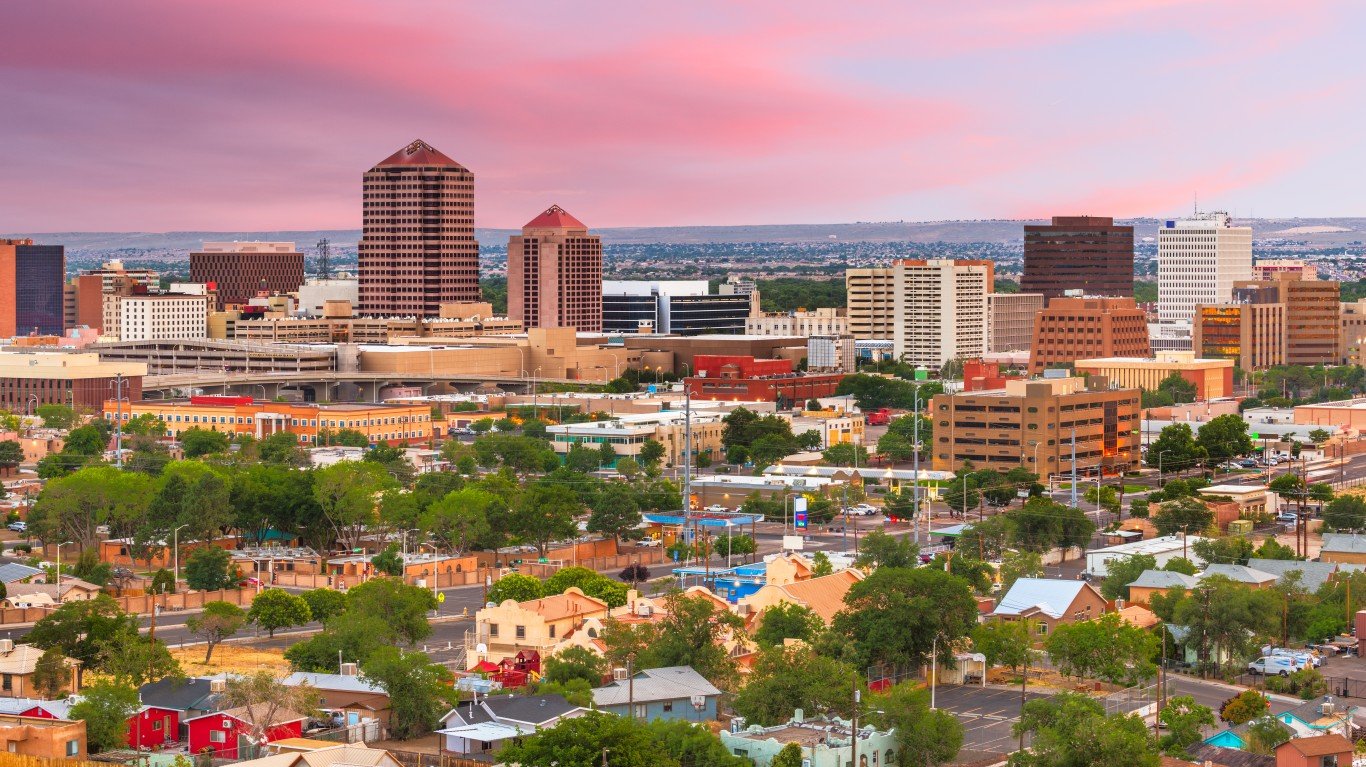
- Drunkest metro area: Albuquerque; population – 923,925
- Adults who drink excessively: 17.0%
- Countywide driving deaths involving alcohol: 27.1%
New York
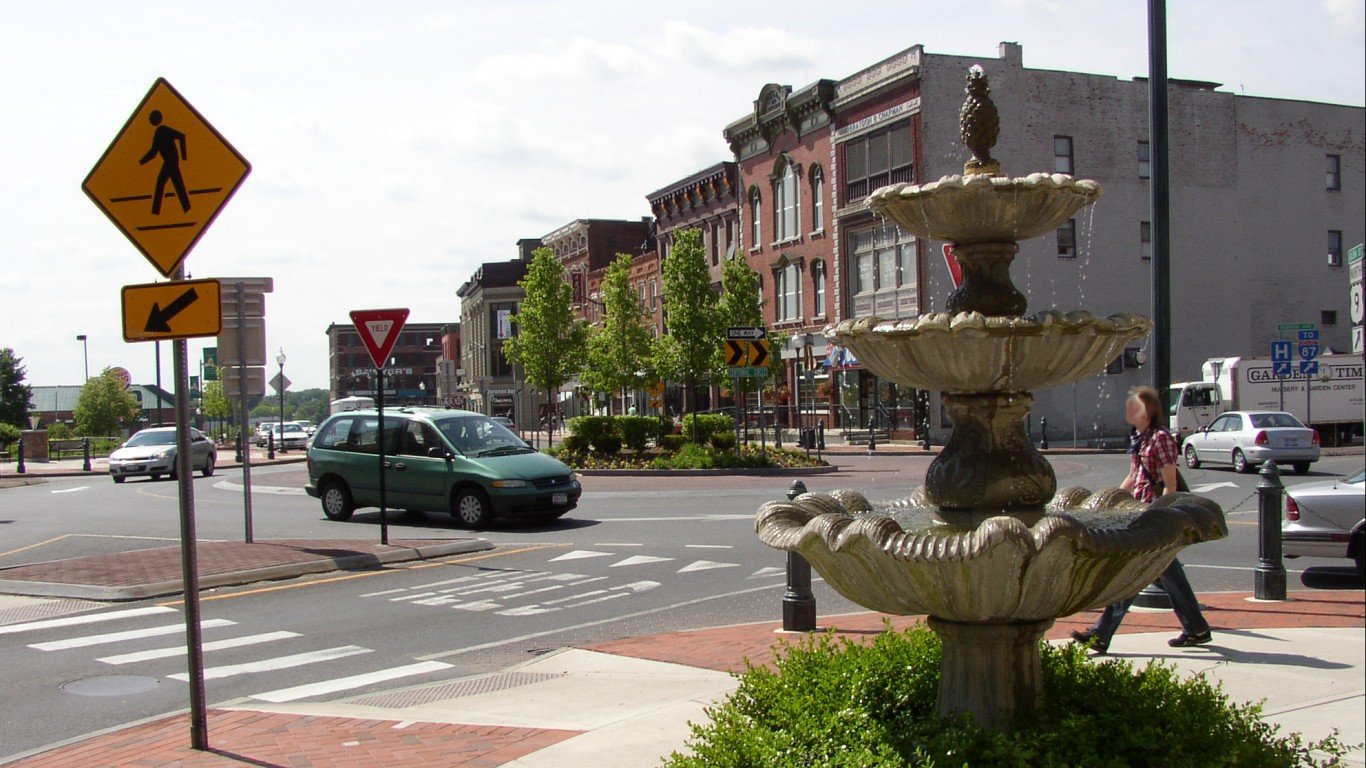
- Drunkest metro area: Glens Falls; population – 126,440
- Adults who drink excessively: 22.3%
- Countywide driving deaths involving alcohol: 19.6%
North Carolina
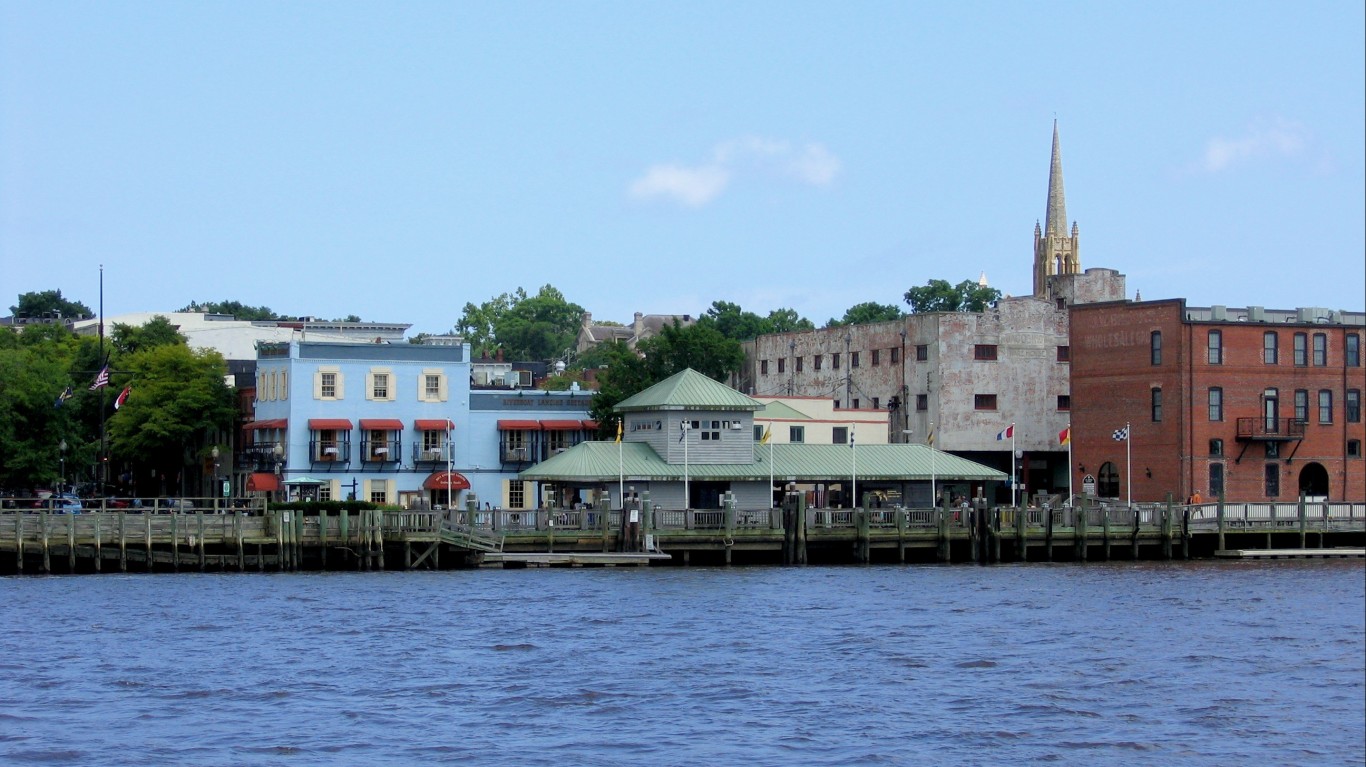
- Drunkest metro area: Wilmington; population – 300,658
- Adults who drink excessively: 20.3%
- Countywide driving deaths involving alcohol: 24.1%
North Dakota
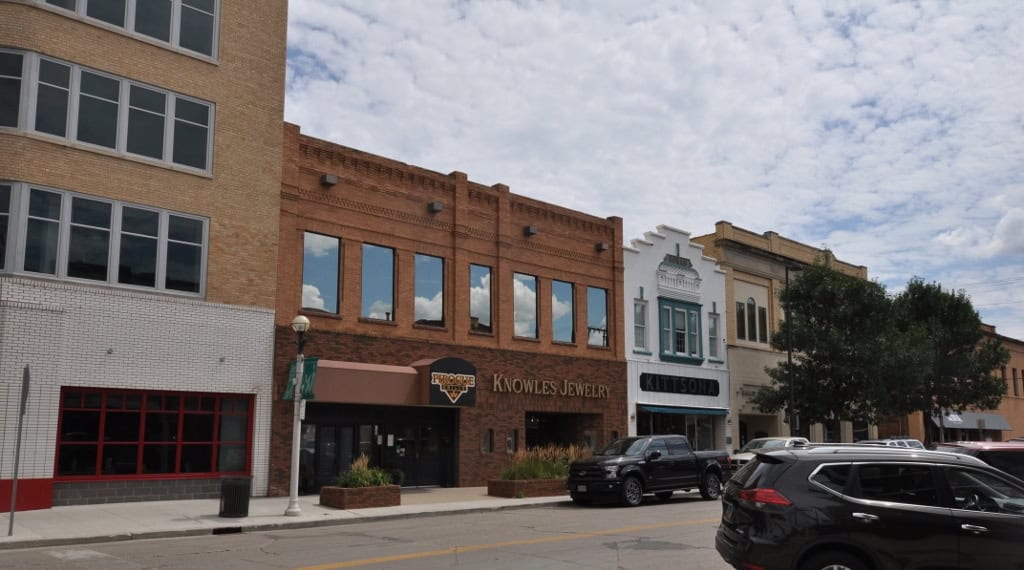
- Drunkest metro area: Bismarck; population – 134,427
- Adults who drink excessively: 23.1%
- Countywide driving deaths involving alcohol: 40.4%
Ohio

- Drunkest metro area: Columbus; population – 2,161,511
- Adults who drink excessively: 20.5%
- Countywide driving deaths involving alcohol: 32.0%
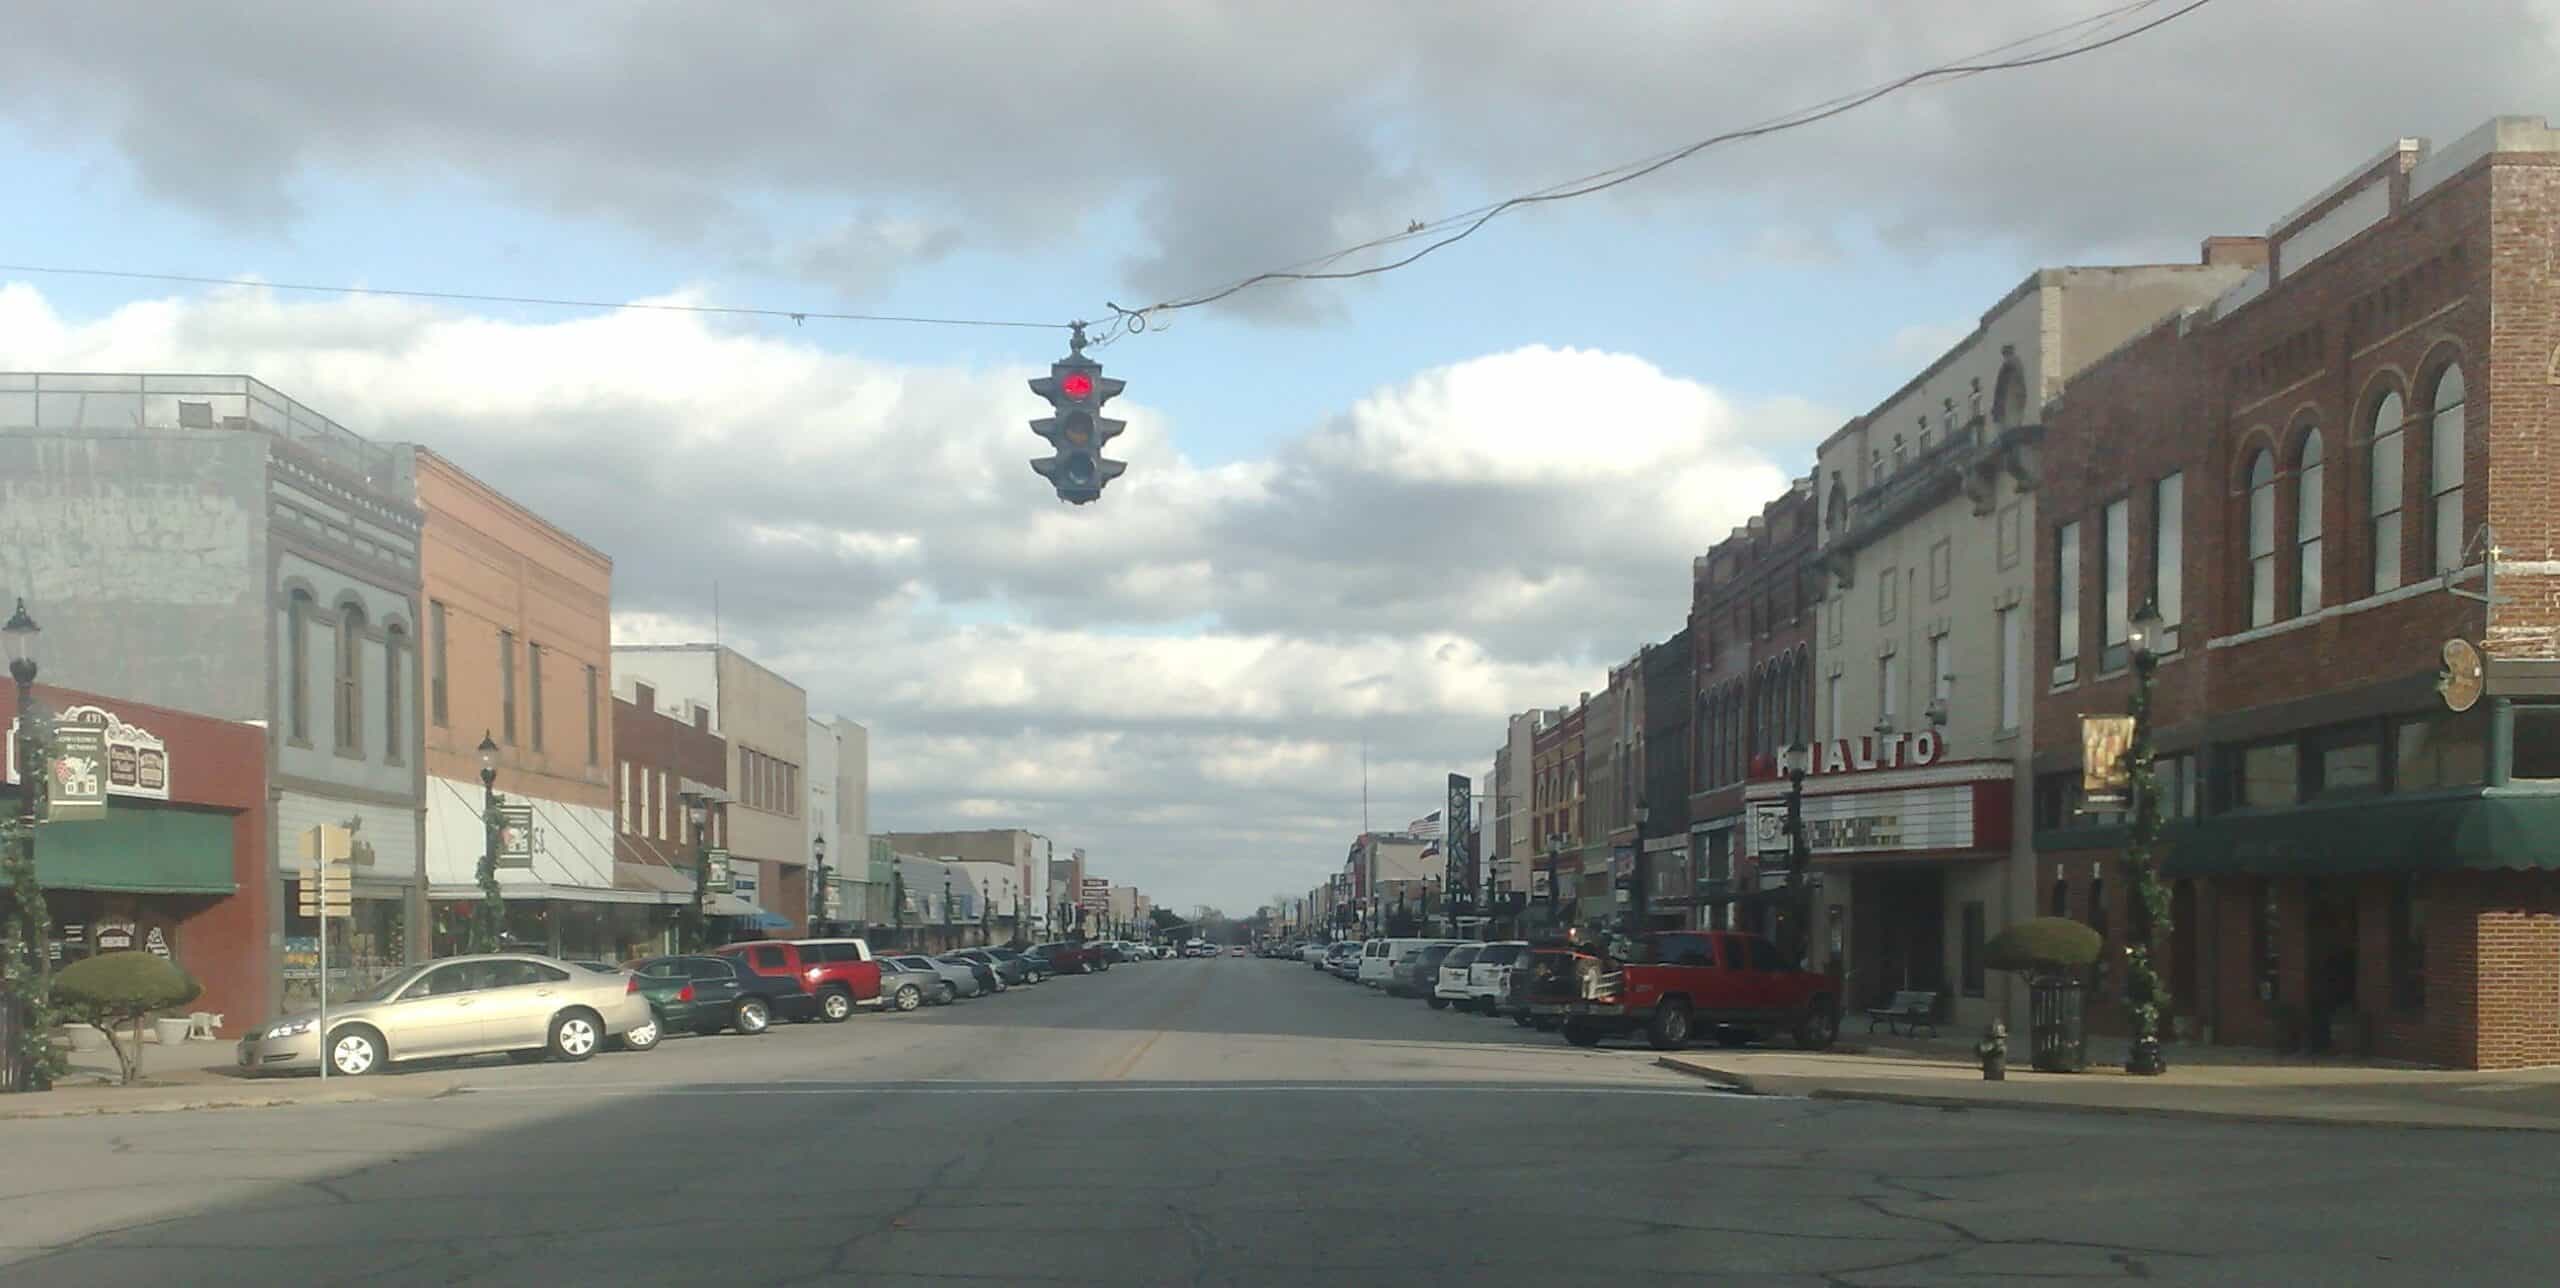
Oklahoma
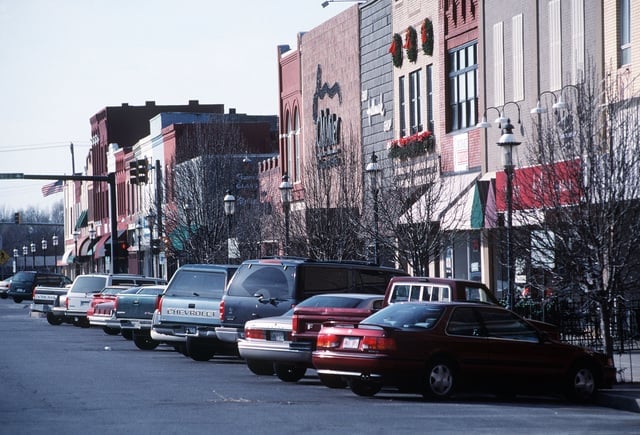
- Drunkest metro area: Enid; population – 61,920
- Adults who drink excessively: 15.2%
- Countywide driving deaths involving alcohol: 30.3%
Oregon

- Drunkest metro area: Bend; population – 206,549
- Adults who drink excessively: 22.6%
- Countywide driving deaths involving alcohol: 27.0%
Pennsylvania

- Drunkest metro area: Pittsburgh; population – 2,349,172
- Adults who drink excessively: 23.0%
- Countywide driving deaths involving alcohol: 28.4%
Rhode Island

- Drunkest metro area: Providence-Warwick; population – 1,673,802
- Adults who drink excessively: 20.0%
- Countywide driving deaths involving alcohol: 36.2%
South Carolina

- Drunkest metro area: Charleston-North Charleston; population – 830,529
- Adults who drink excessively: 21.8%
- Countywide driving deaths involving alcohol: 34.4%
South Dakota

- Drunkest metro area: Rapid City; population – 144,890
- Adults who drink excessively: 21.1%
- Countywide driving deaths involving alcohol: 39.0%
Tennessee

- Drunkest metro area: Nashville-Davidson-Murfreesboro-Franklin; population – 2,046,715
- Adults who drink excessively: 17.3%
- Countywide driving deaths involving alcohol: 24.3%
Texas
- Drunkest metro area: Sherman-Denison; population – 143,131
- Adults who drink excessively: 21.1%
- Countywide driving deaths involving alcohol: 23.6%
Utah

- Drunkest metro area: Salt Lake City; population – 1,266,191
- Adults who drink excessively: 14.0%
- Countywide driving deaths involving alcohol: 27.0%
Vermont

Church Street Marketplace (Burlington, Vermont)
- Drunkest metro area: Burlington-South Burlington; population – 228,270
- Adults who drink excessively: 20.7%
- Countywide driving deaths involving alcohol: 35.3%
Virginia

- Drunkest metro area: Staunton; population – 126,776
- Adults who drink excessively: 18.9%
- Countywide driving deaths involving alcohol: 30.1%
Washington
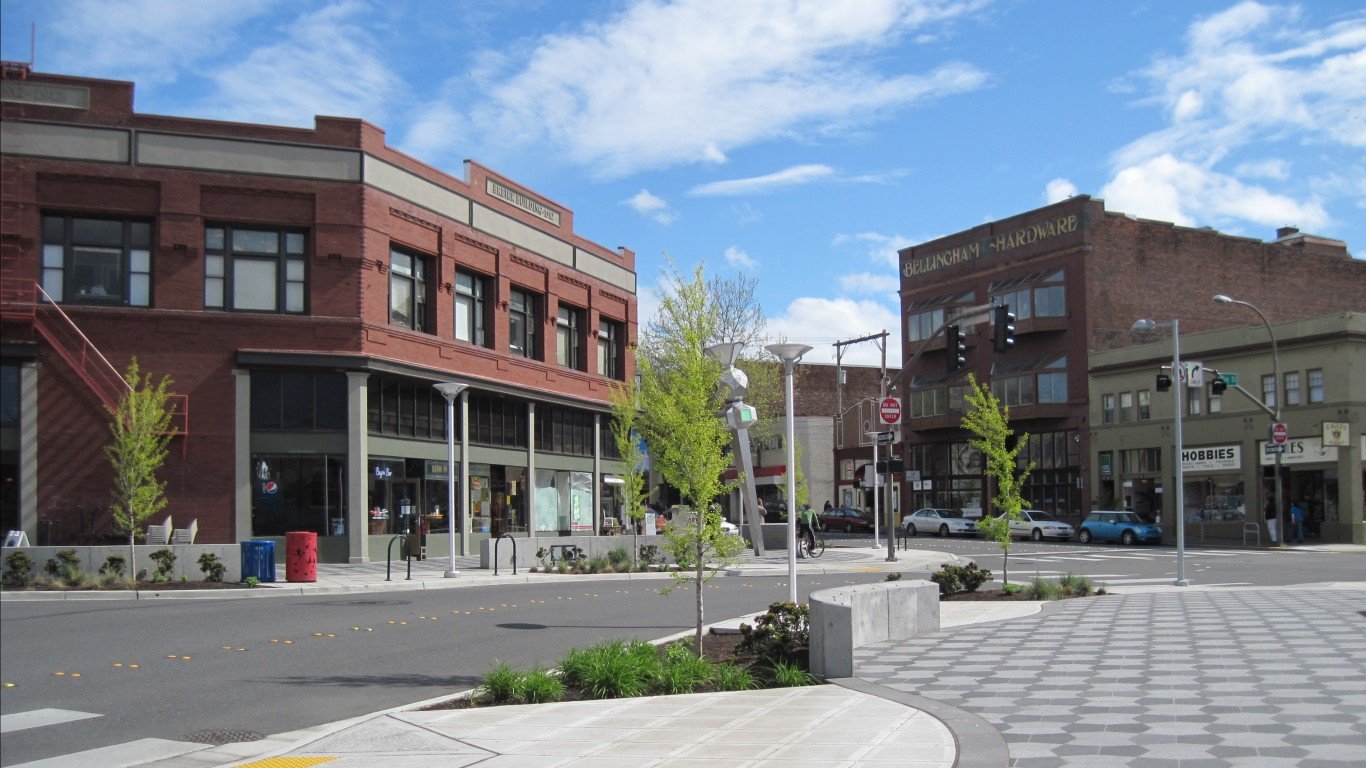
- Drunkest metro area: Bellingham; population – 230,677
- Adults who drink excessively: 22.9%
- Countywide driving deaths involving alcohol: 24.7%
West Virginia
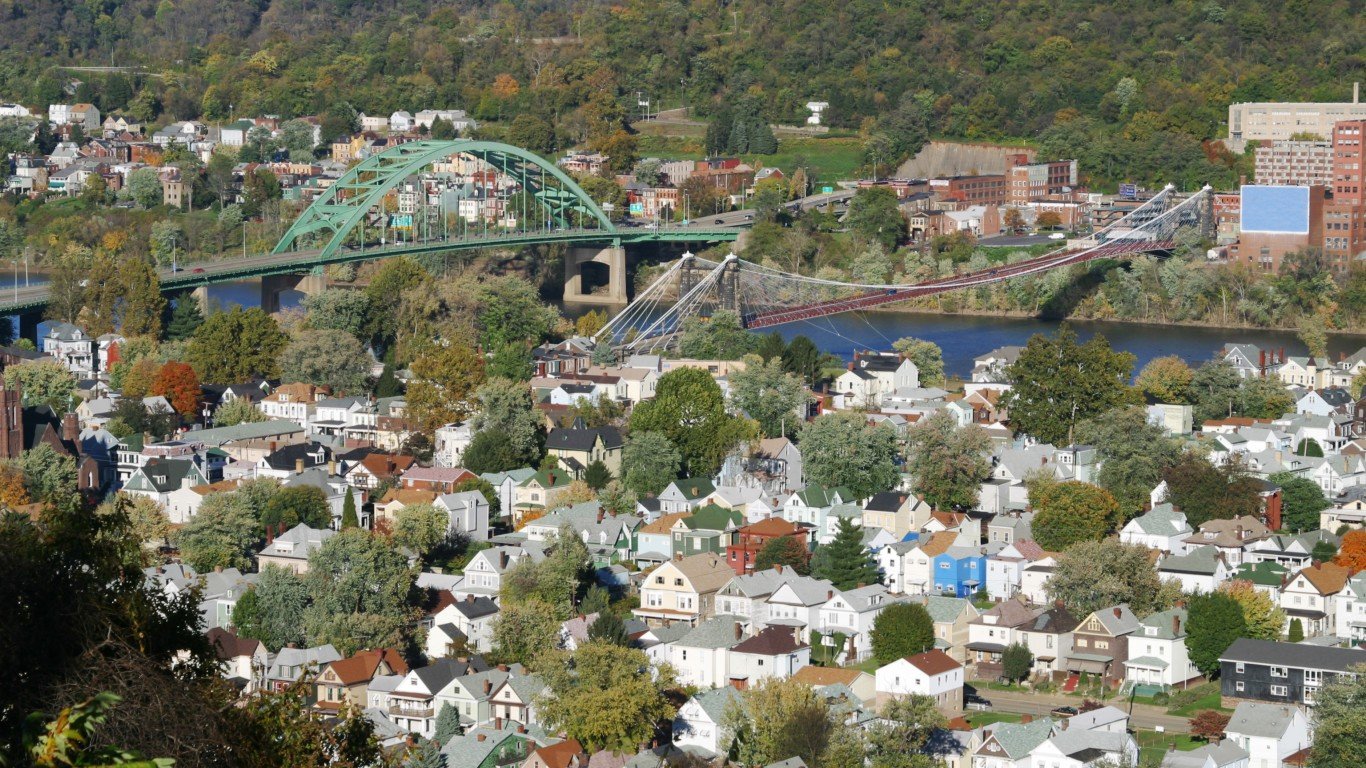
- Drunkest metro area: Wheeling; population – 136,708
- Adults who drink excessively: 16.8%
- Countywide driving deaths involving alcohol: 32.4%
Wisconsin

- Drunkest metro area: Wausau-Weston; population – 166,334
- Adults who drink excessively: 27.2%
- Countywide driving deaths involving alcohol: 23.2%
Wyoming
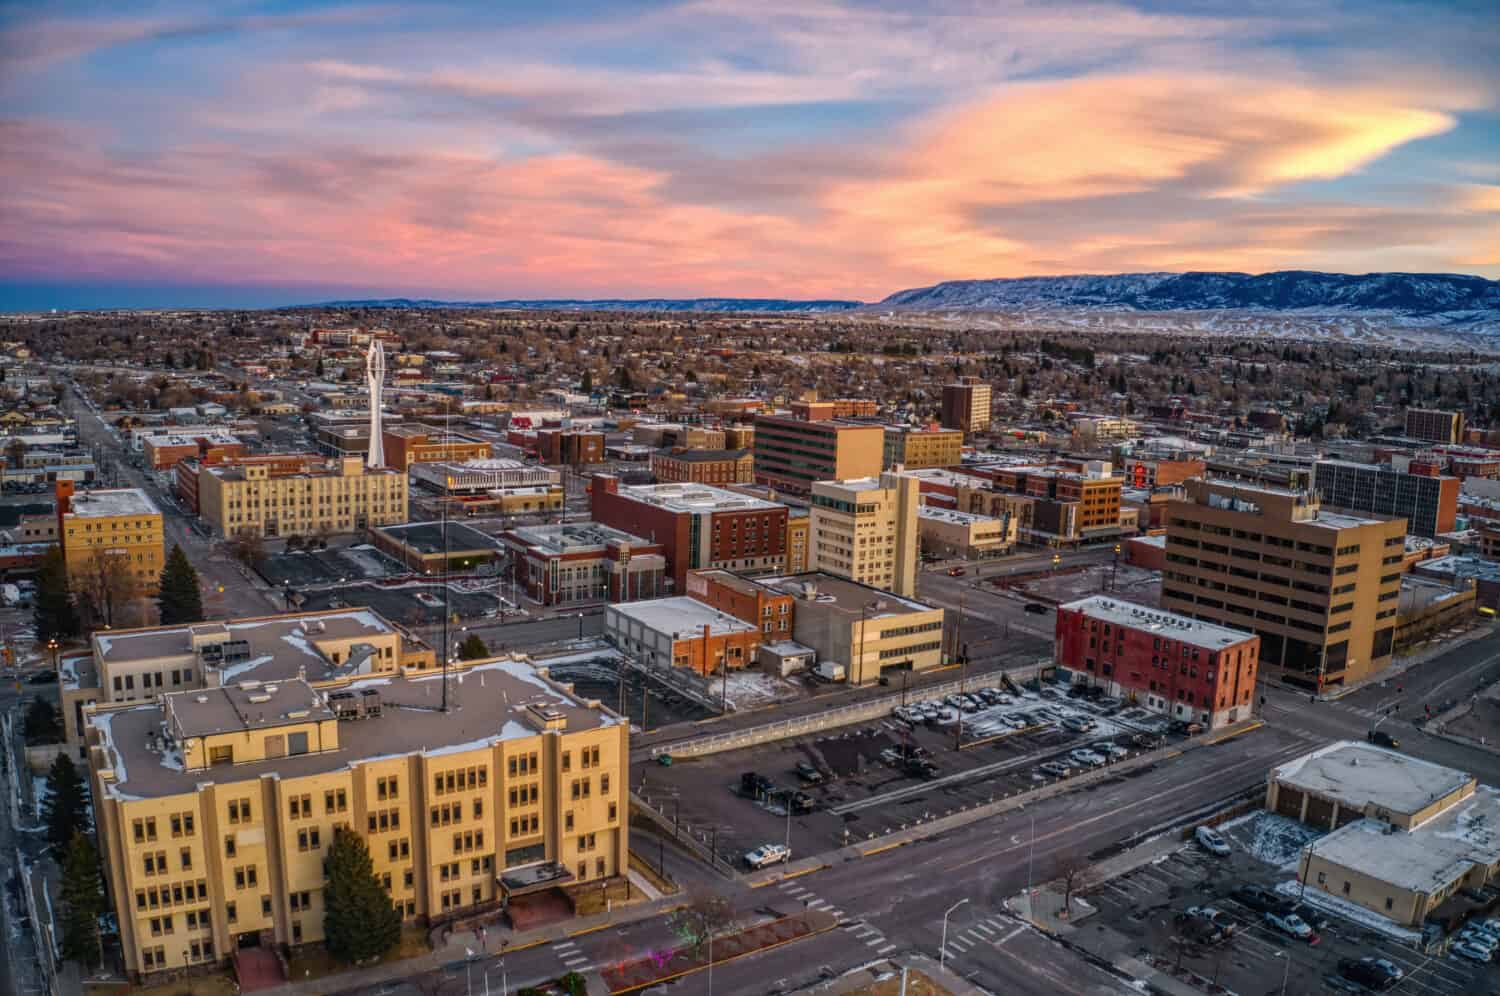
- Drunkest metro area: Casper; population – 79,601
- Adults who drink excessively: 19.0%
- Countywide driving deaths involving alcohol: 34.1%