“It’s a beautiful day in the” in the immortal words of Mr. Rogers. But of course the day looks more beautiful in some neighborhoods than others — and whether you think your neighborhood is beautiful or not probably depends as much on you as it does on the neighborhood.
But just what is a anyway? Dictionary.com defines it as “the area or region around or near some place or thing.” We use the term both geographically, in the sense of “He and I live in the same neighborhood” or “Let’s just go eat someplace in the neighborhood” and metaphorically, as in “That’ll cost in the neighborhood of $200.”
A neighborhood can be much more than just a vicinity, though. Whether it’s defined as a whole portion of a town or city (“the Eastside”) or even just a single street and its immediate offshoots (like the famed Italian-American neighborhood of Arthur Avenue in The Bronx), it can be a community, its own little world, a place where you have, well, neighbors.
We speak of “good” and “bad” neighborhoods, and define them according to our own situations, beliefs, and prejudices. Is a compound of wide, tree-lined suburban avenues shading elegant mansions necessarily a better neighborhood than a treeless, crowded urban block with mariachi music blaring from the barbershop and a taco truck on the corner? Of course not. A neighborhood is where you feel at home.
Neighborhoods change, of course, evolving for better or worse — however you might define those terms. Once posh areas fall into decrepitude; vibrant working-class parts of town gentrify, pushing out the original inhabitants. And sometimes even without major changes, neighborhoods fall in and out of favor for assorted reasons. And as some of them shrink in population, others grow.
24/7 Tempo has drawn on U.S. Census Bureau data and boundary definitions from the real estate site Zillow to compile a list of the 100 fastest growing neighborhoods in the U.S.
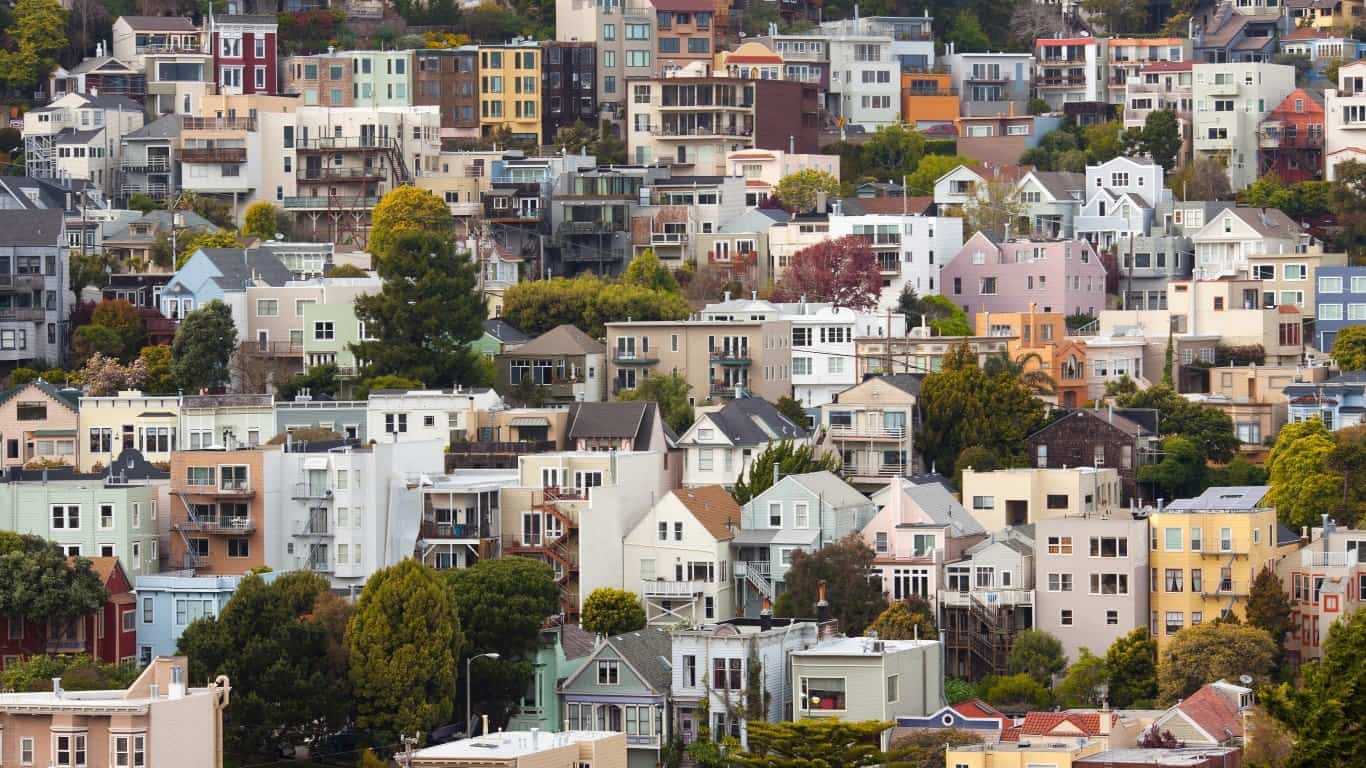
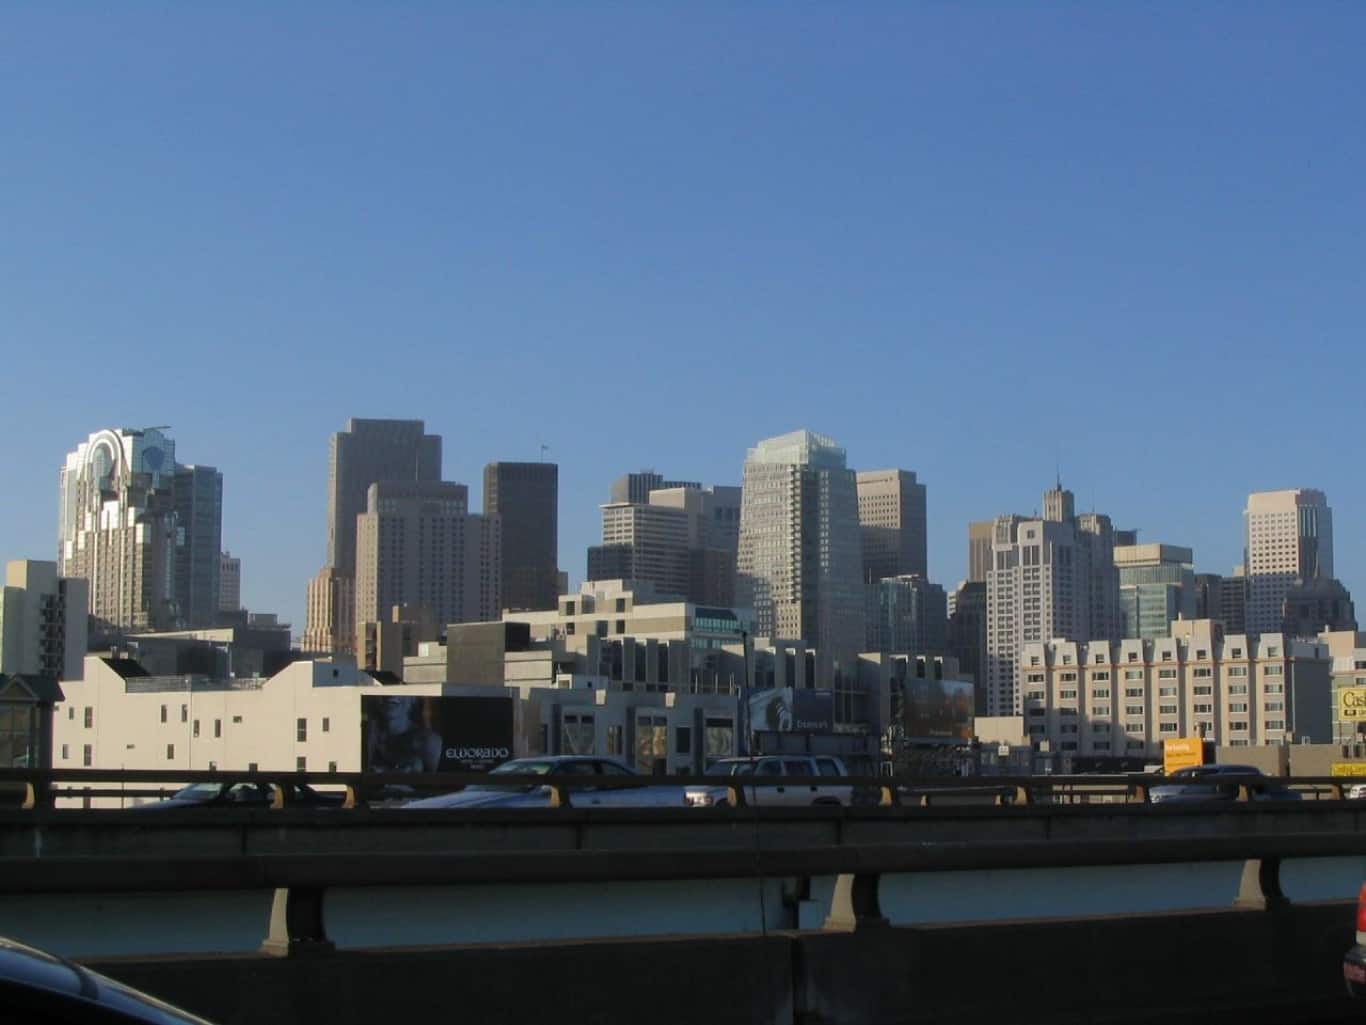
Three states stand out on the list: Out of the 100 neighborhoods here, a dozen of them are in California, ranging from Hunters Point in San Francisco, home to a decommissioned U.S. Navy shipyard and the now-demolished Candlestick Park and the site of major redevelopment projects in recent decades, to Prospect Park, a quiet, family-friendly part of Rancho Cordova, a historic onetime Gold Rush town near Sacramento.
North Carolina — which in general is one of the fastest growing states in America — comes next, with 11 entries here. And right behind that is Georgia, with 10 — not surprising, considering that it’s another fast-growing state, having added more than a million new residents since 2010. That’s a lot of potential neighbors. (Also See The City With the Healthiest Population in Every State)
Scroll down for the fastest growing neighborhoods in the U.S.:
Methodology
To determine the fastest growing neighborhoods in the United States, 24/7 Tempo reviewed population data from the U.S. Census Bureau and neighborhood boundary definitions from Zillow. Neighborhoods were ranked based on the percentage change in estimated population from 2017 to 2022. Population estimates were calculated by aggregating from the census tract level to the neighborhood level using boundary definitions from the U.S. Census Bureau and Zillow. Only census tracts with at least 50% overlap with a neighborhood boundary were included in a neighborhood’s population tabulation. Population data is from the American Community Survey and are five-year estimates.
56. Mayfair (Washington, DC)
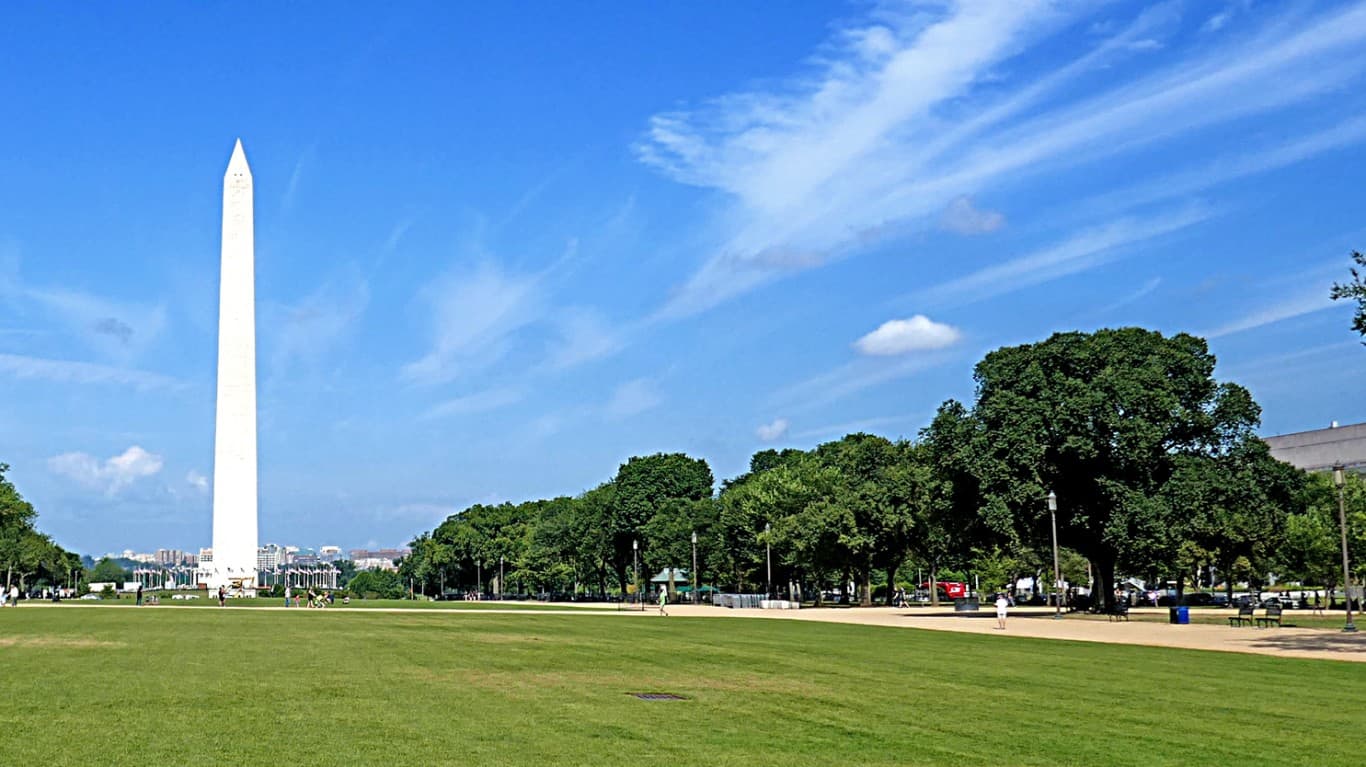
- Est. population growth, 2017 to 2022: +40.0%
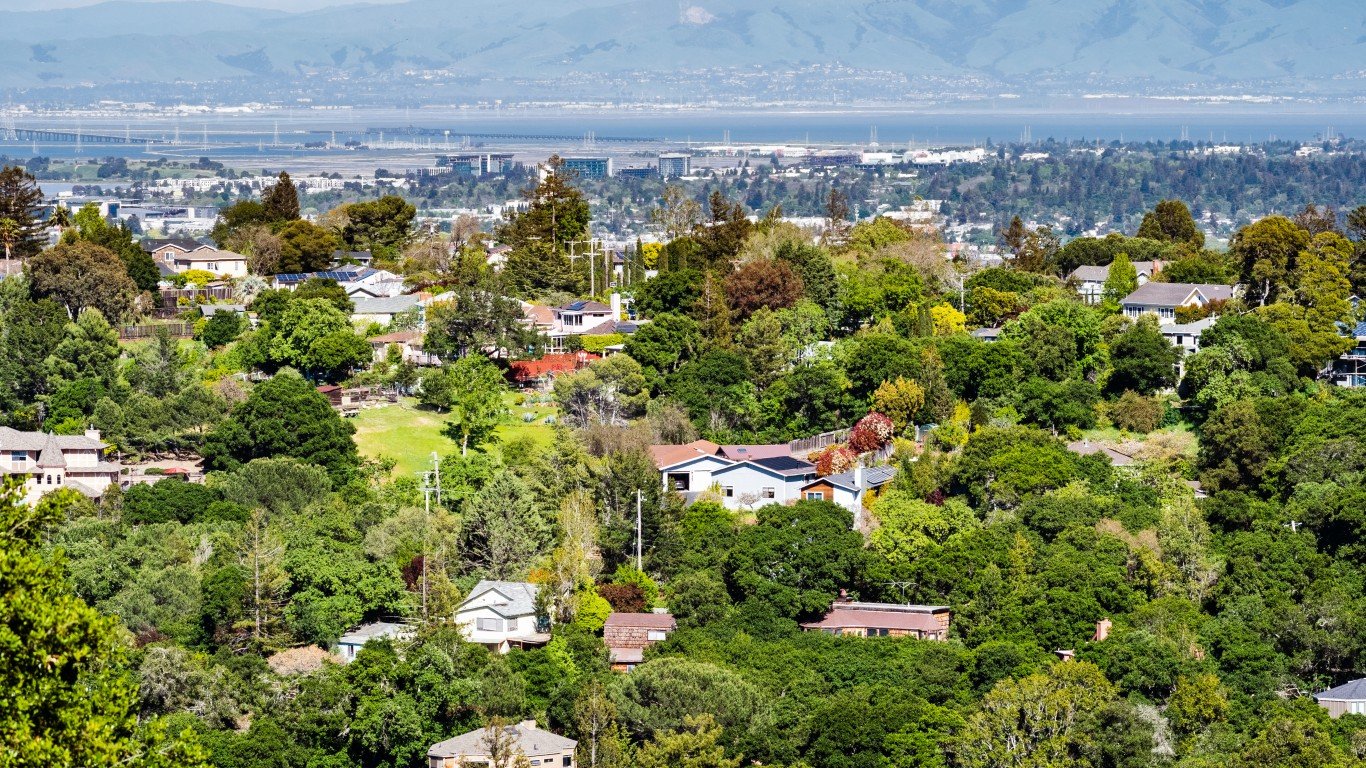
55. Fairmeadow (Palo Alto, CA)
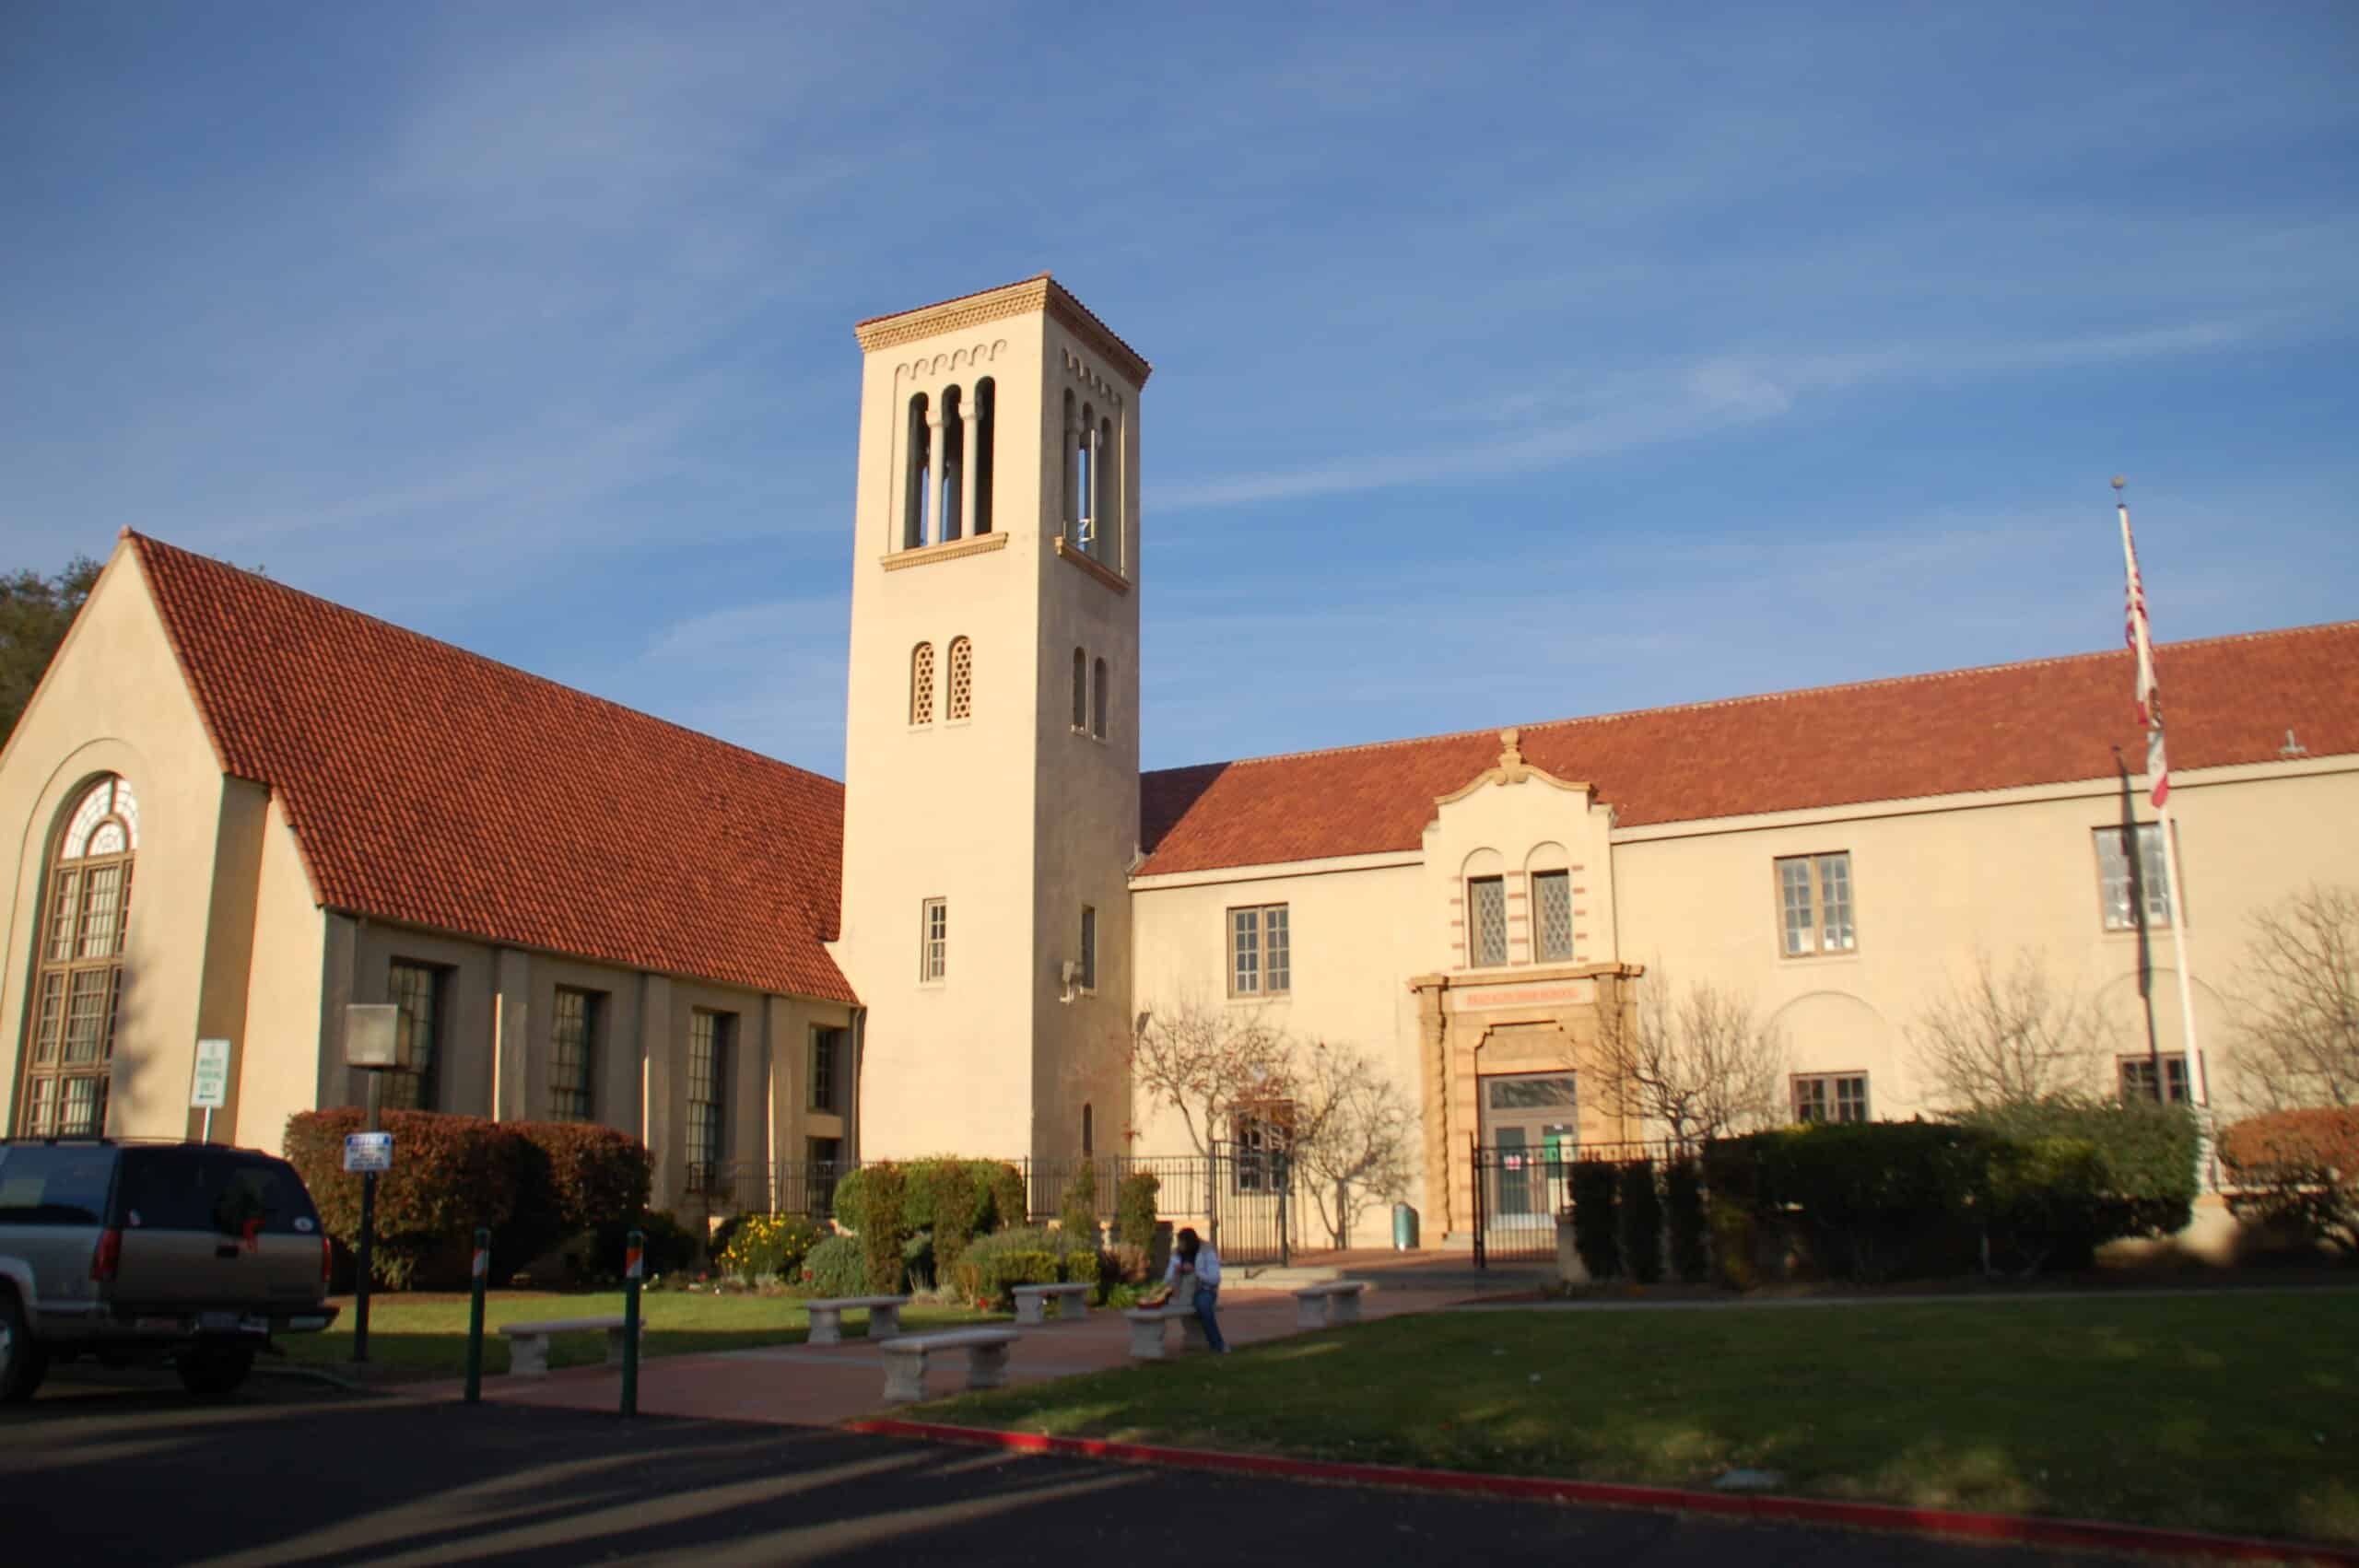
- Est. population growth, 2017 to 2022: +40.0%
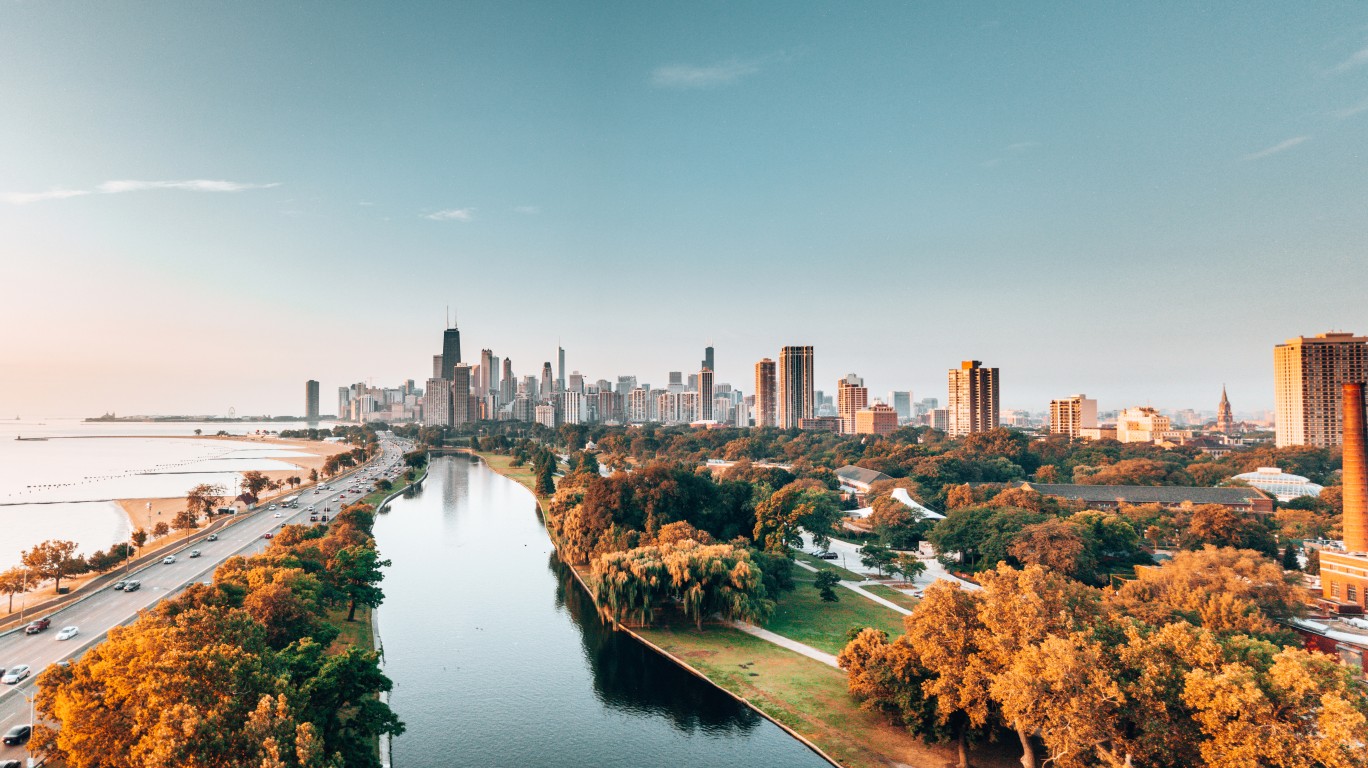
54. River North (Chicago, IL)
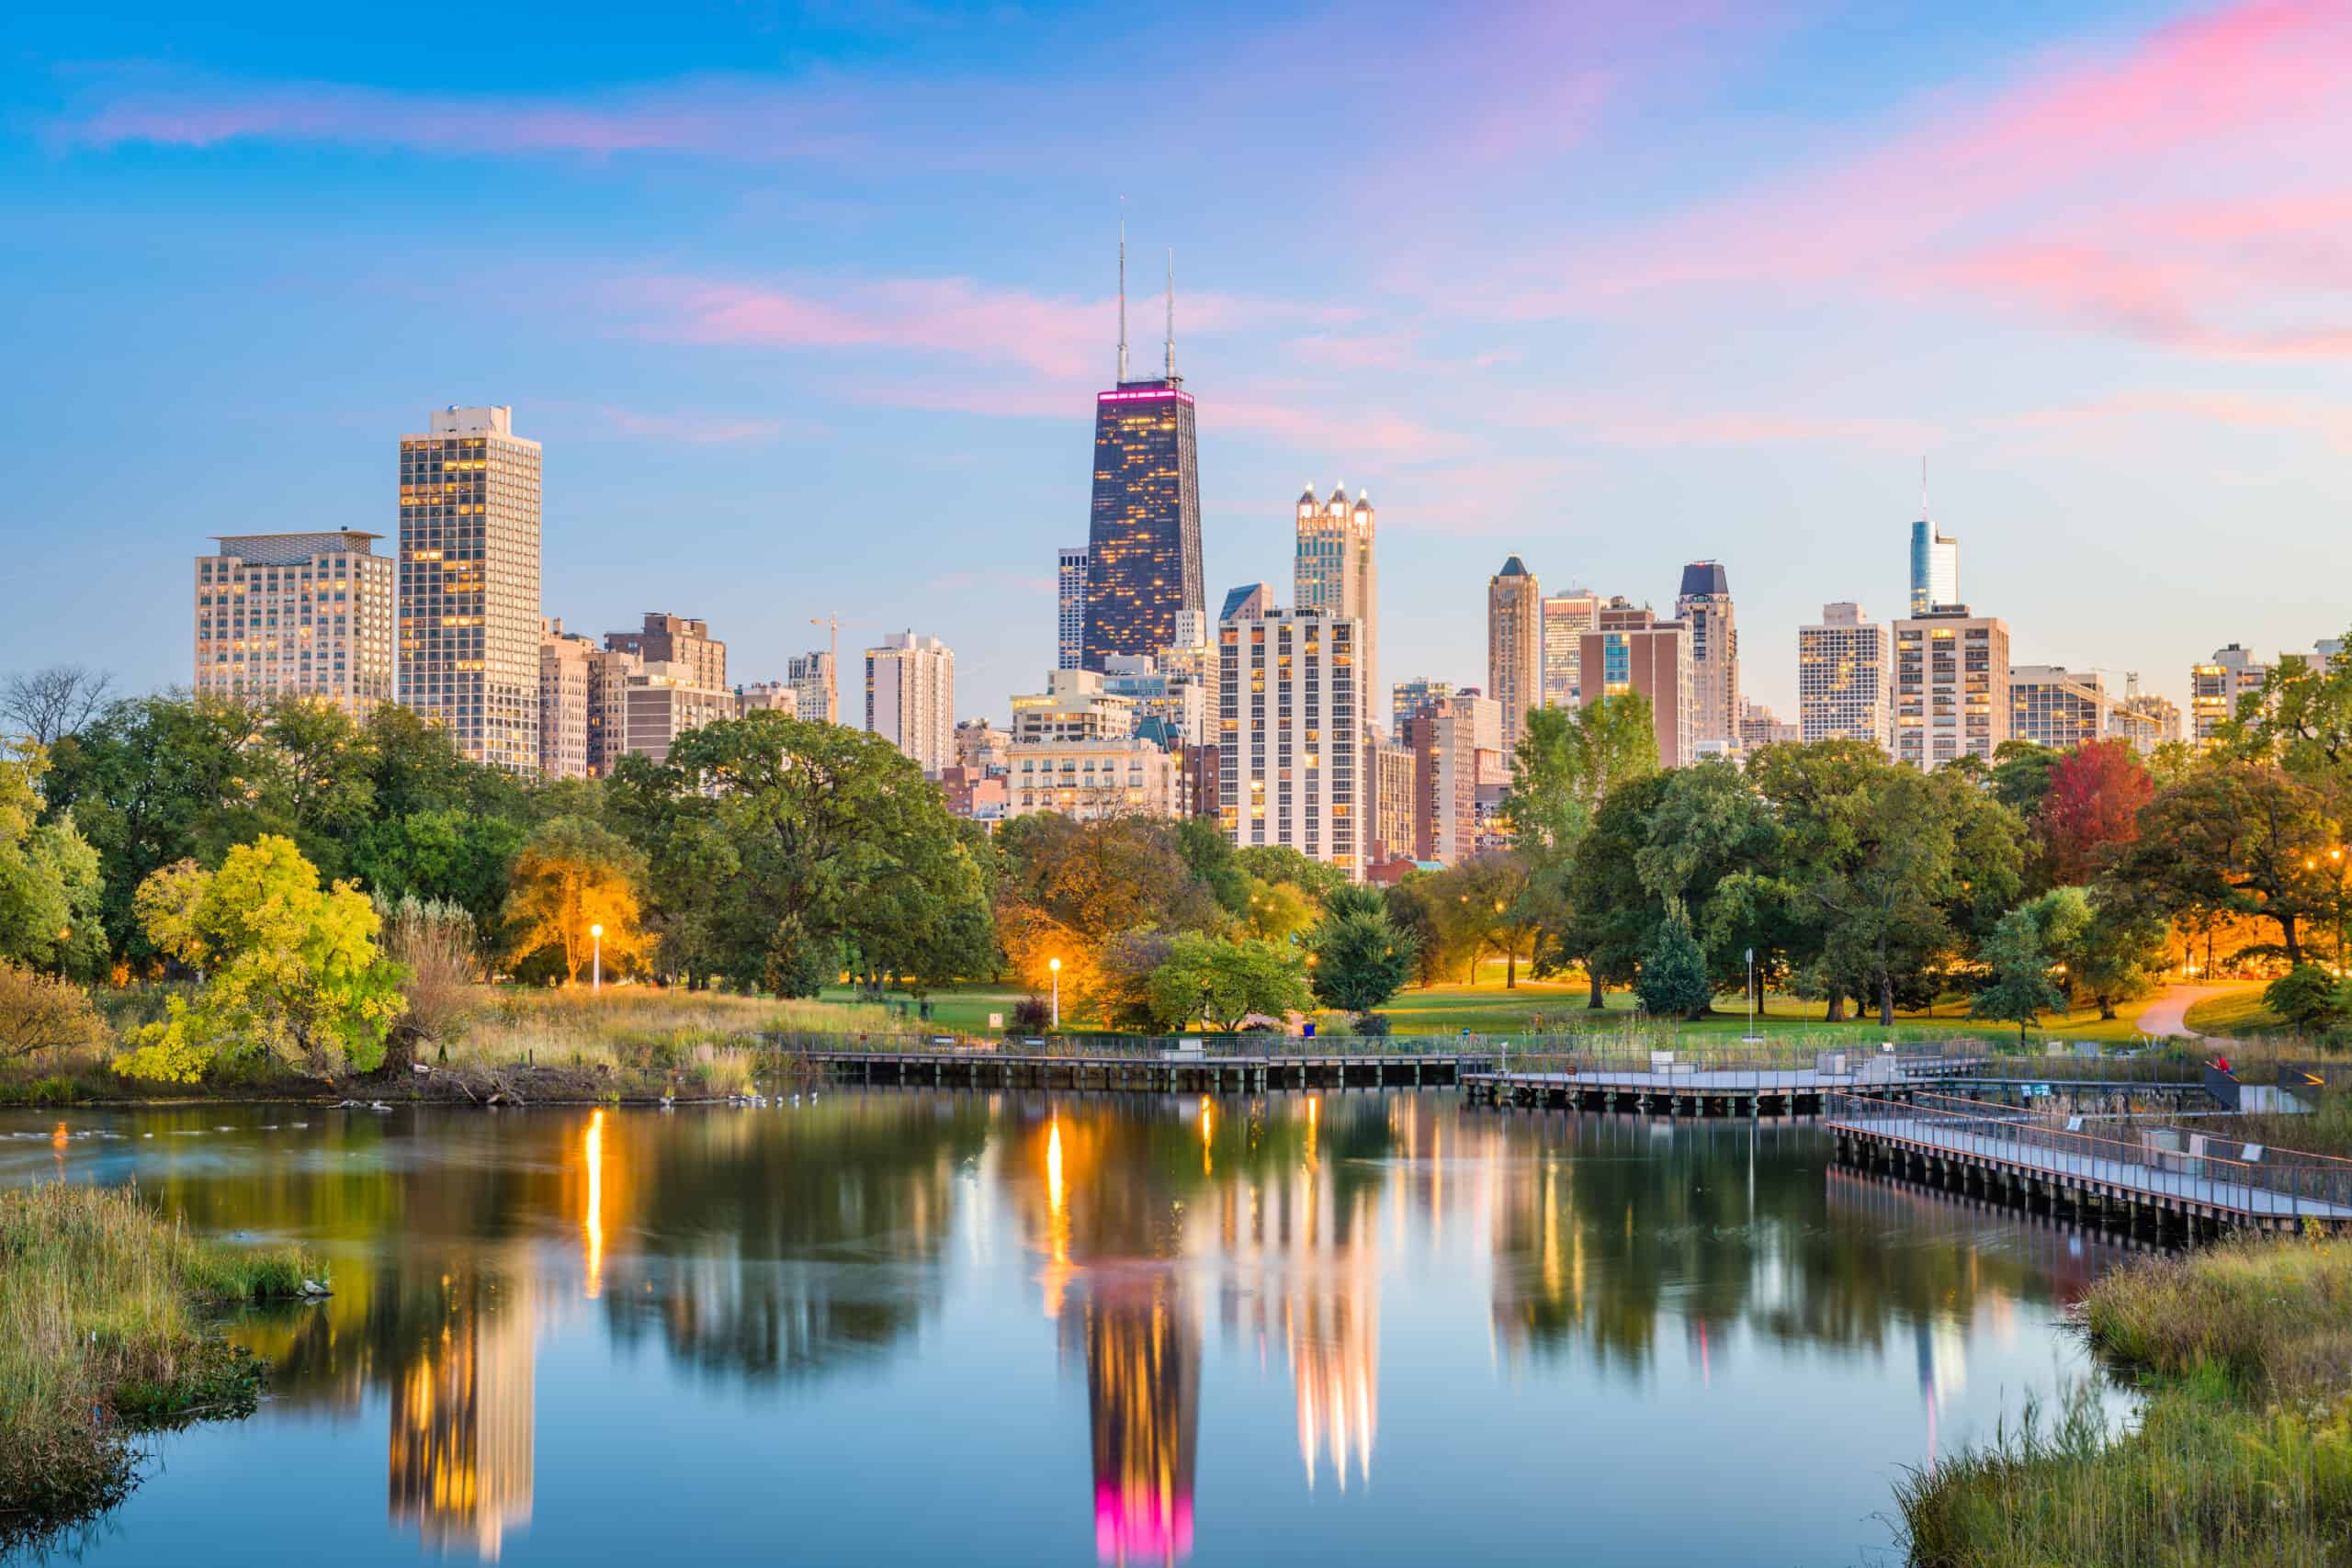
- Est. population growth, 2017 to 2022: +40.0%
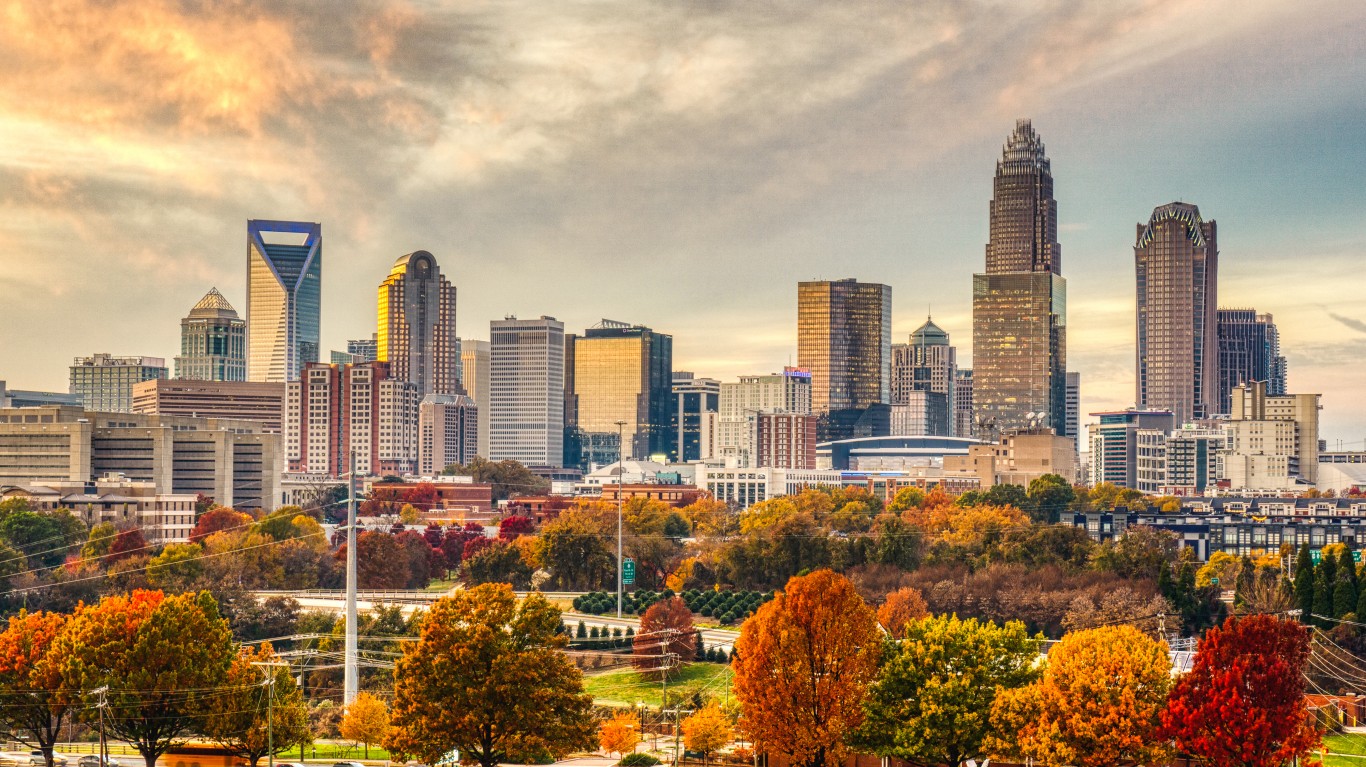
53. First Ward (Charlotte, NC)
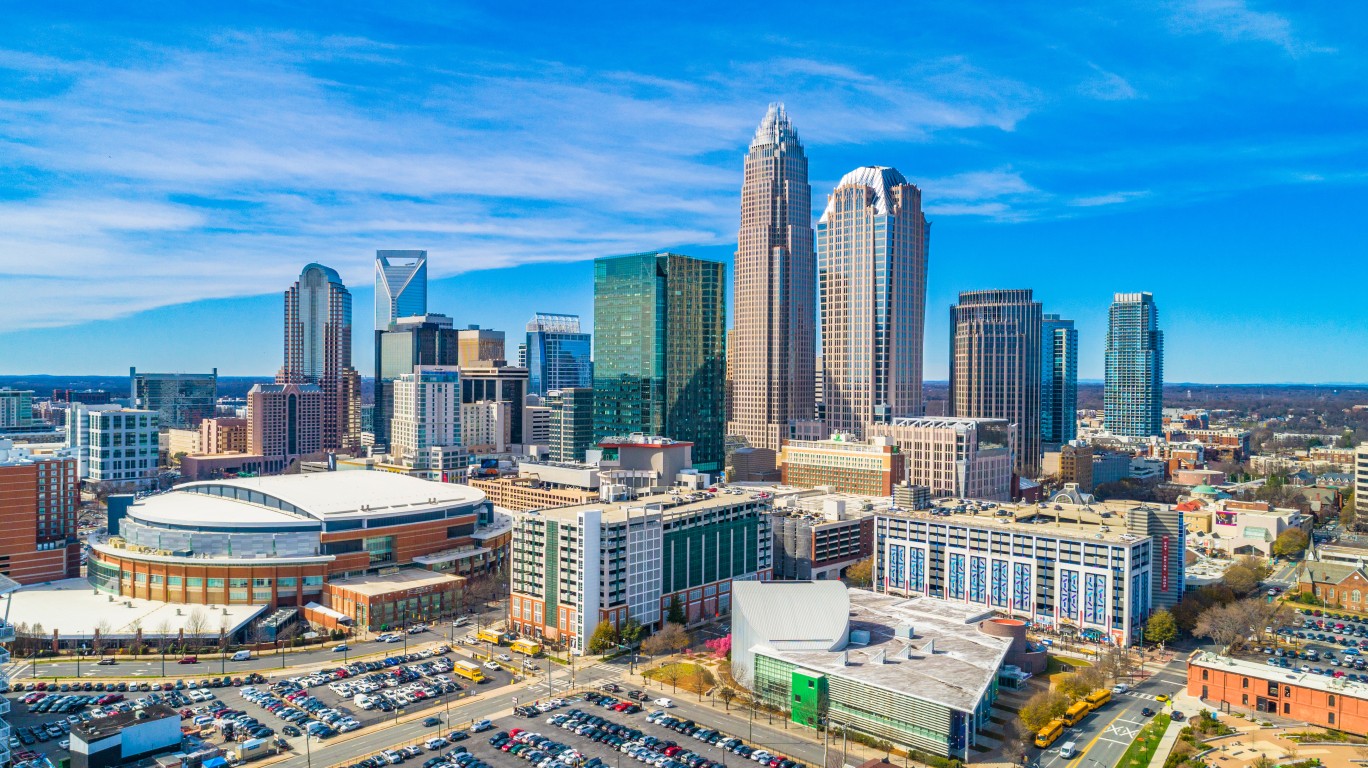
- Est. population growth, 2017 to 2022: +40.1%
52. Marrion (Vancouver, WA)
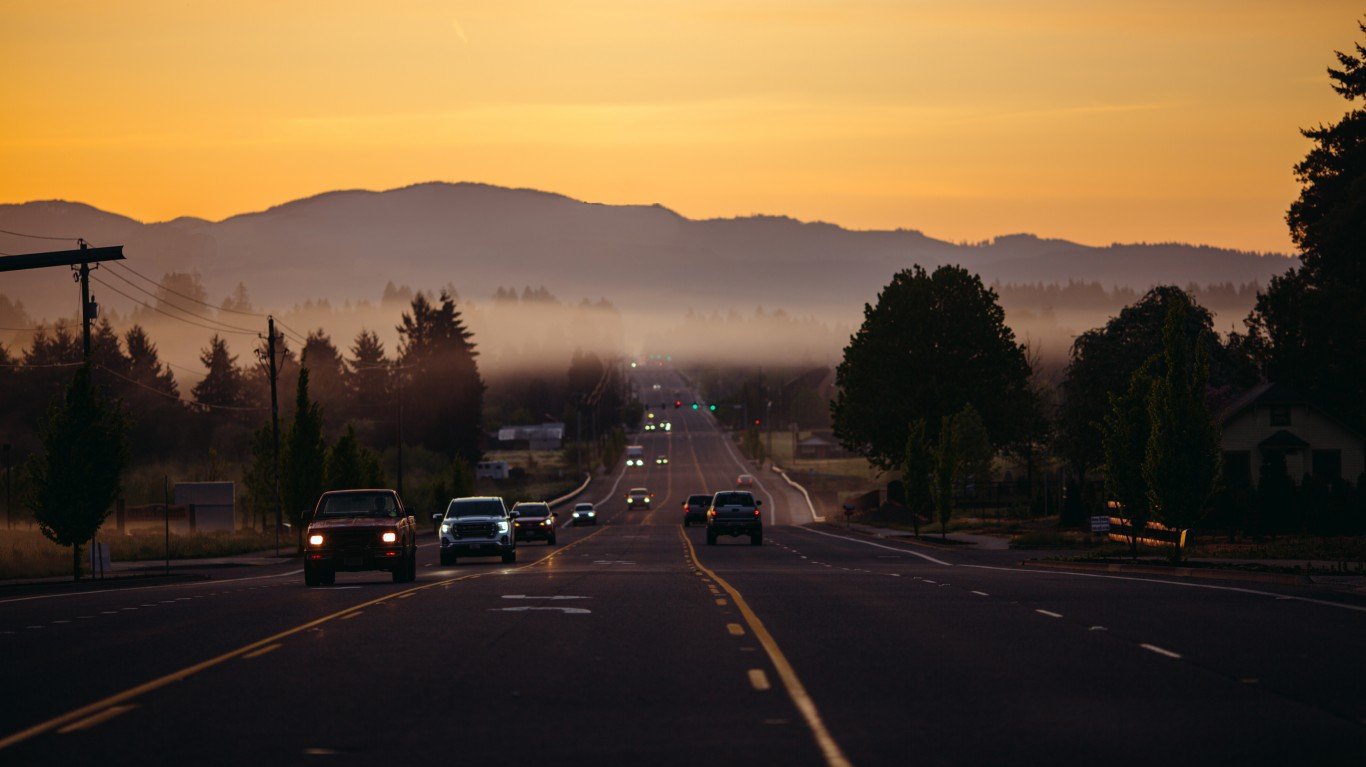
- Est. population growth, 2017 to 2022: +40.4%
51. Bay Meadows (San Mateo, CA)

- Est. population growth, 2017 to 2022: +40.8%
50. Hartkopf (Brooklyn Park, MN)
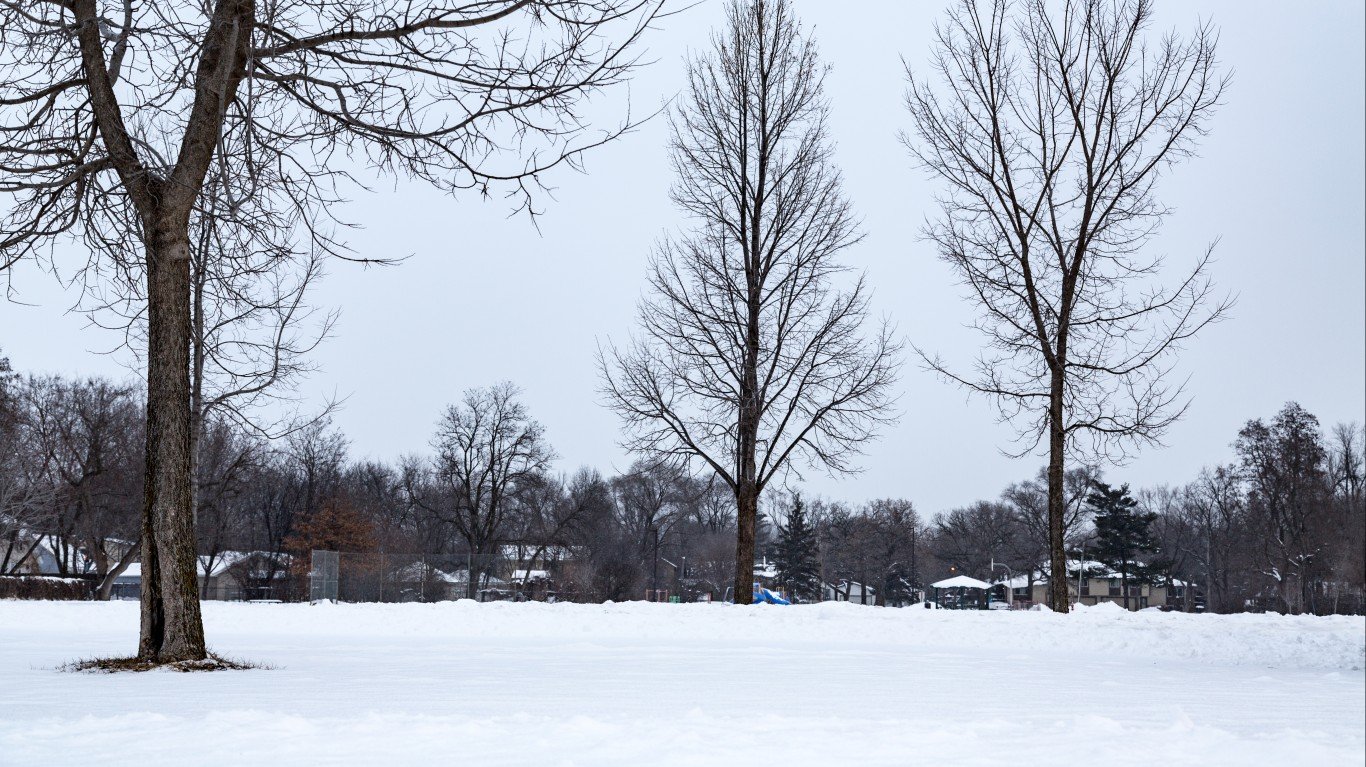
- Est. population growth, 2017 to 2022: +42.1%
49. West Forest Park (Baltimore, MD)
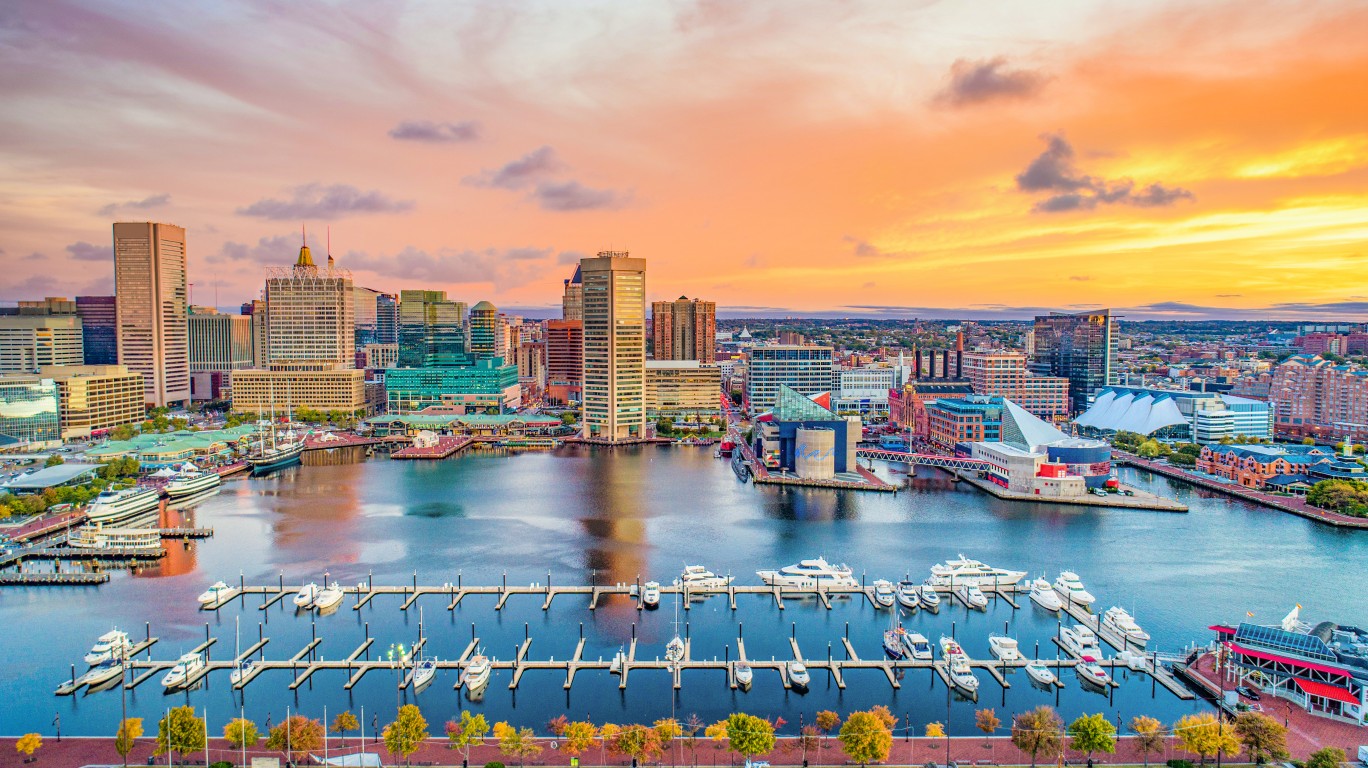
- Est. population growth, 2017 to 2022: +42.2%
48. Weinland Park (Columbus, OH)
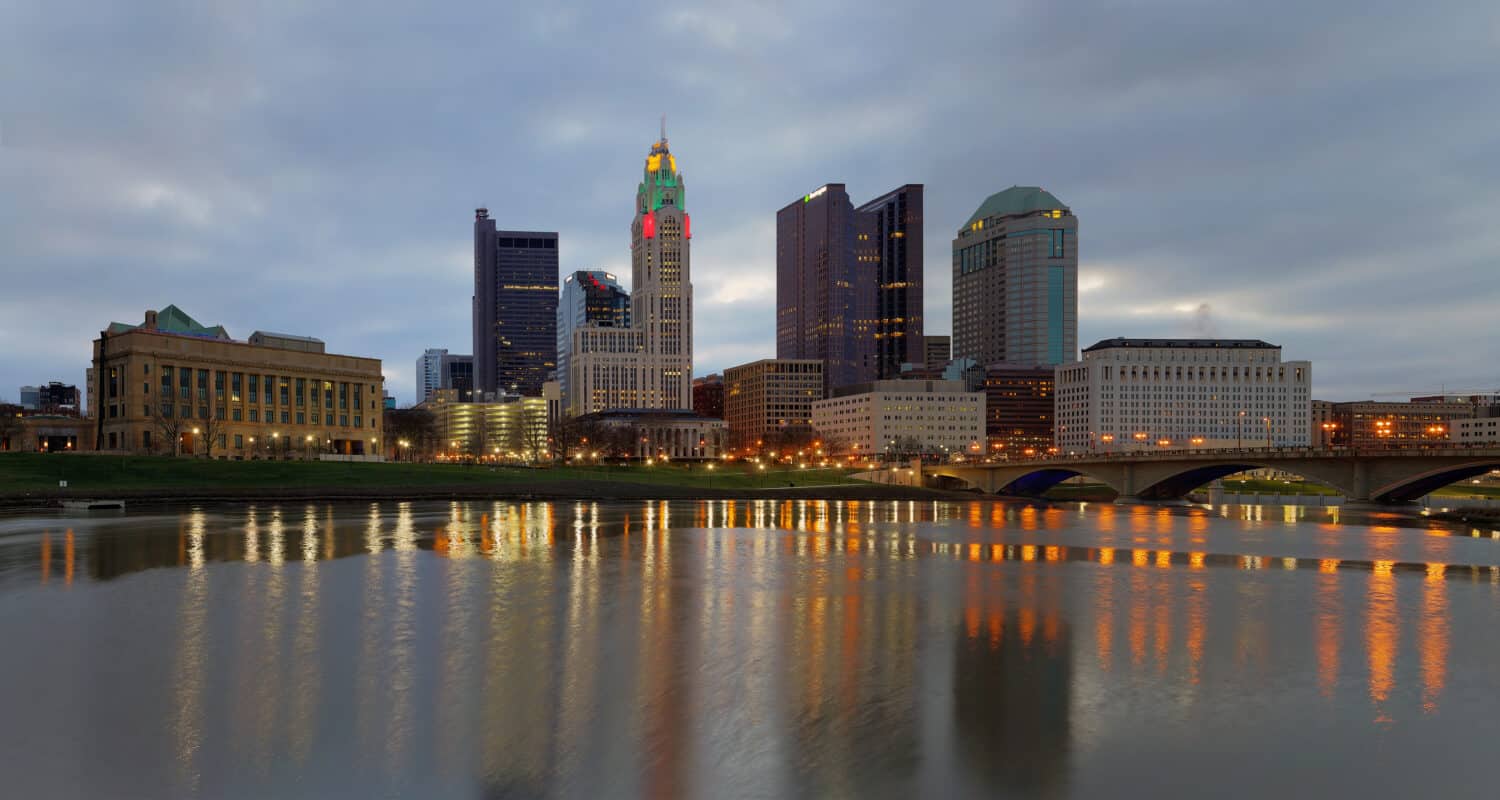
- Est. population growth, 2017 to 2022: +42.3%
47. Silverlake (Providence, RI)
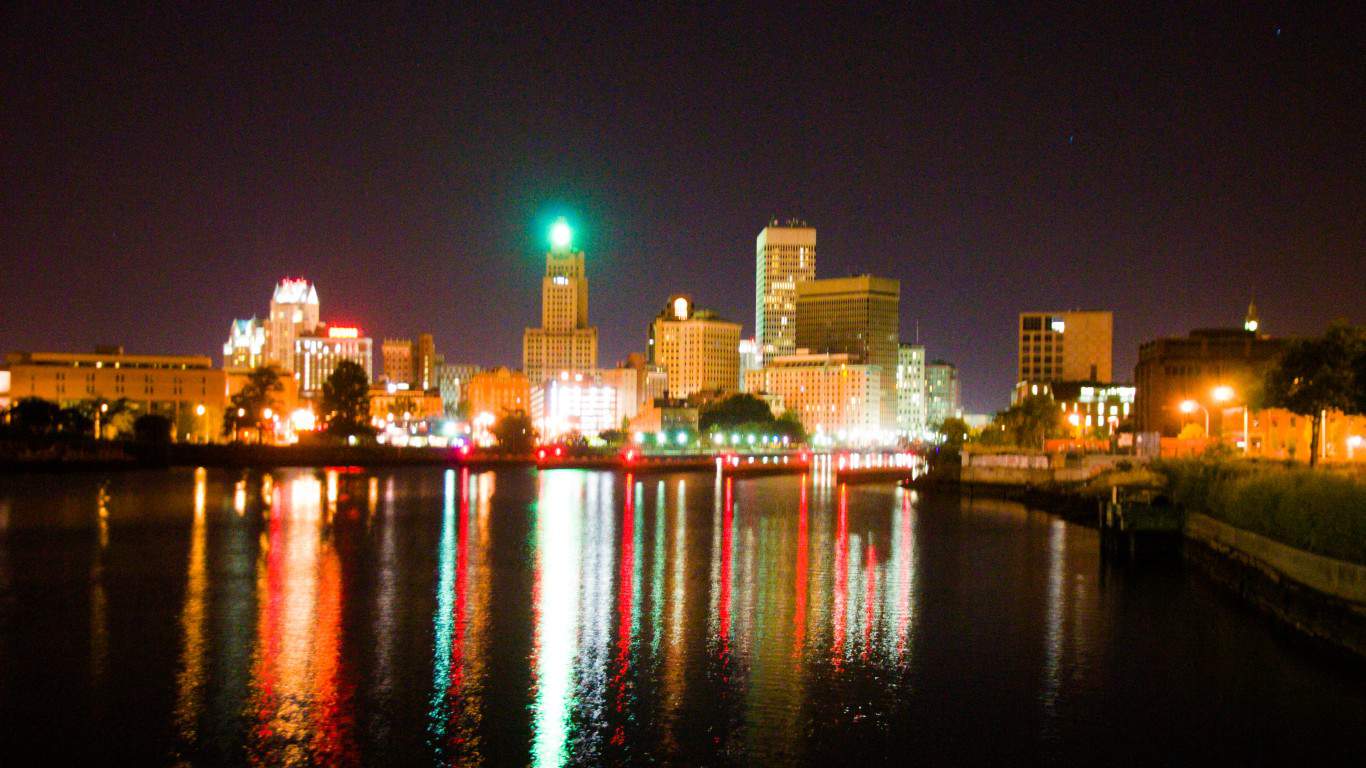
- Est. population growth, 2017 to 2022: +44.1%
46. Heartside (Grand Rapids, MI)
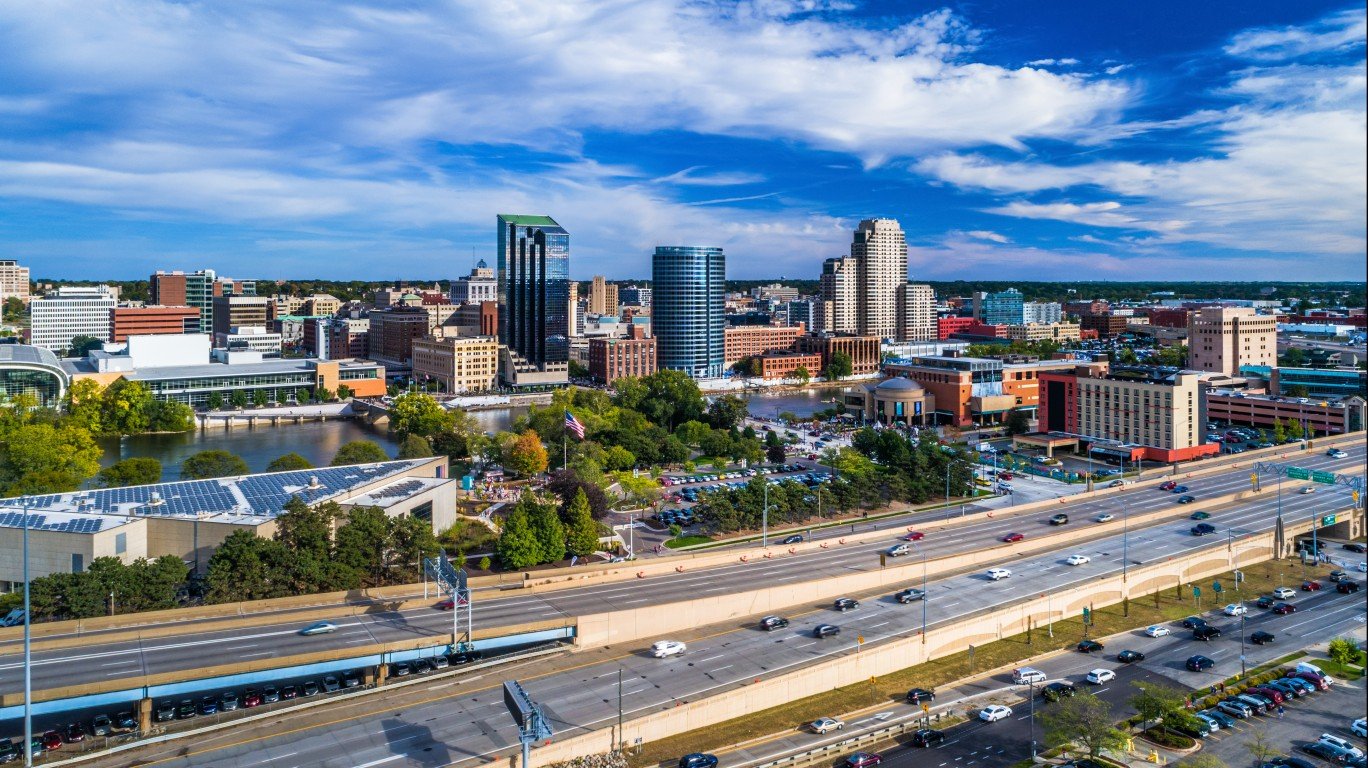
- Est. population growth, 2017 to 2022: +44.5%
45. Yorkshire (Charlotte, NC)
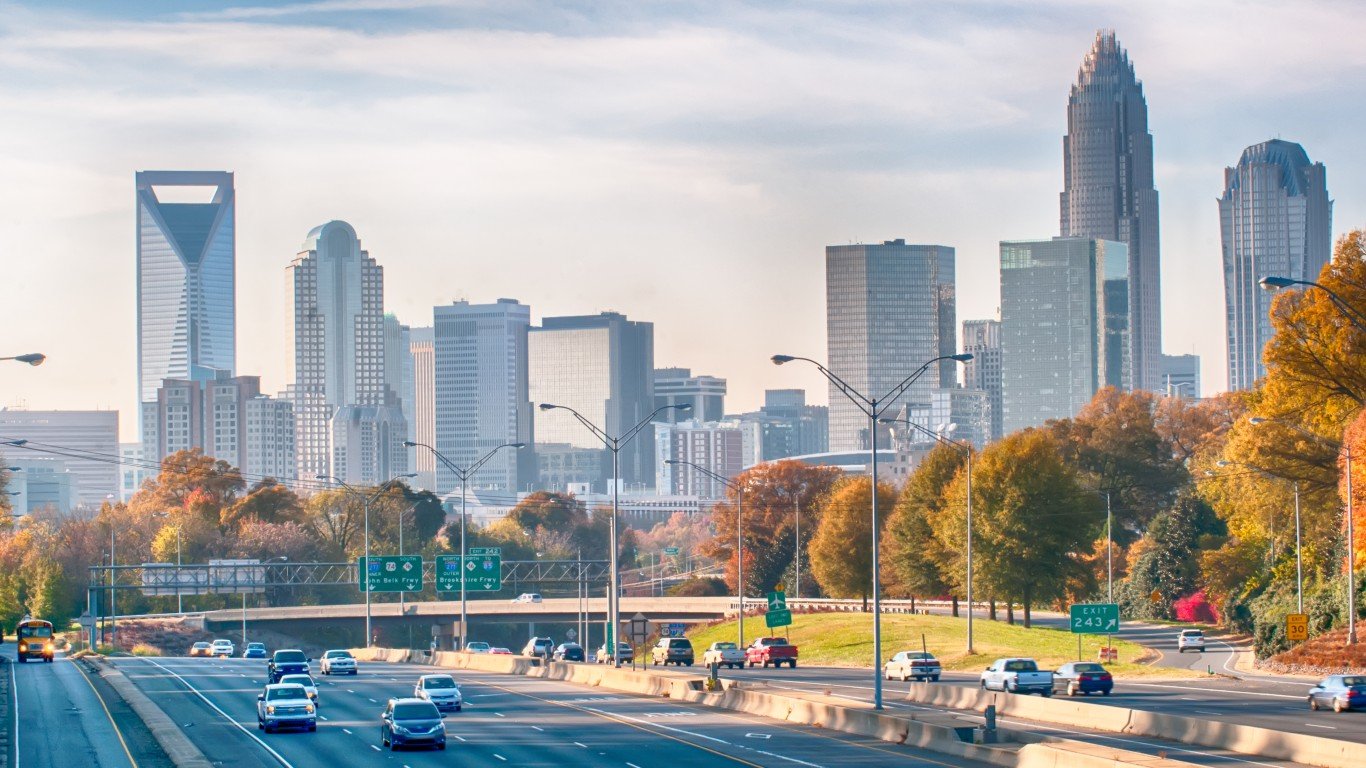
- Est. population growth, 2017 to 2022: +45.2%
44. Central Business District (Cincinnati, OH)
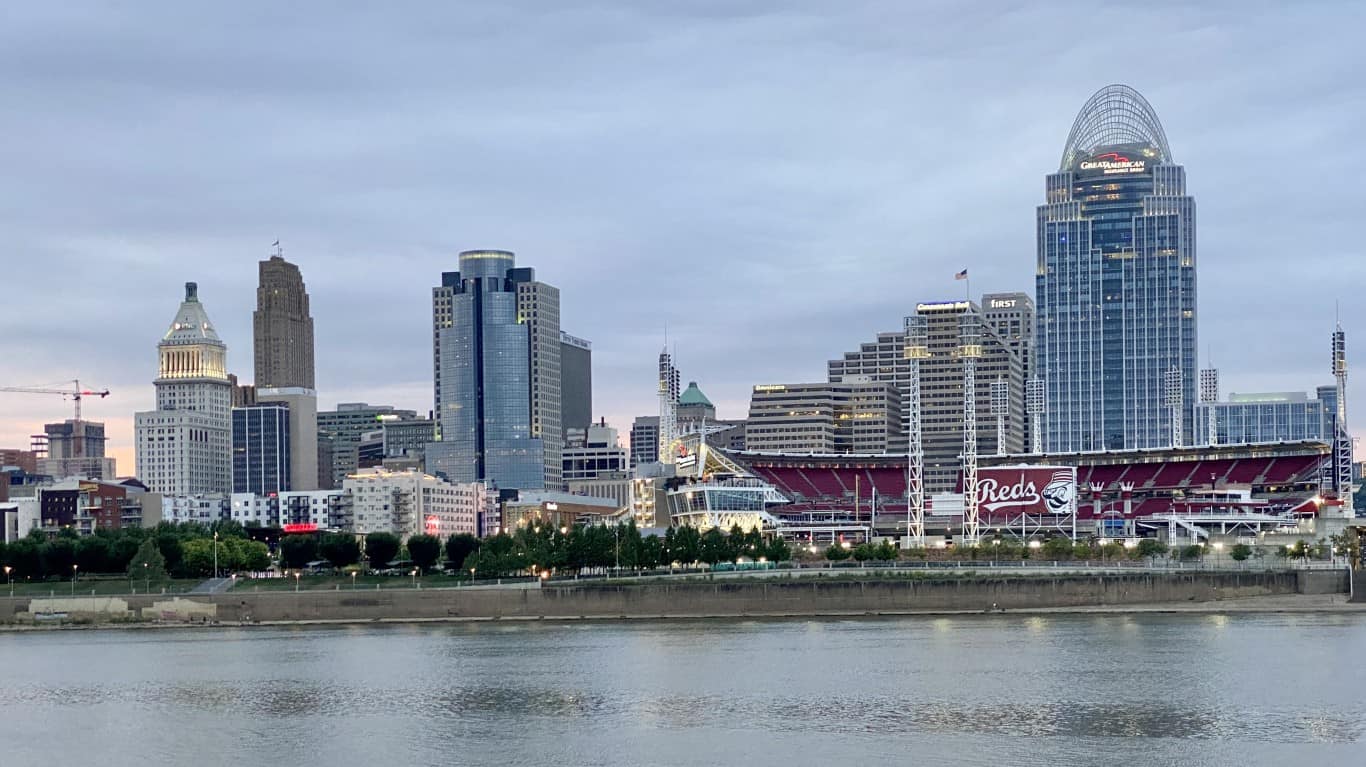
- Est. population growth, 2017 to 2022: +45.8%
43. Pecan Park (Jacksonville, FL)
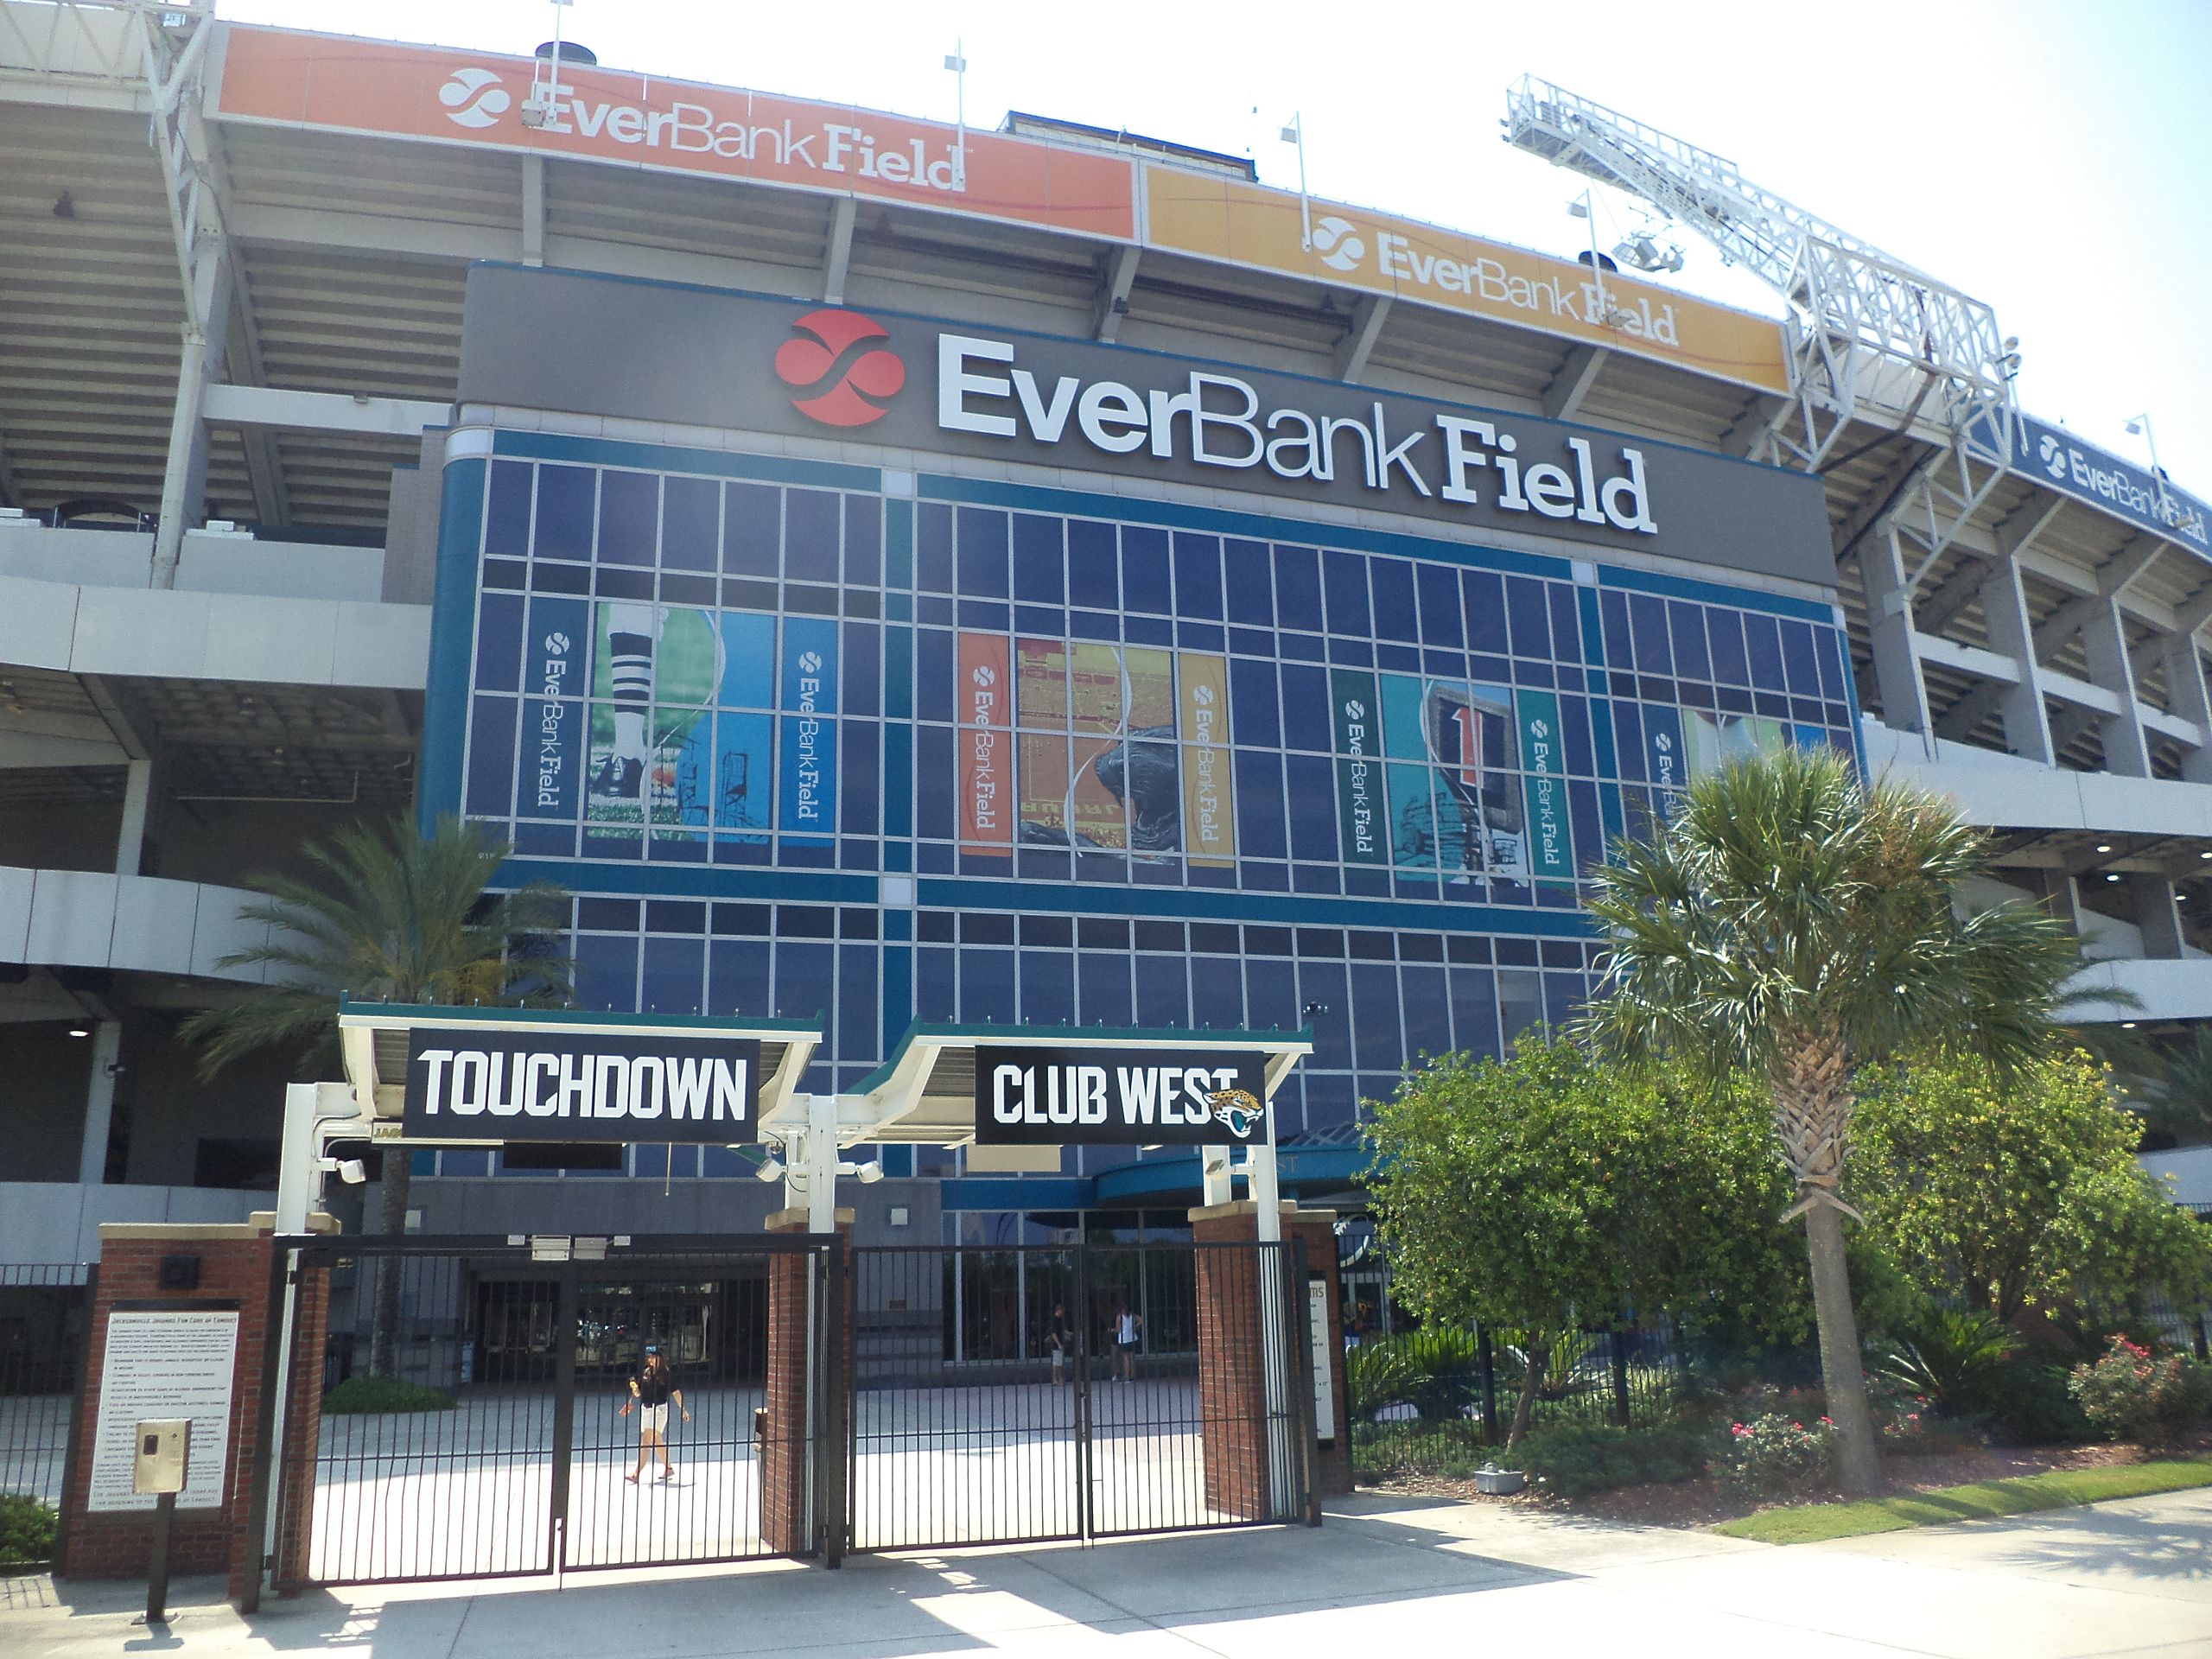
- Est. population growth, 2017 to 2022: +45.9%
42. Stonewood (Stockton, CA)
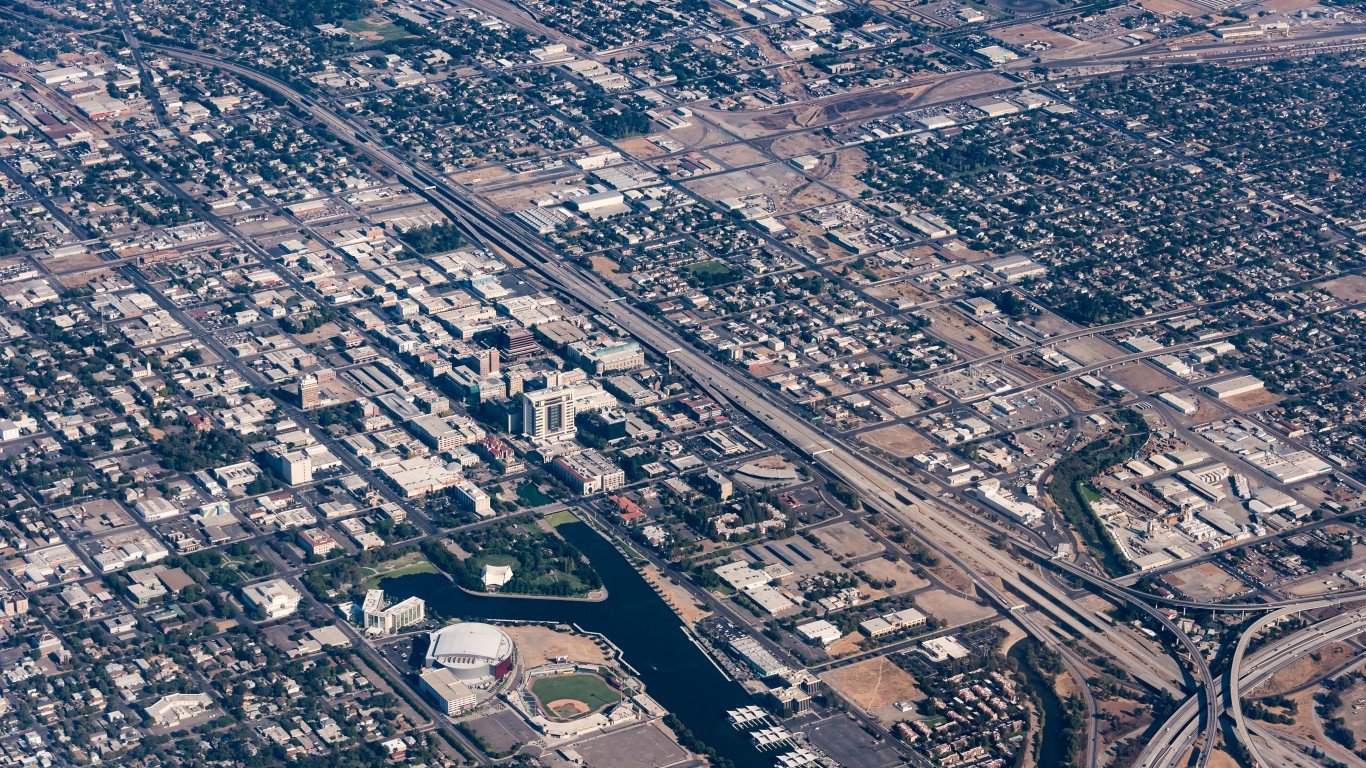
- Est. population growth, 2017 to 2022: +46.7%
41. Downtown (Baltimore, MD)
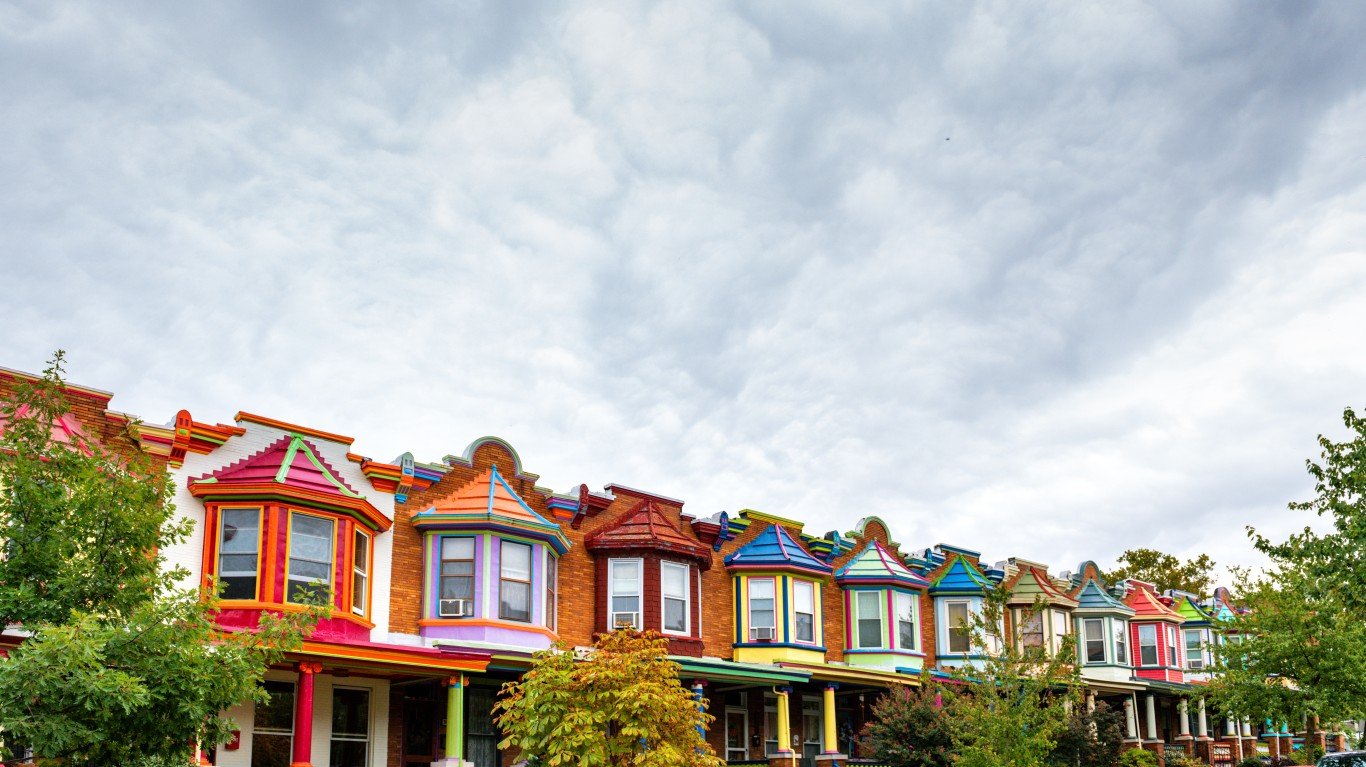
- Est. population growth, 2017 to 2022: +47.3%
40. Gallaudet (Washington, DC)
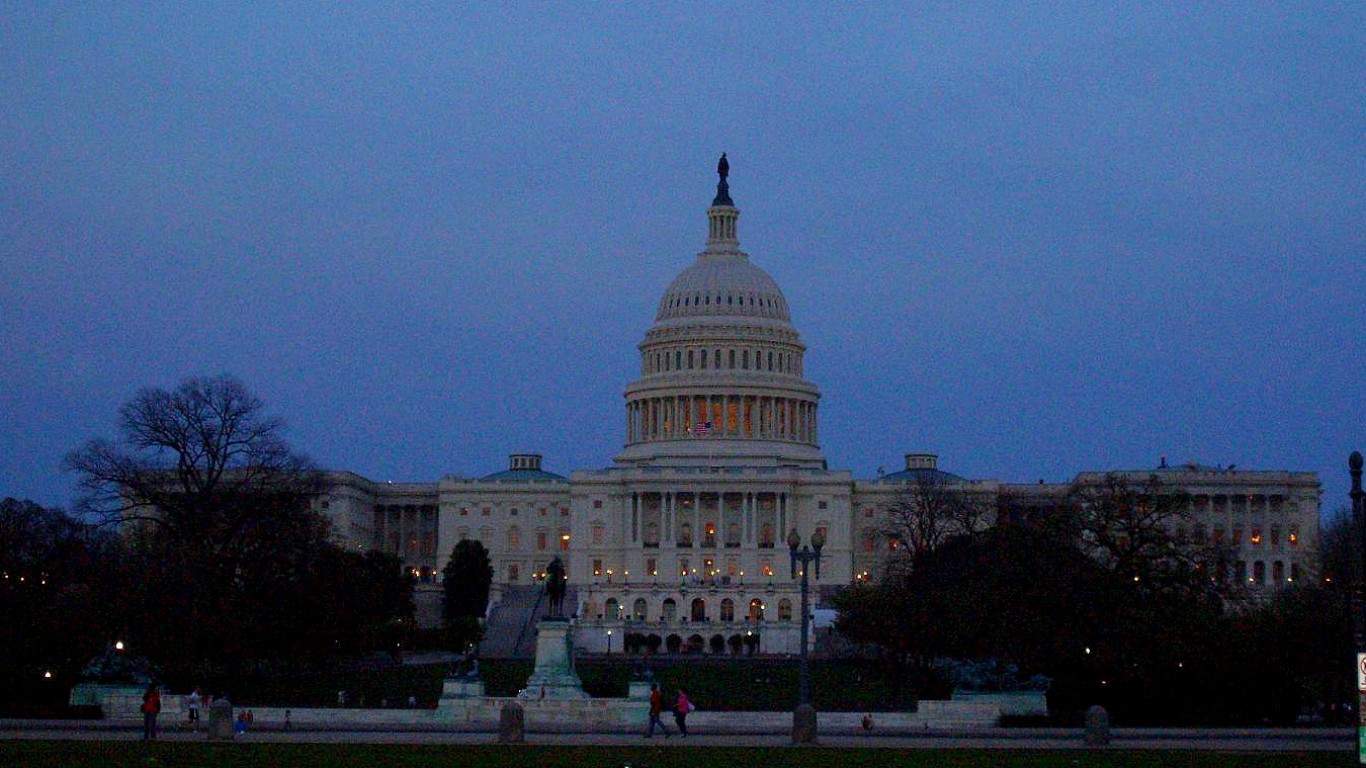
- Est. population growth, 2017 to 2022: +47.3%
39. Cherry (Charlotte, NC)
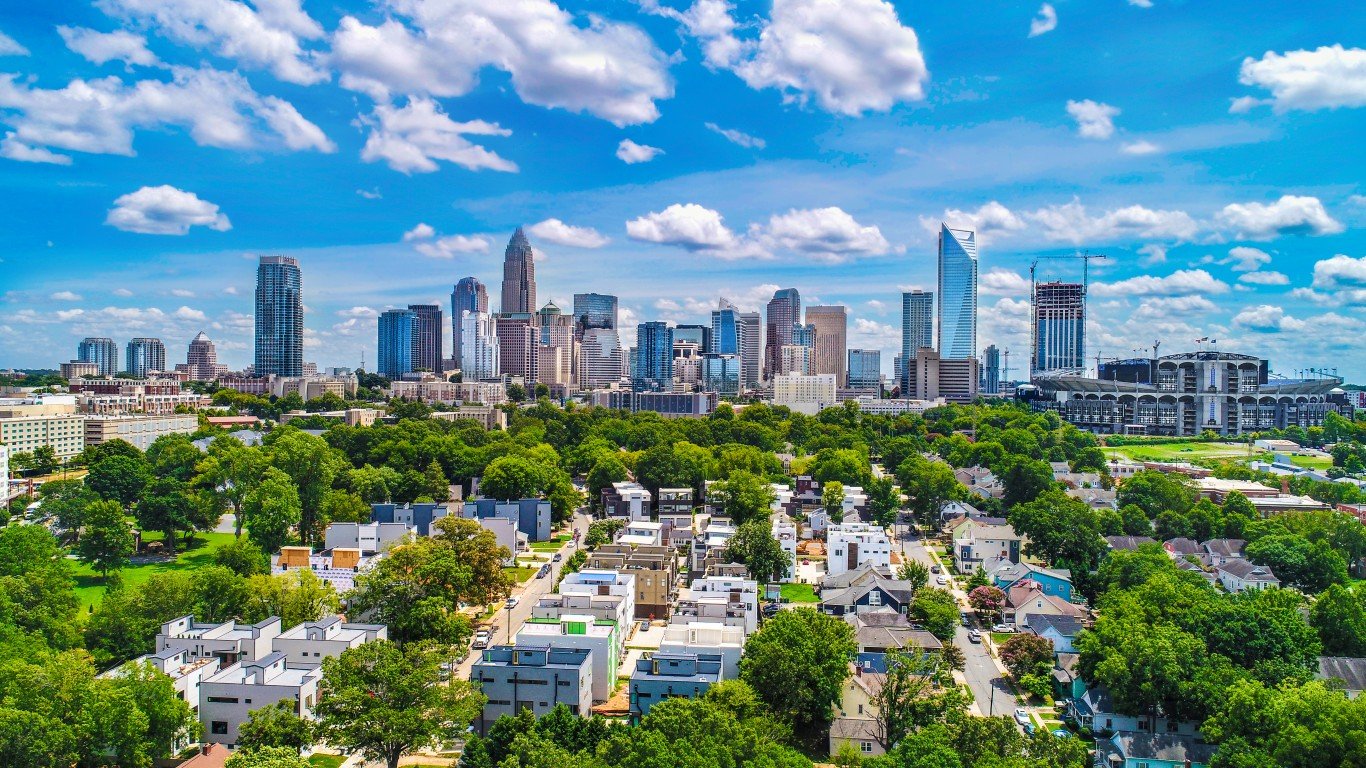
- Est. population growth, 2017 to 2022: +47.4%
38. Carterville (Provo, UT)

- Est. population growth, 2017 to 2022: +48.0%
37. Lakefront (Syracuse, NY)
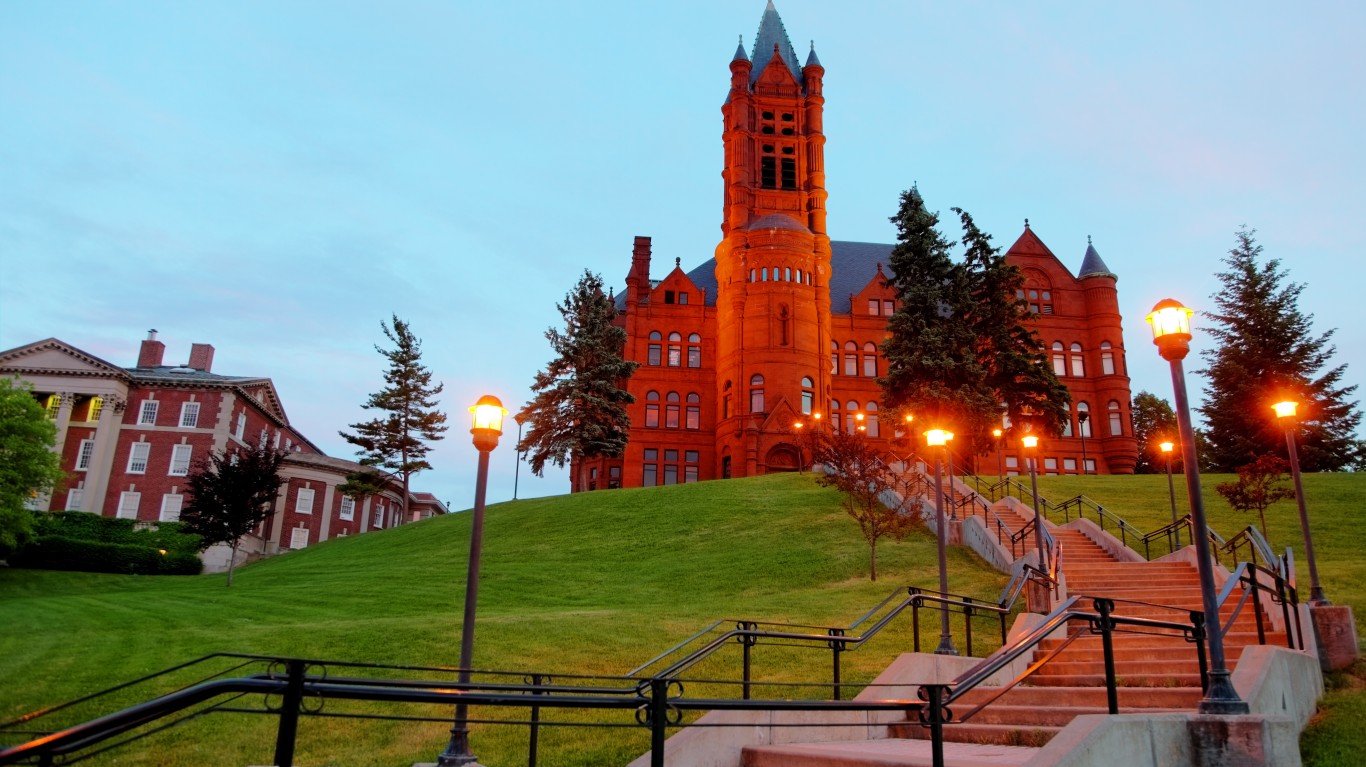
- Est. population growth, 2017 to 2022: +48.5%
36. Overtown (Miami, FL)
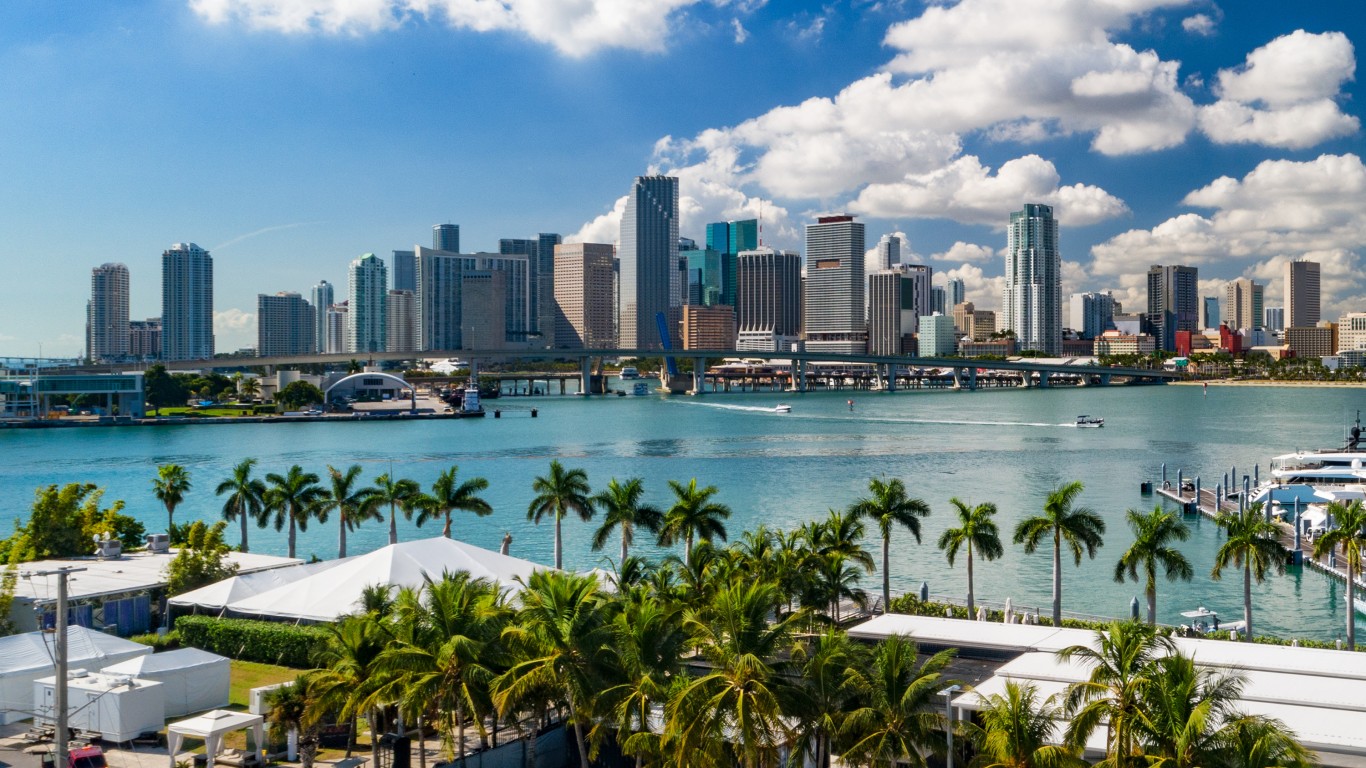
- Est. population growth, 2017 to 2022: +49.7%
35. Greenville (Charlotte, NC)
- Est. population growth, 2017 to 2022: +50.0%
34. Mission Valley West (San Diego, CA)
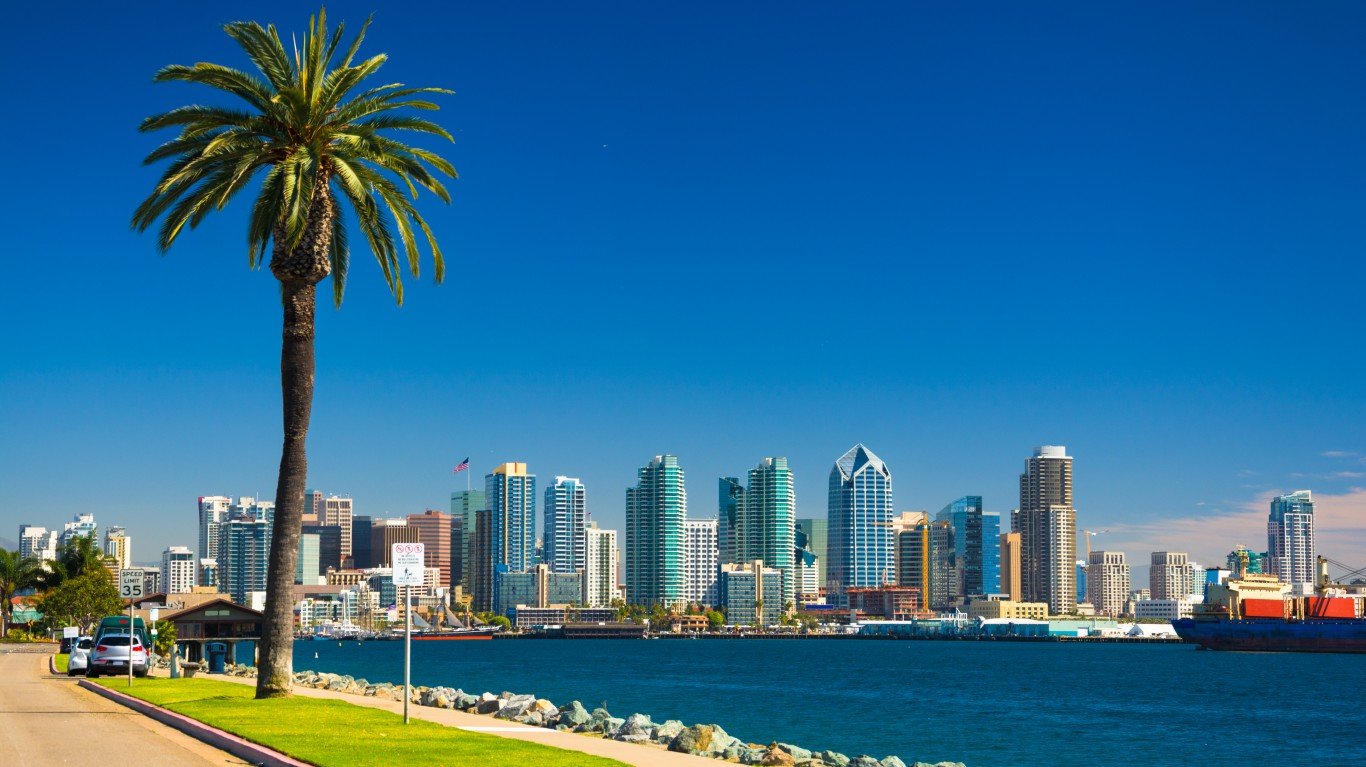
- Est. population growth, 2017 to 2022: +50.8%
33. Elkhorn (Omaha, NE)
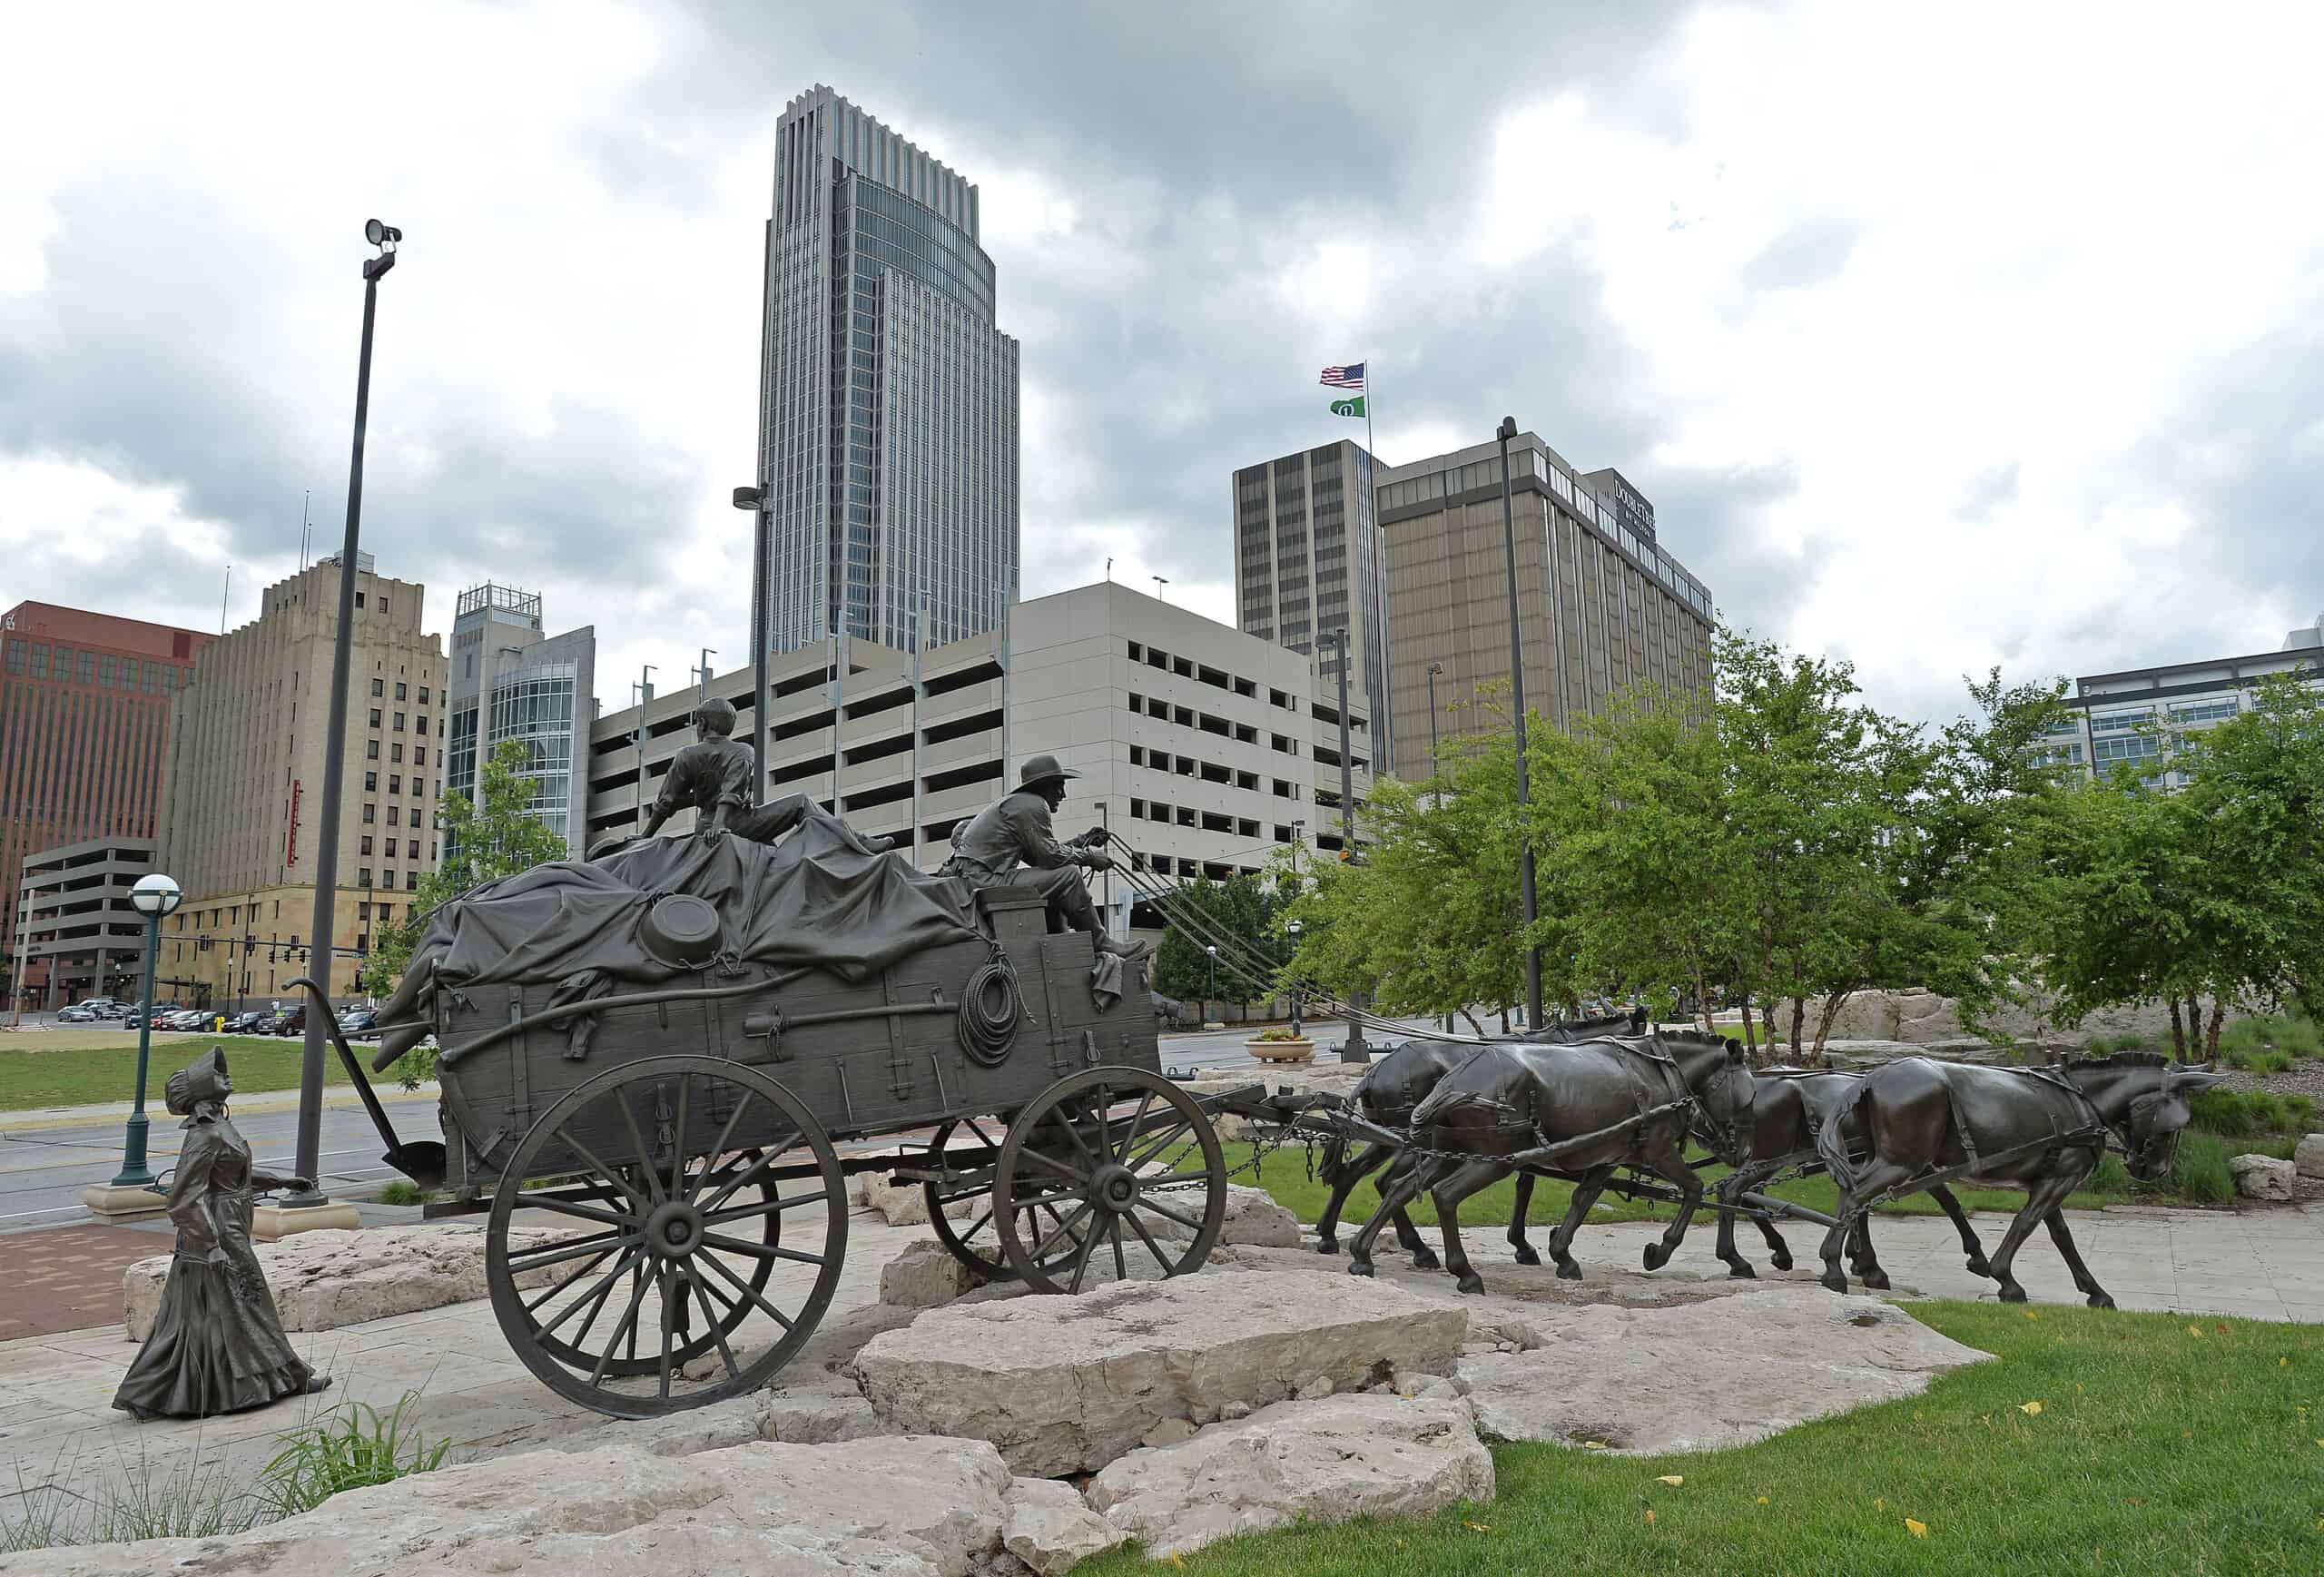
- Est. population growth, 2017 to 2022: +51.3%
32. Chimney Lakes (Jacksonville, FL)
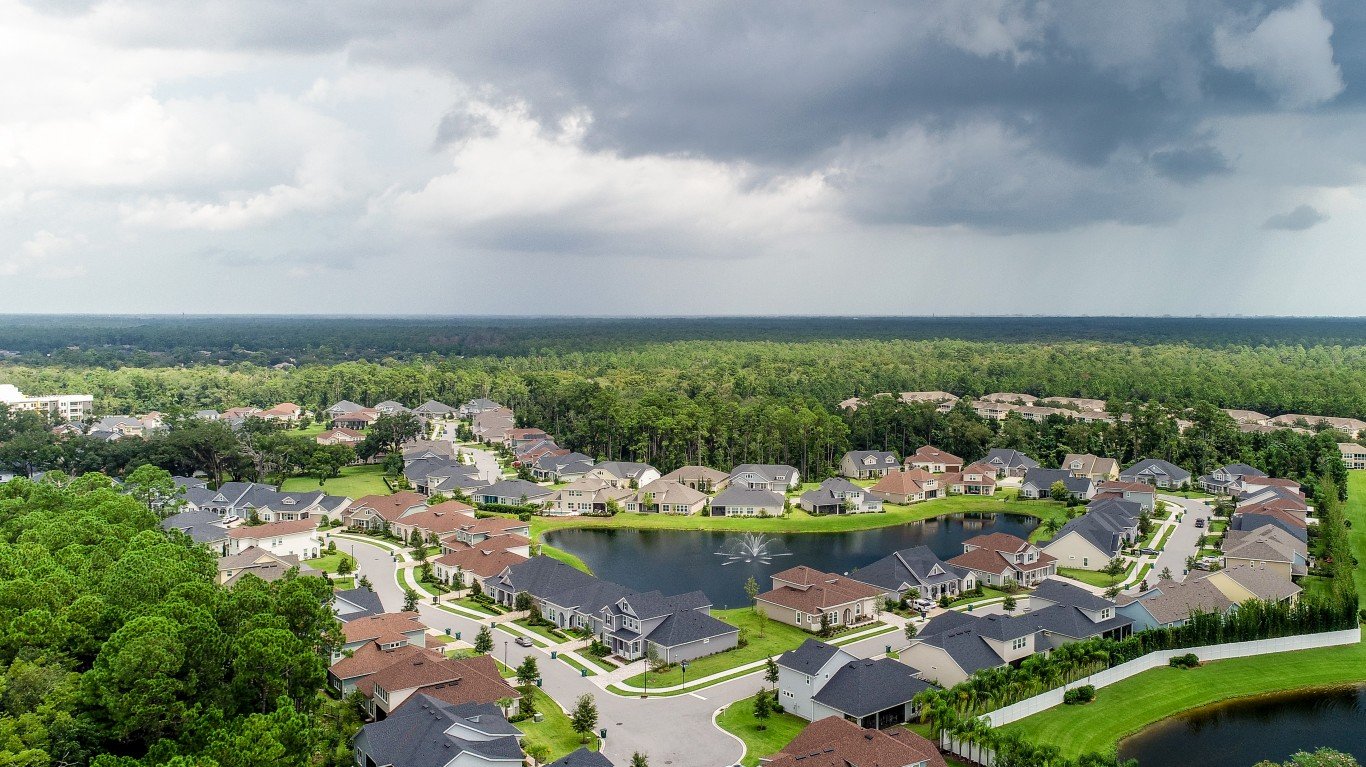
- Est. population growth, 2017 to 2022: +52.5%
31. Old Town (Lansing, MI)
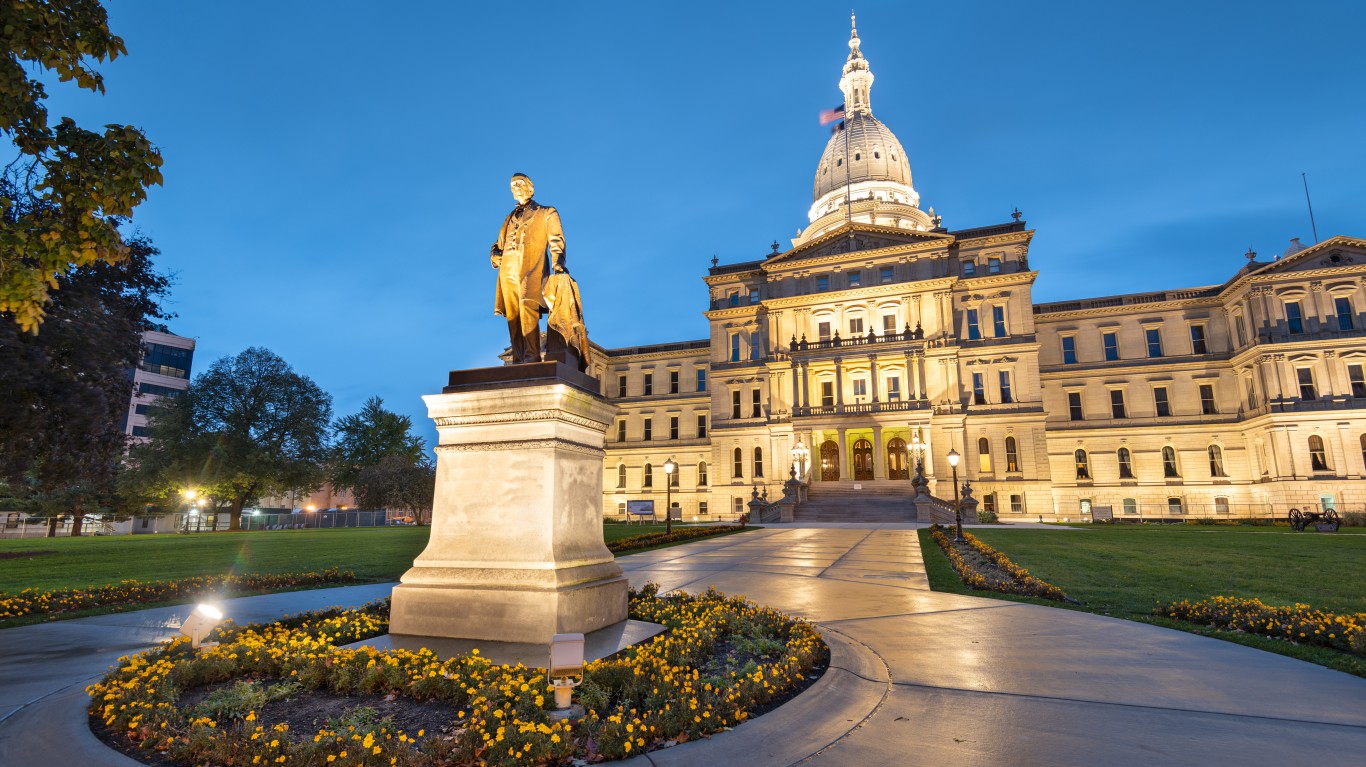
- Est. population growth, 2017 to 2022: +52.7%
30. Richards (Sacramento, CA)
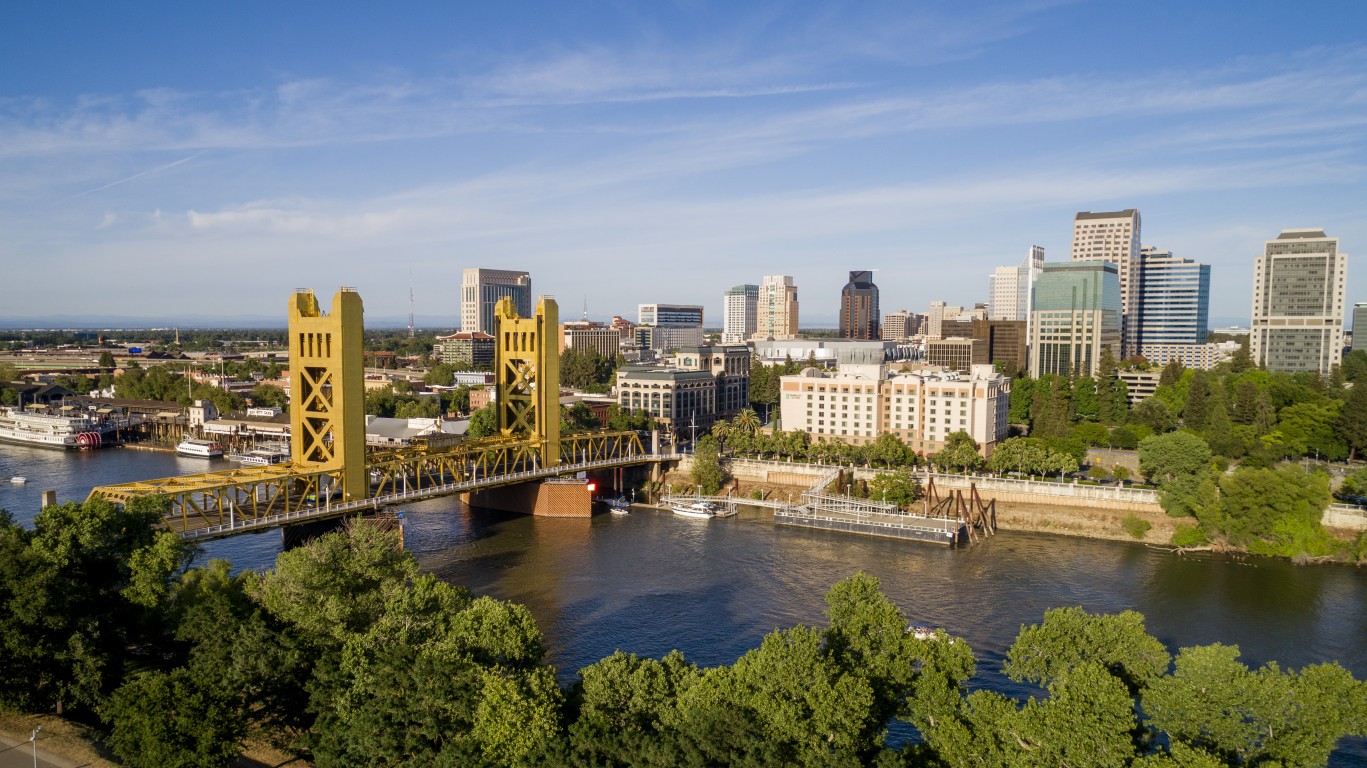
- Est. population growth, 2017 to 2022: +53.4%
29. Lowell (Everett, WA)
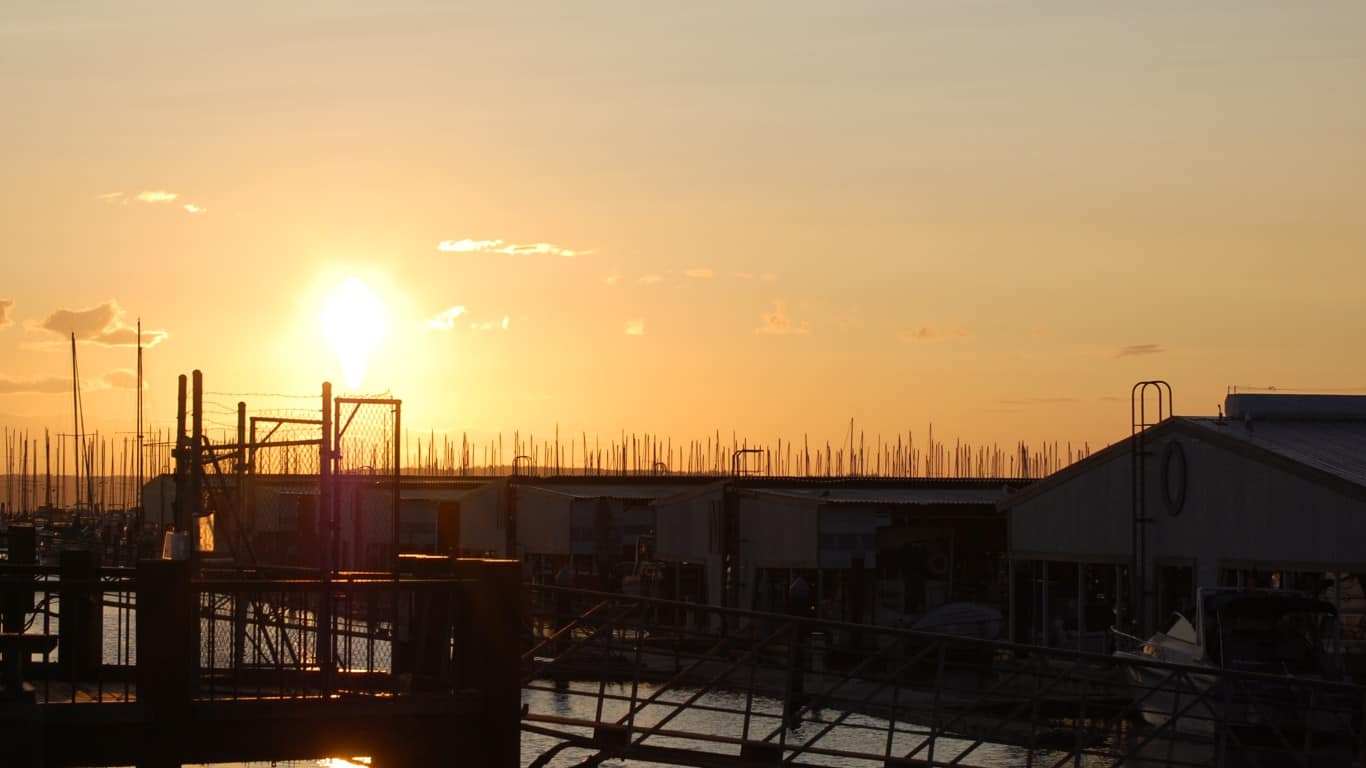
- Est. population growth, 2017 to 2022: +55.5%
28. Strip District (Pittsburgh, PA)
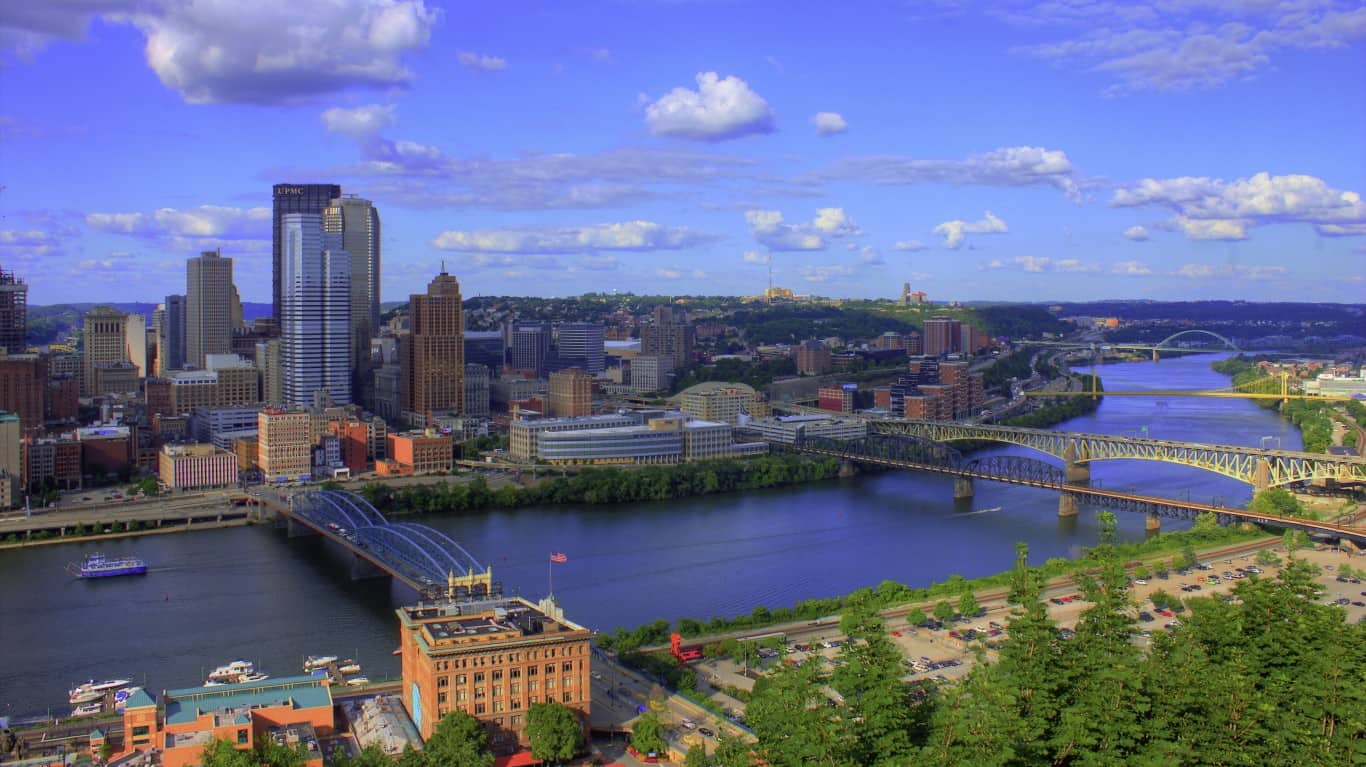
- Est. population growth, 2017 to 2022: +56.0%
27. Oakridge (Garland, TX)
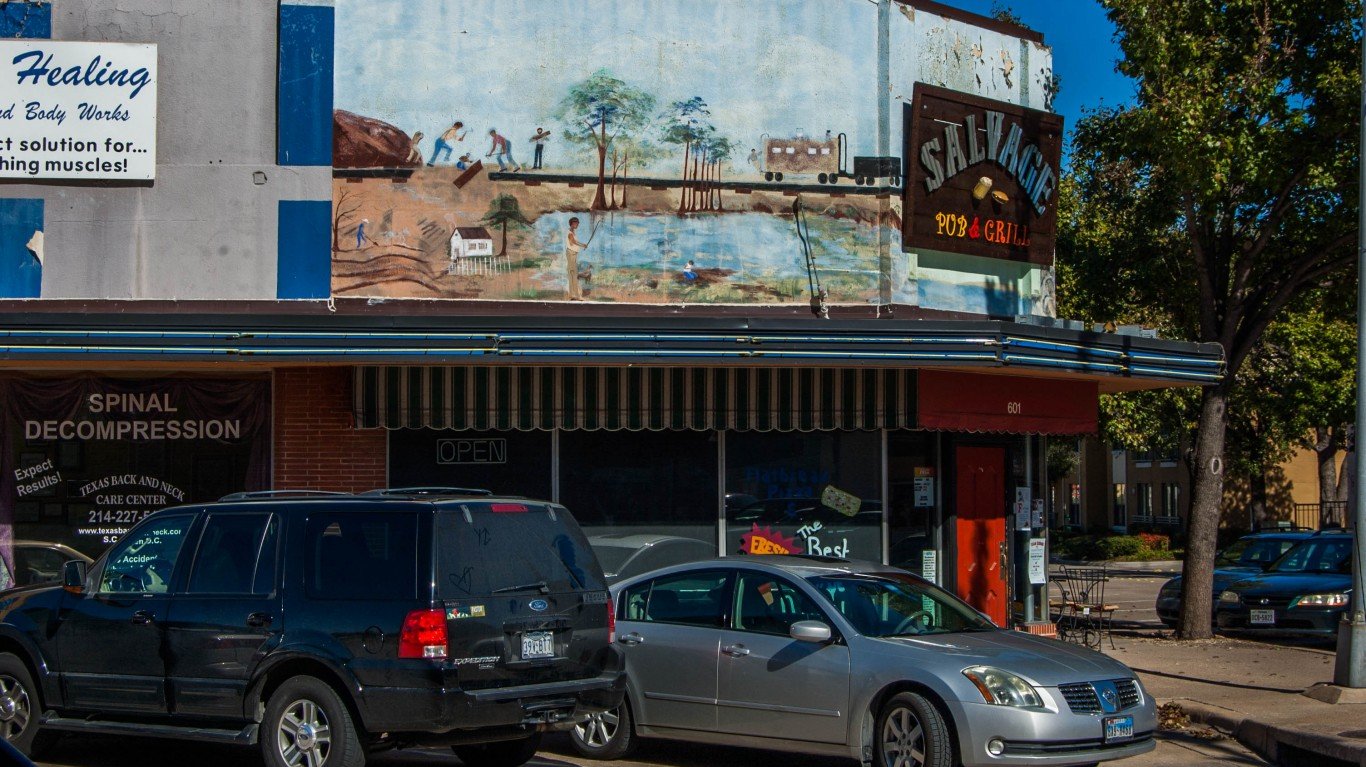
- Est. population growth, 2017 to 2022: +56.2%
26. Italian Village (Columbus, OH)
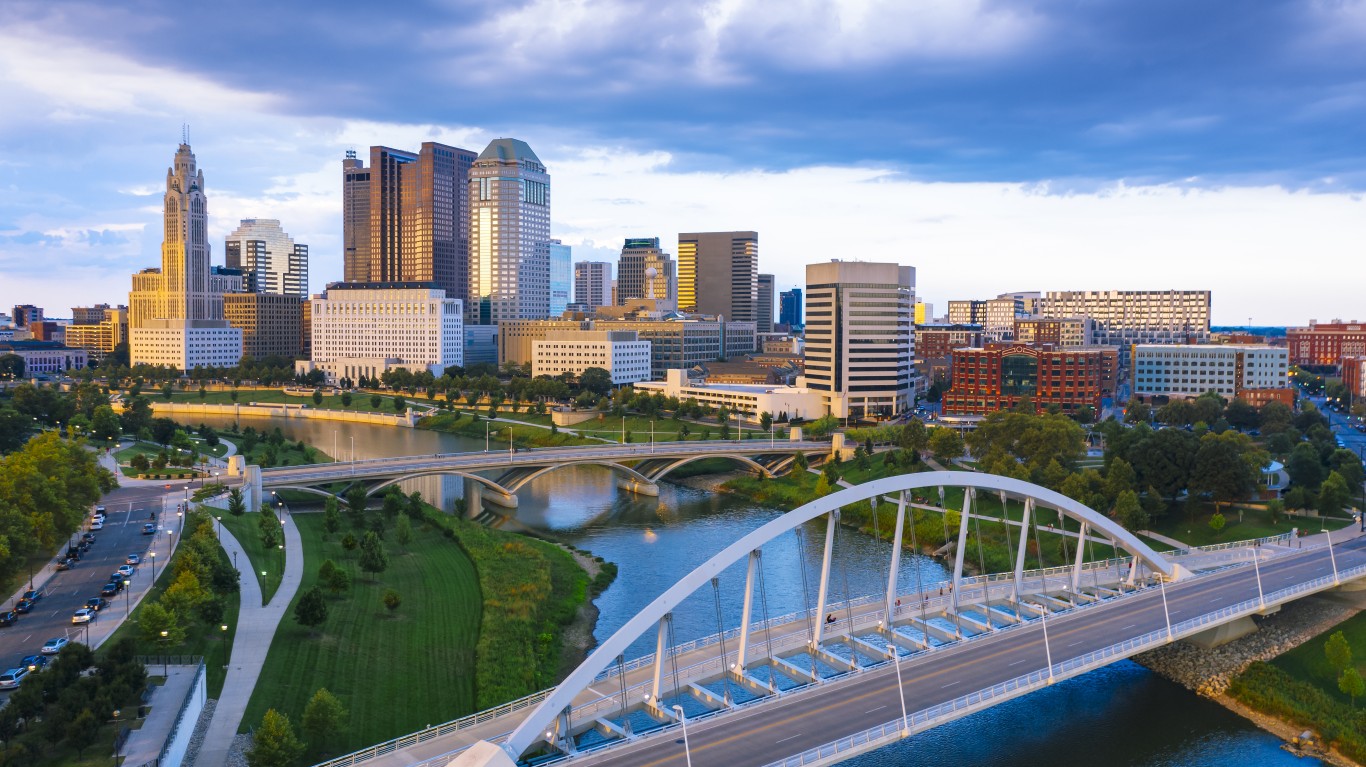
- Est. population growth, 2017 to 2022: +56.3%
25. Produce & Waterfront (Oakland, CA)
- Est. population growth, 2017 to 2022: +56.4%
24. Downtown CBD (Little Rock, AR)
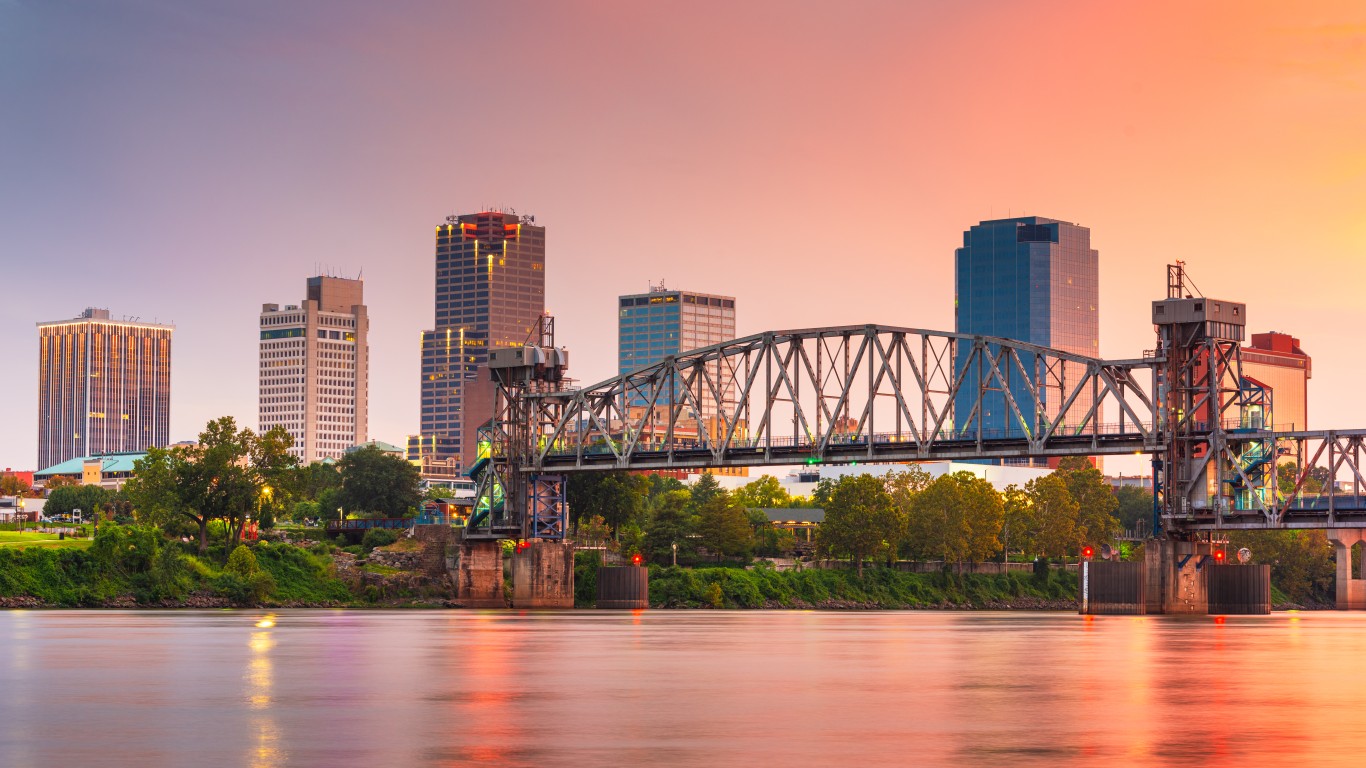
- Est. population growth, 2017 to 2022: +56.4%
23. Eagle Lake (Charlotte, NC)
- Est. population growth, 2017 to 2022: +57.3%
22. Downtown (Saint Paul, MN)
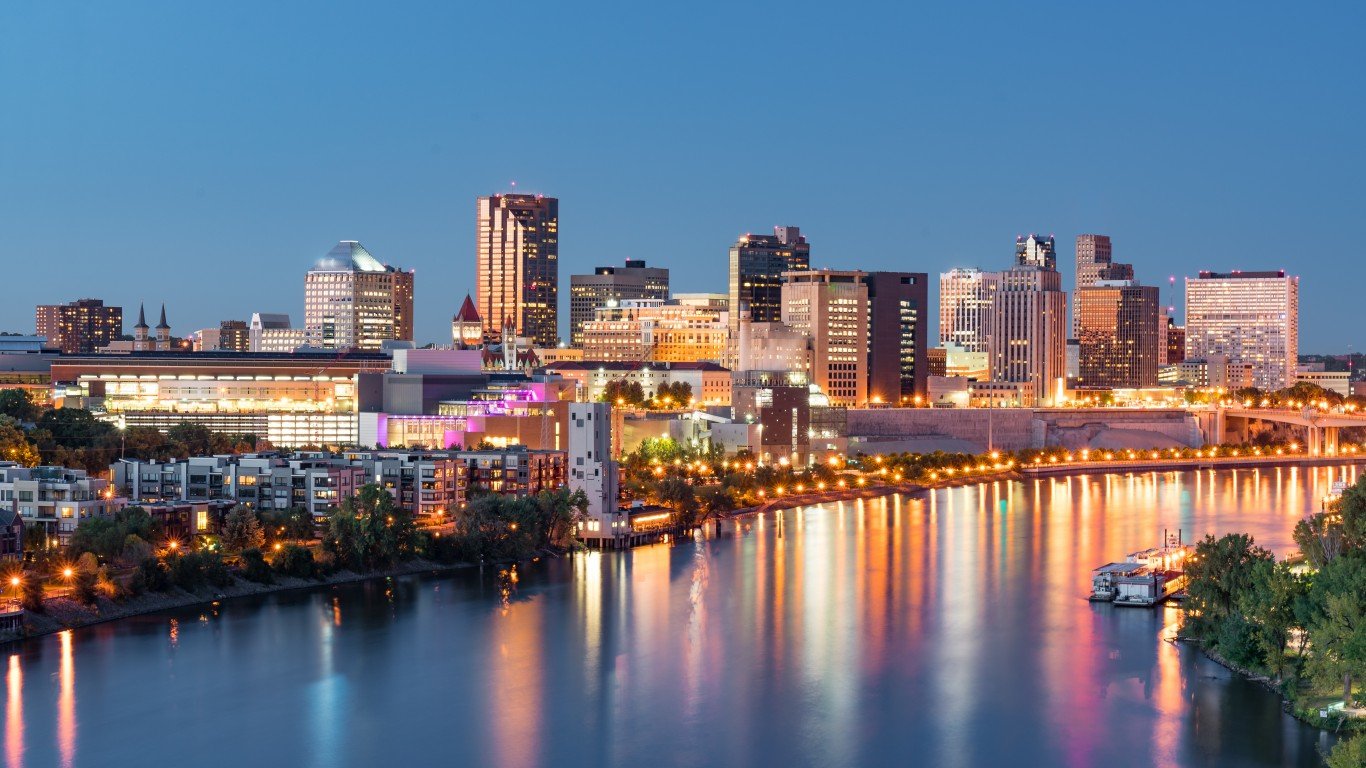
- Est. population growth, 2017 to 2022: +58.4%
21. Red Cedar (East Lansing, MI)
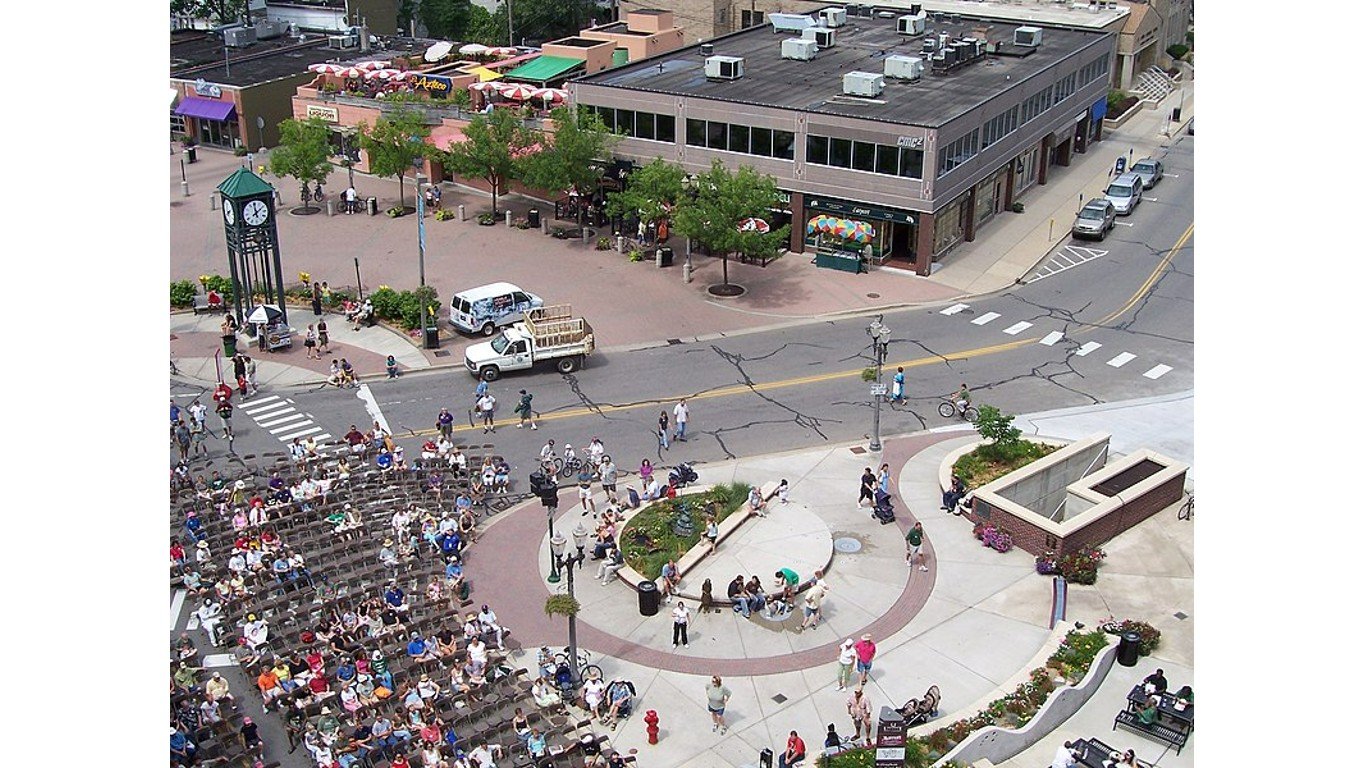
- Est. population growth, 2017 to 2022: +60.6%
20. Old Dayton View (Dayton, OH)
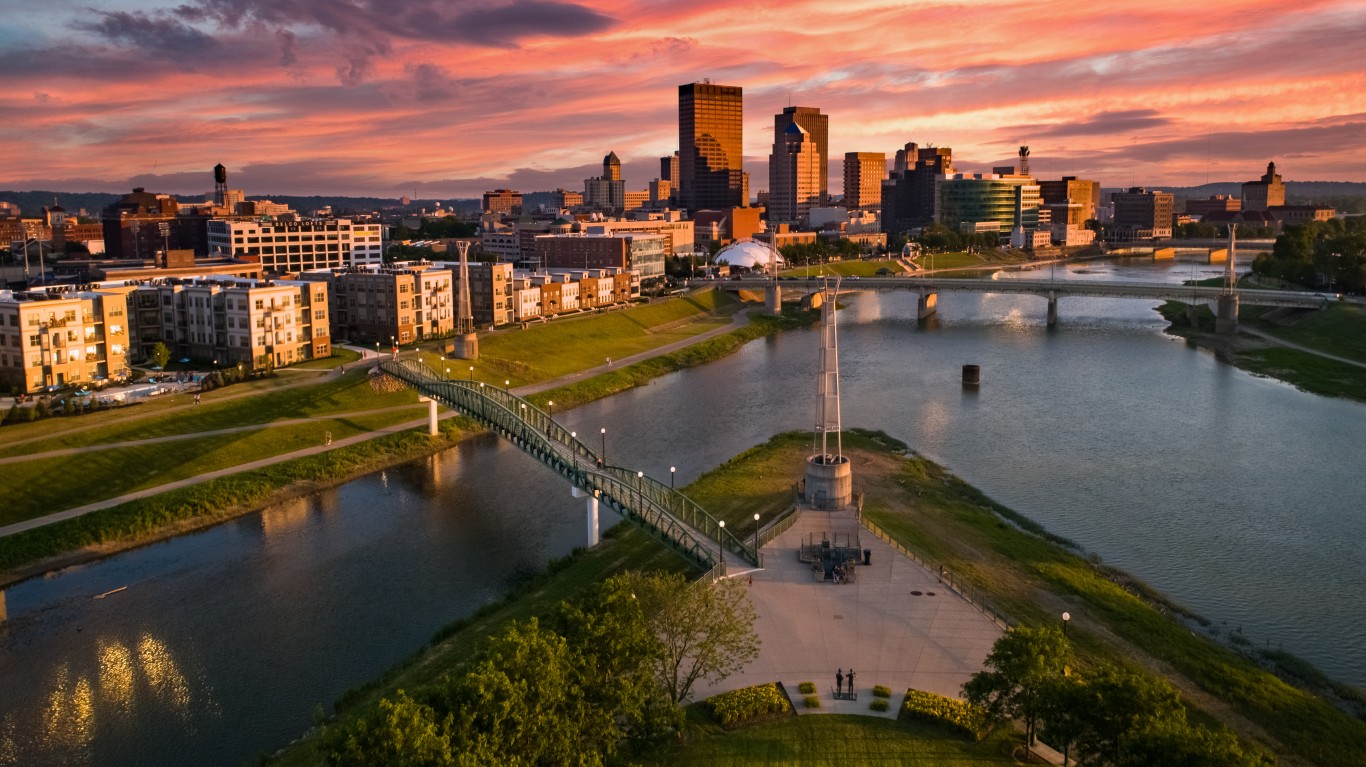
- Est. population growth, 2017 to 2022: +61.4%
19. Melrose (Nashville, TN)
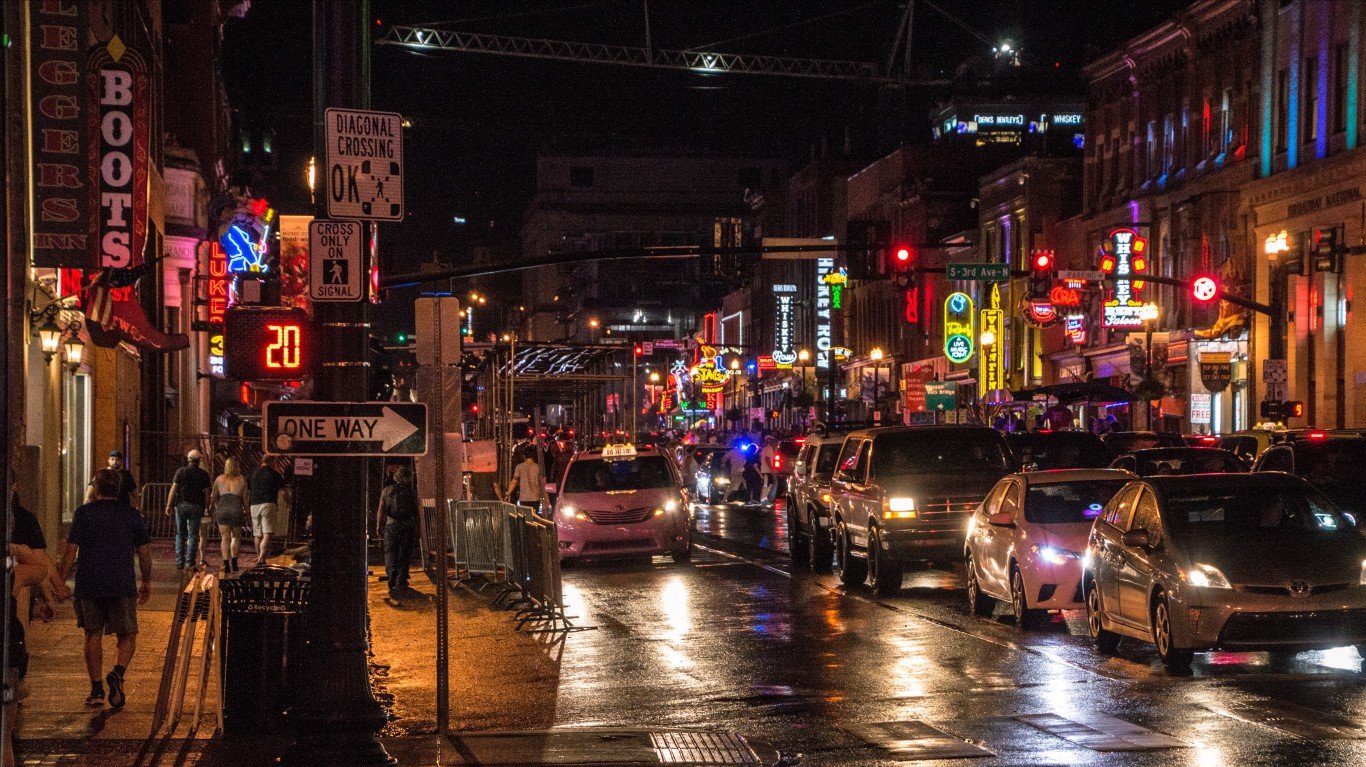
- Est. population growth, 2017 to 2022: +62.3%
18. Downtown (New York, NY)
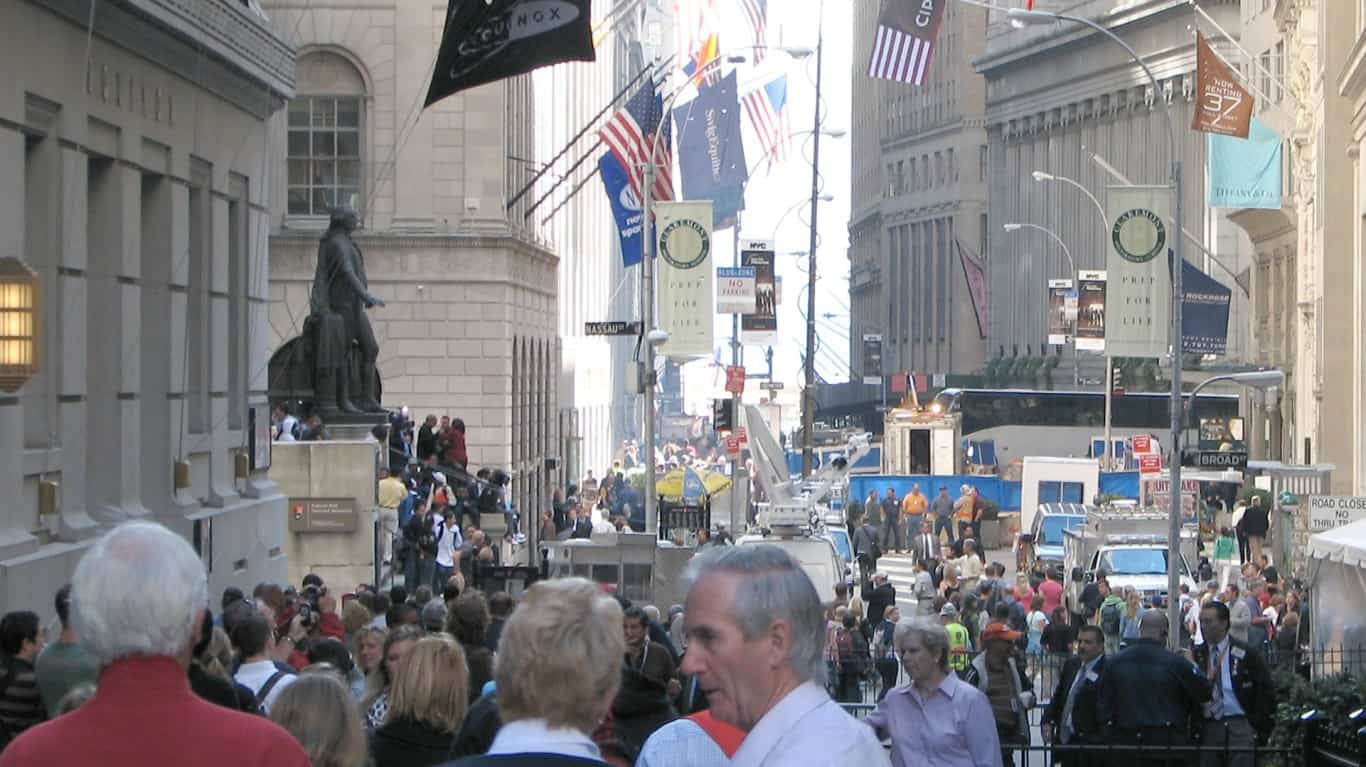
- Est. population growth, 2017 to 2022: +62.7%
17. Dogpatch (San Francisco, CA)
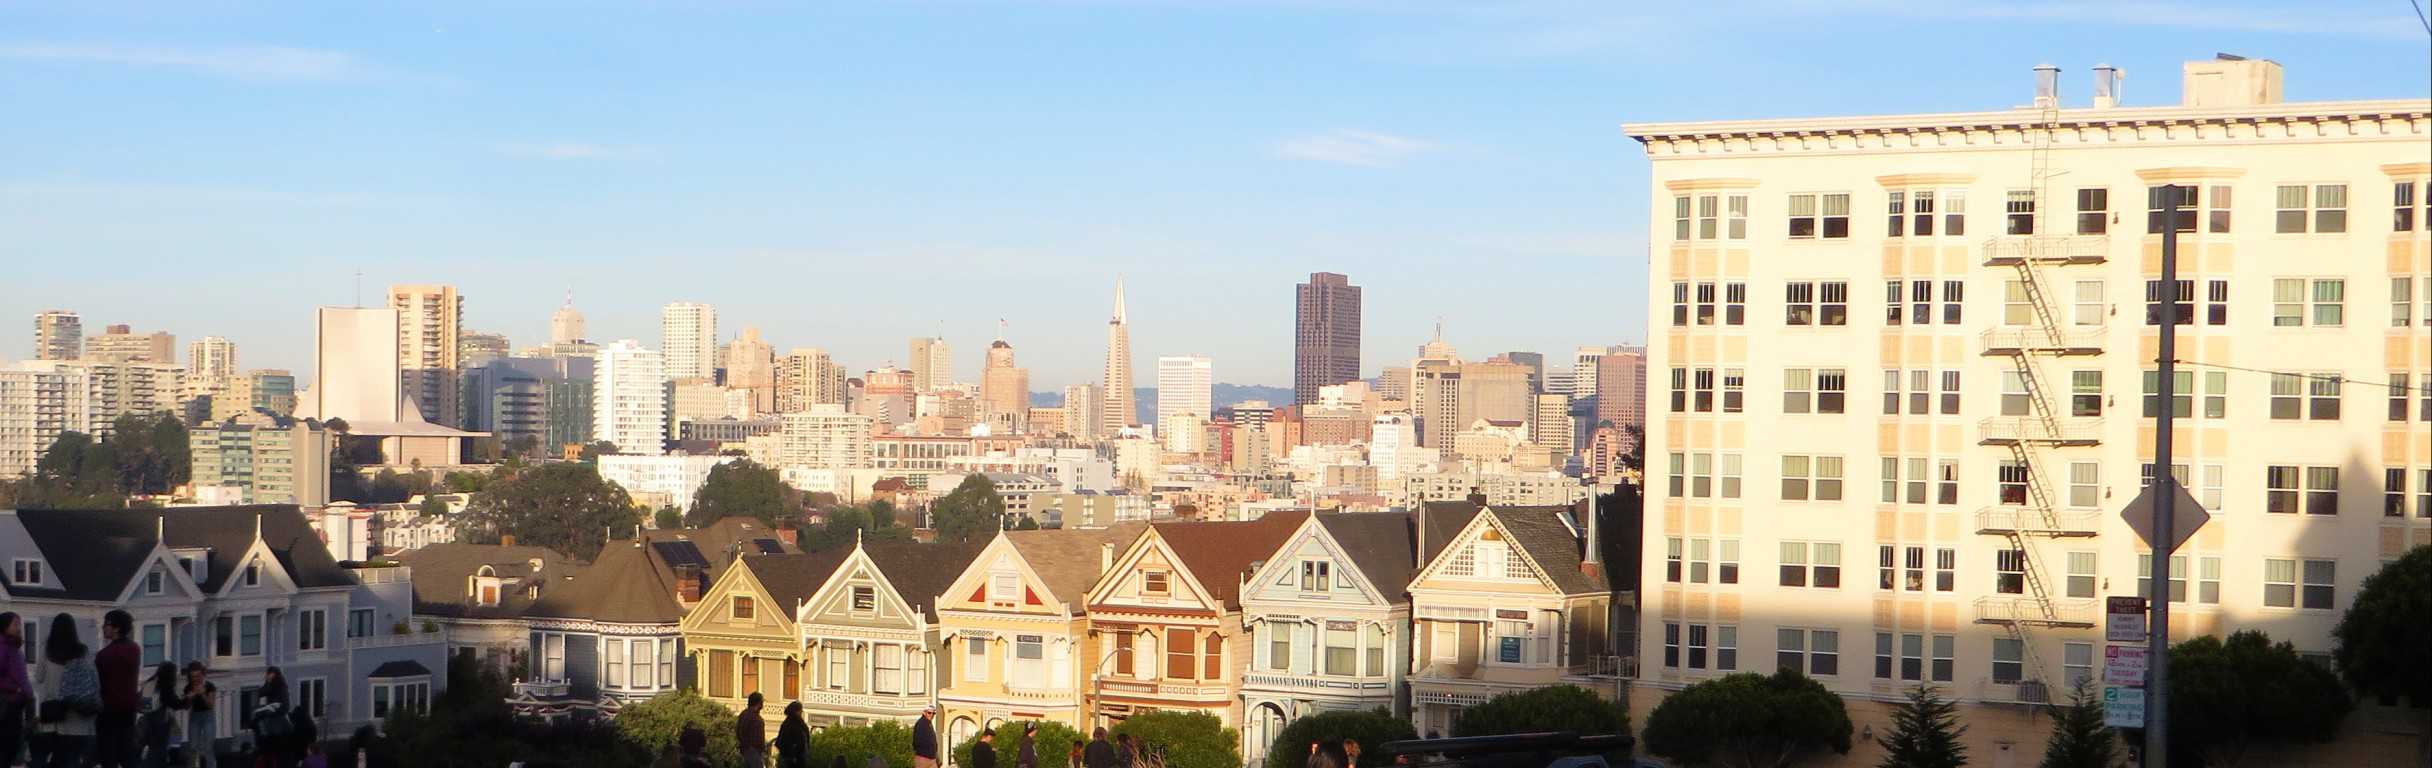
- Est. population growth, 2017 to 2022: +63.0%
16. Jamestown (Augusta, GA)
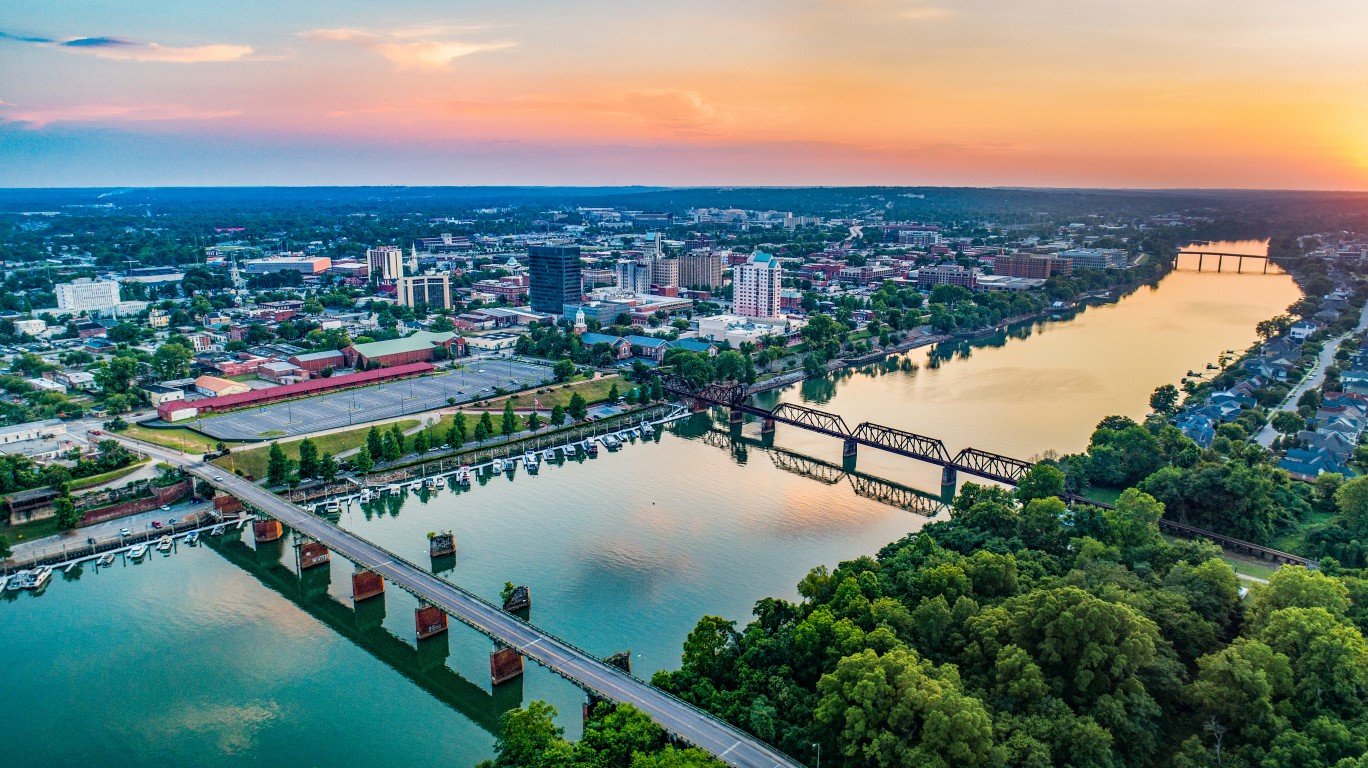
- Est. population growth, 2017 to 2022: +63.1%
15. Downtown (Redwood City, CA)
- Est. population growth, 2017 to 2022: +63.7%
14. Minnetex (Houston, TX)
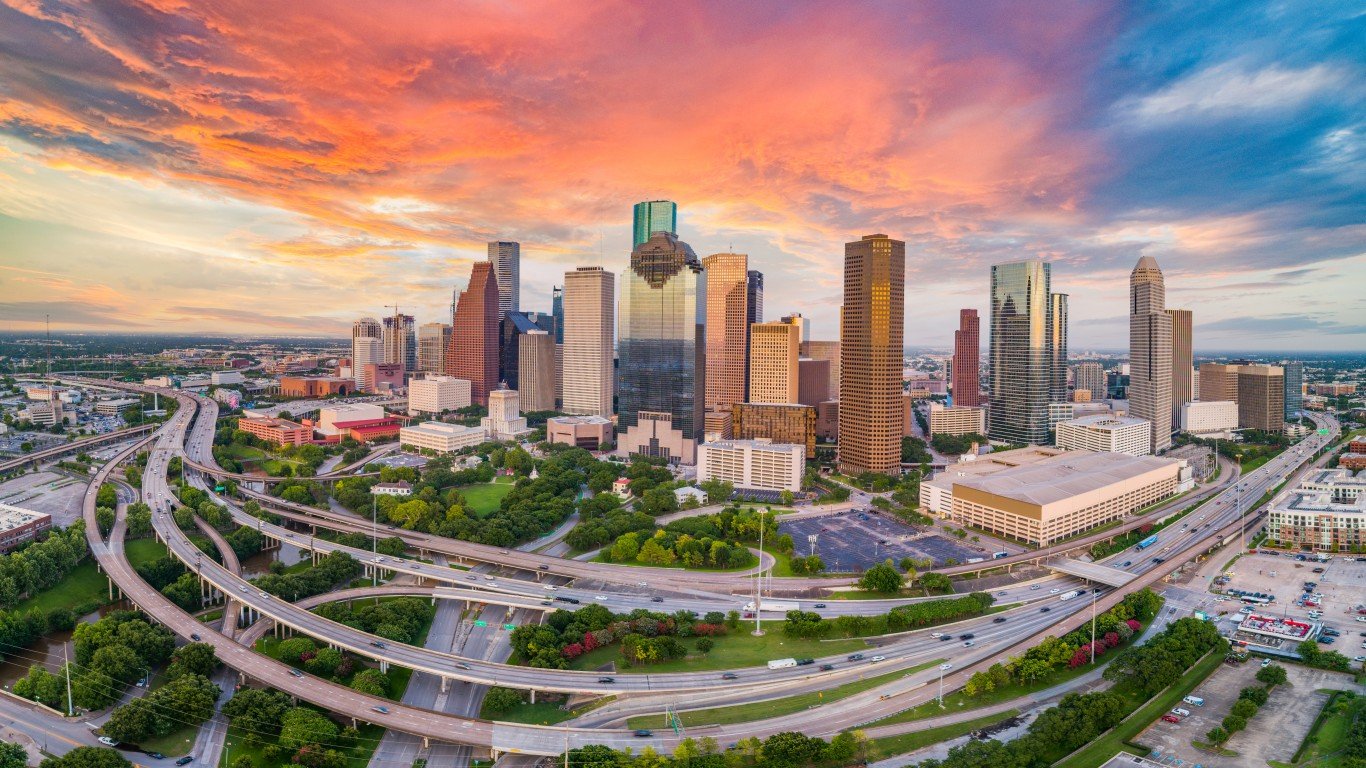
- Est. population growth, 2017 to 2022: +66.2%
13. Hunters Point (San Francisco, CA)
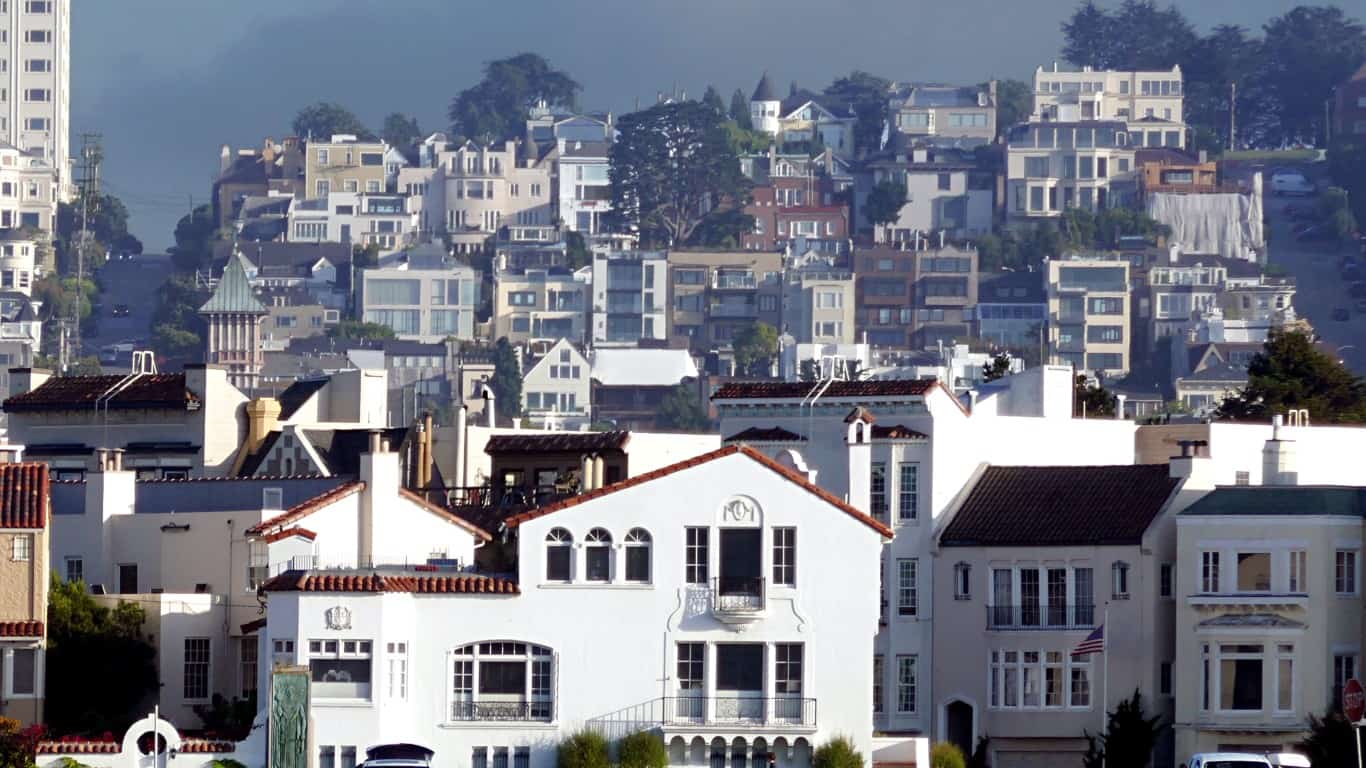
- Est. population growth, 2017 to 2022: +74.0%
12. Cottage District (Oklahoma City, OK)
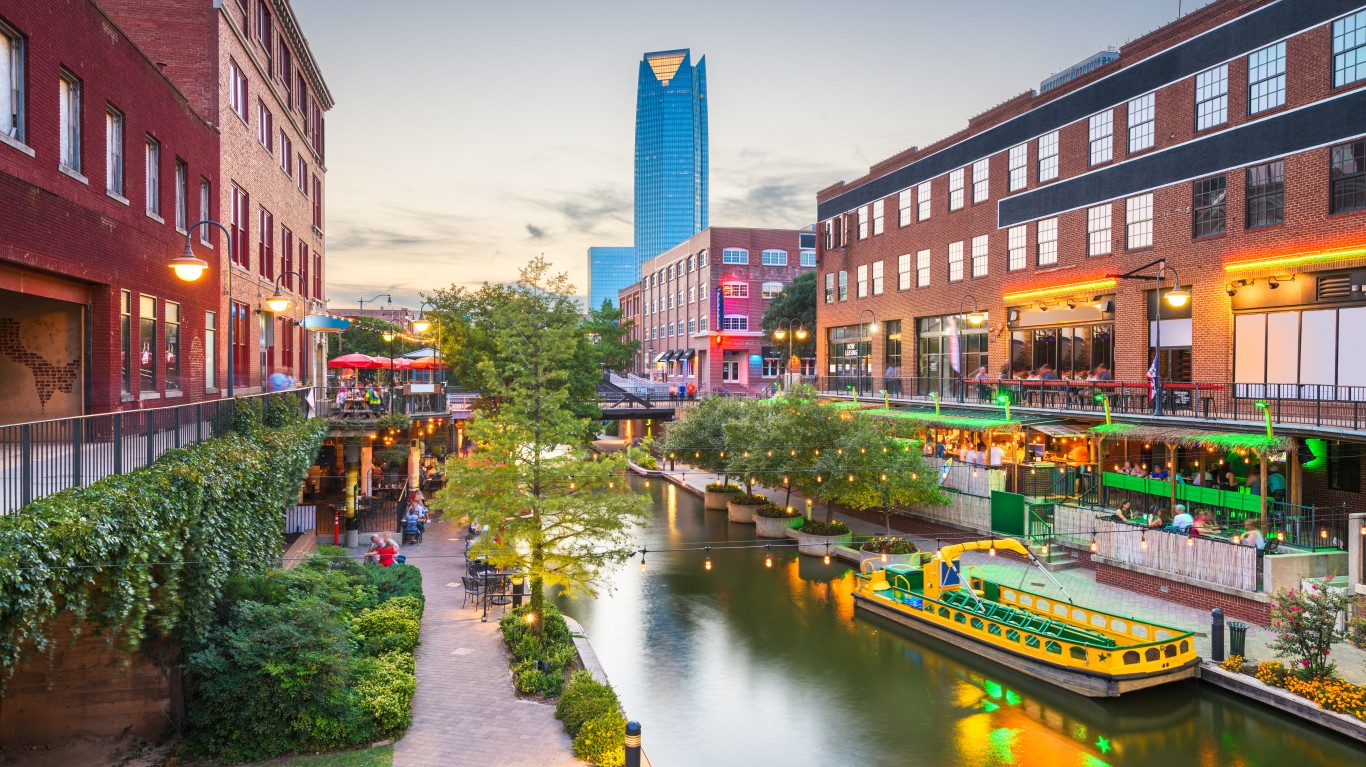
- Est. population growth, 2017 to 2022: +74.5%
11. Midtown (Atlanta, GA)
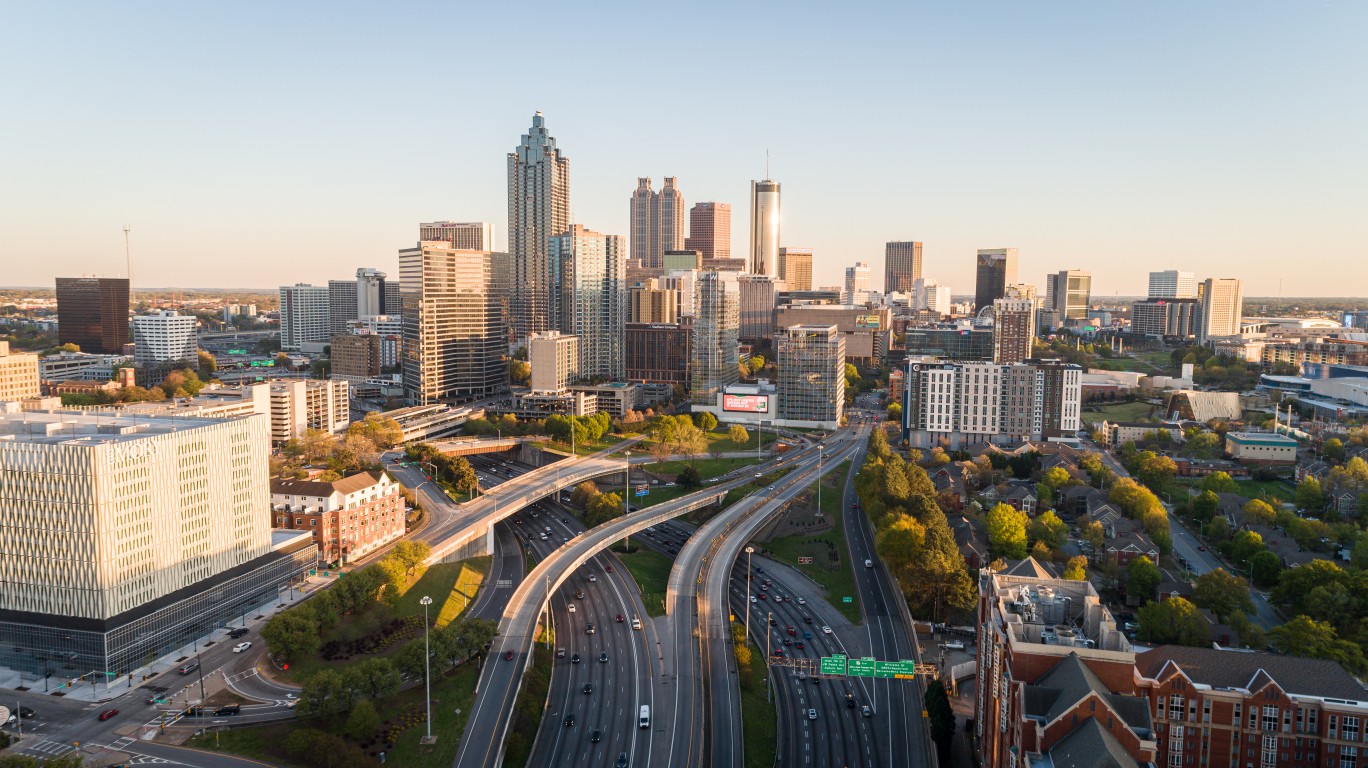
- Est. population growth, 2017 to 2022: +75.2%
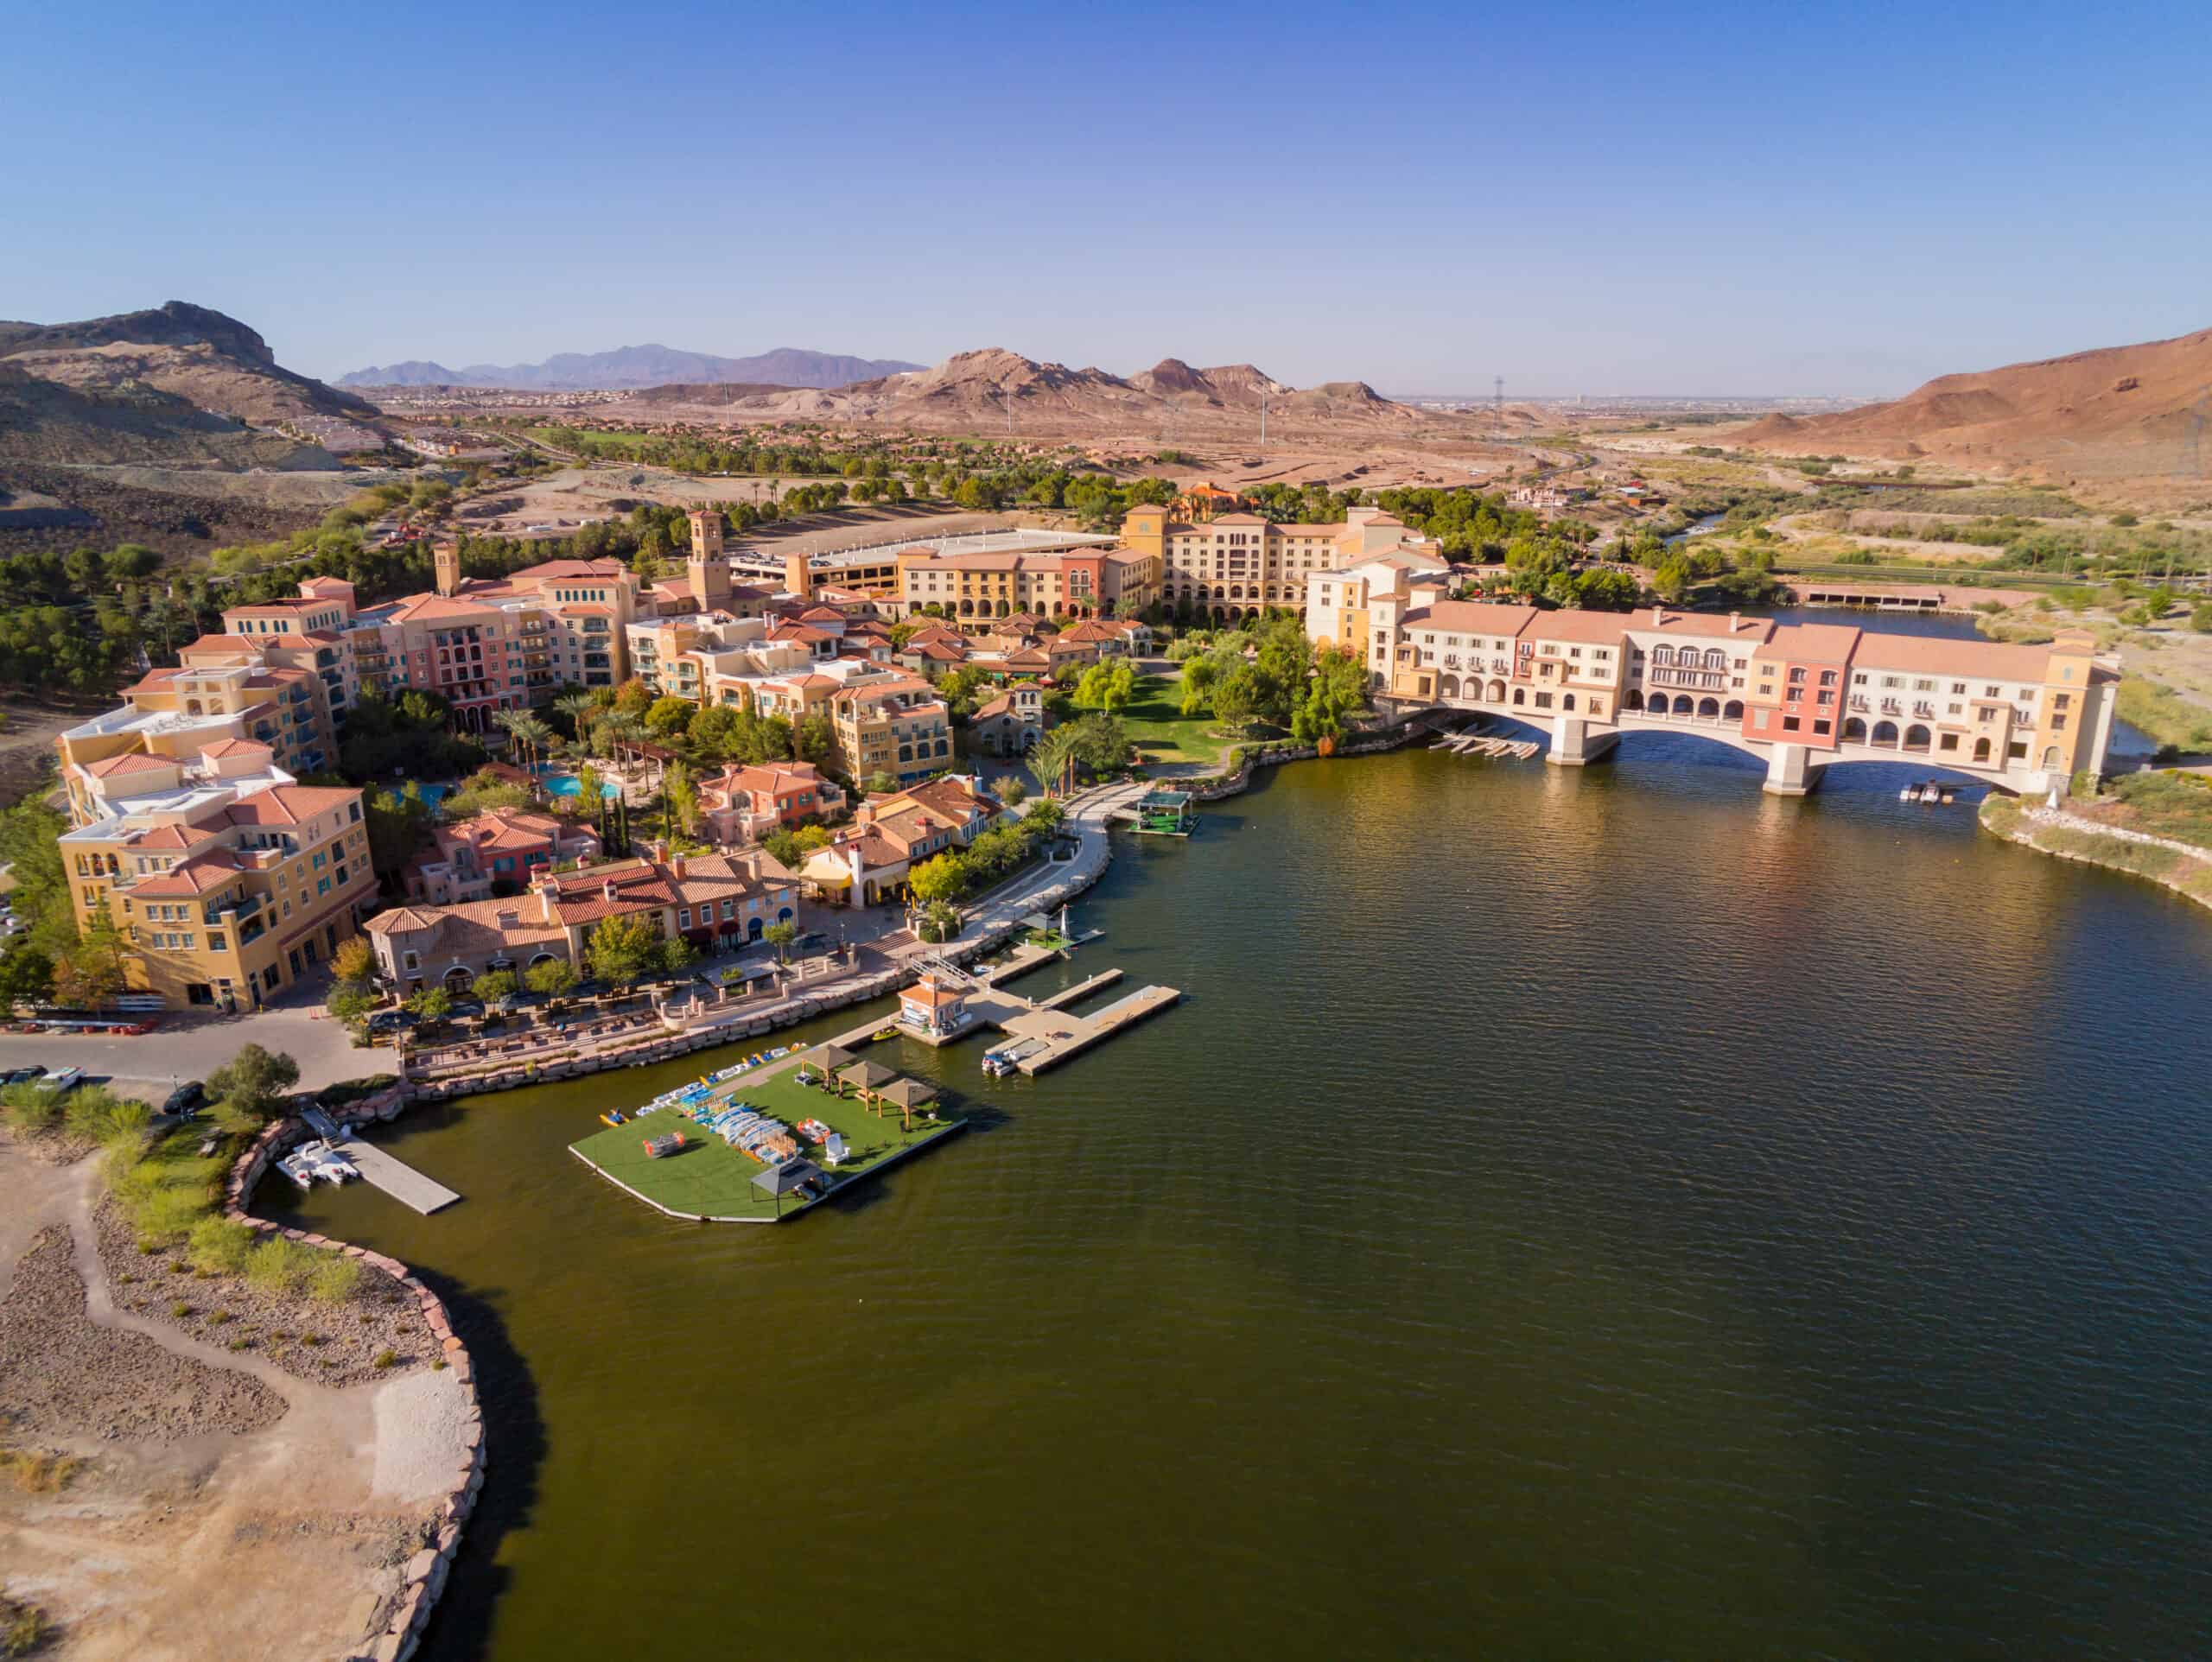
10. Lake Las Vegas (Henderson, NV)
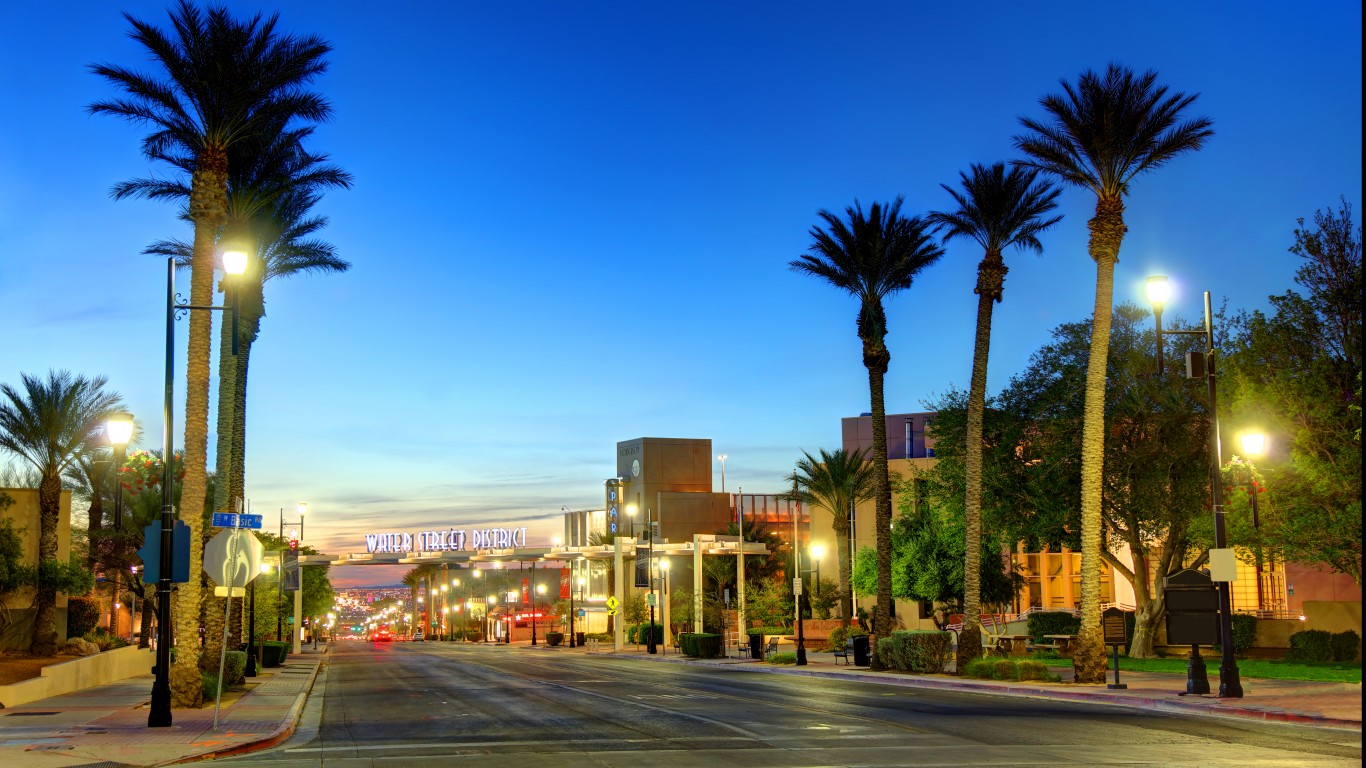
- Est. population growth, 2017 to 2022: +80.3%
9. Optimist Park (Charlotte, NC)
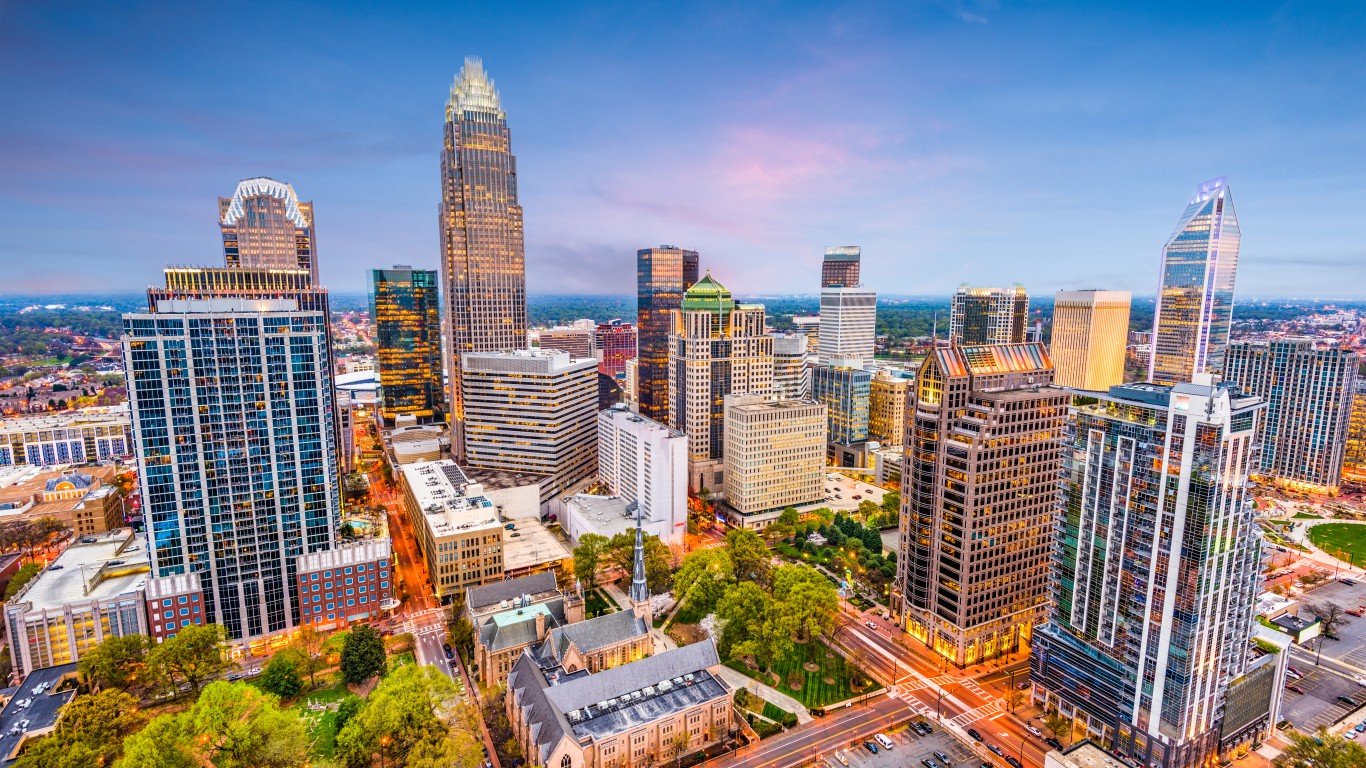
- Est. population growth, 2017 to 2022: +81.2%
8. Civic Center (Denver, CO)
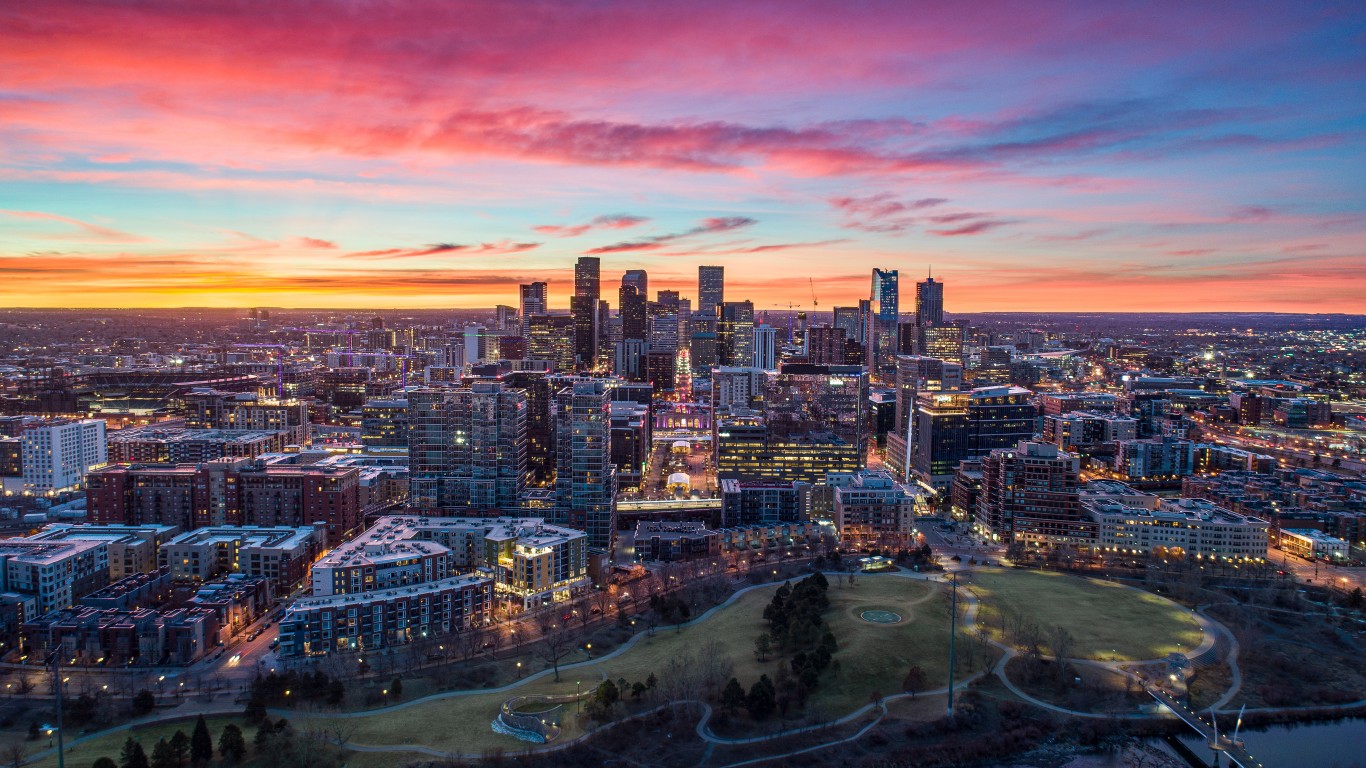
- Est. population growth, 2017 to 2022: +82.8%
7. Stateway Gardens (Chicago, IL)
- Est. population growth, 2017 to 2022: +86.6%
6. Central Business District (Provo, UT)
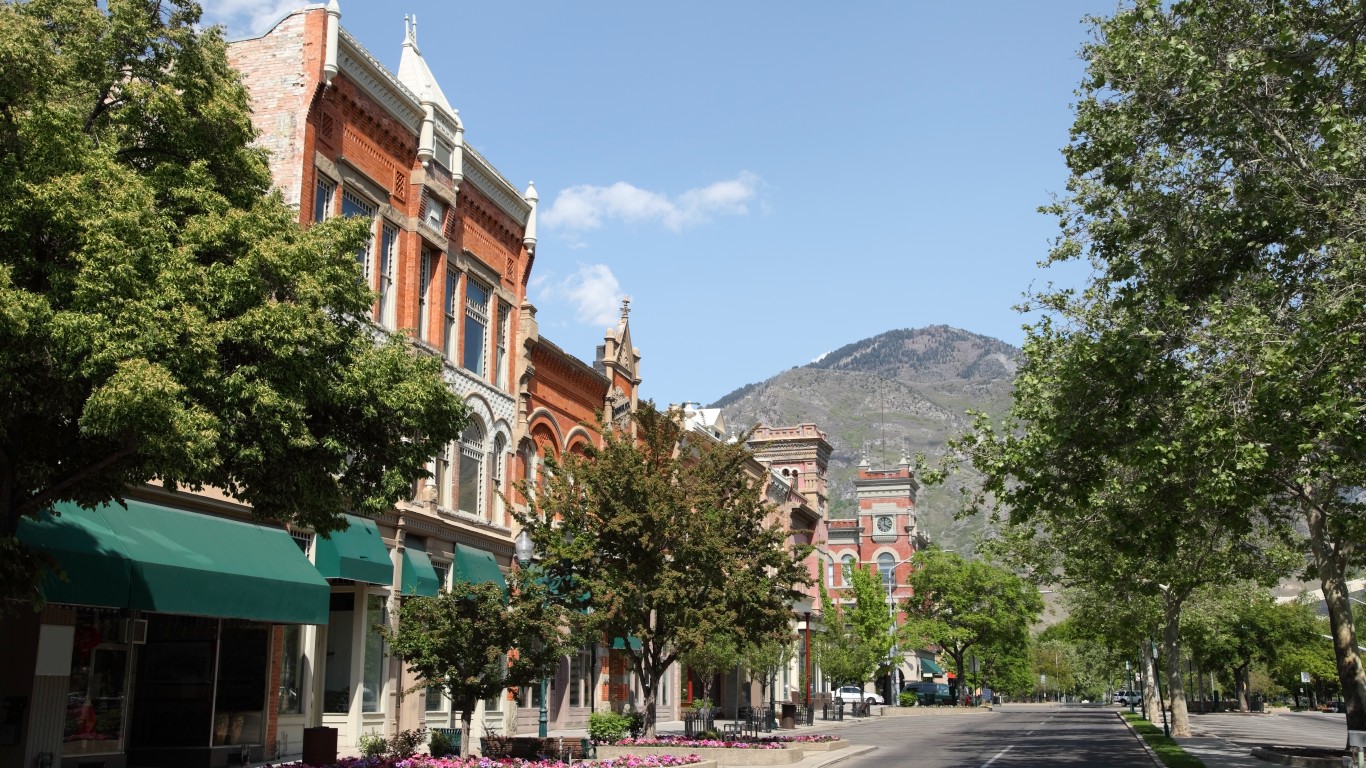
- Est. population growth, 2017 to 2022: +86.8%
5. Triangle State (Austin, TX)
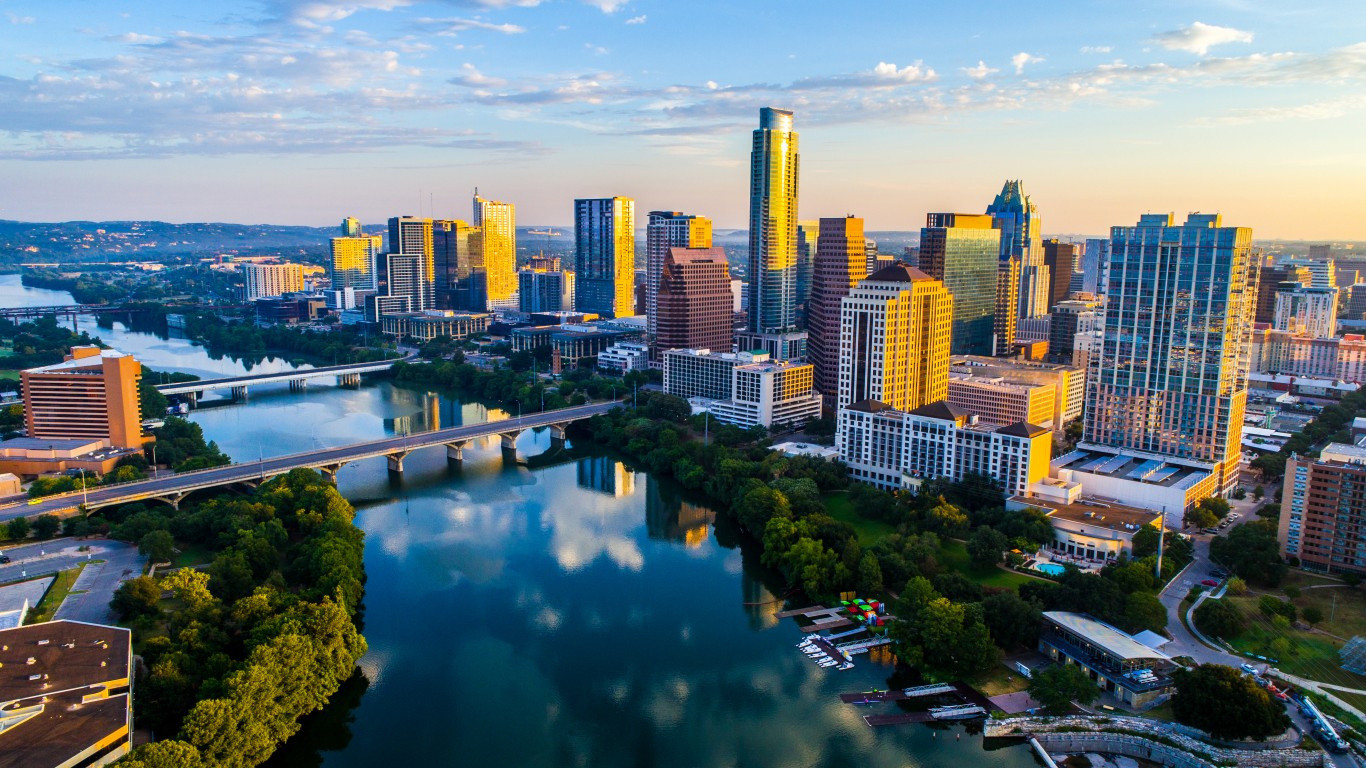
- Est. population growth, 2017 to 2022: +89.5%
4. Shiloh (Morrisville, NC)
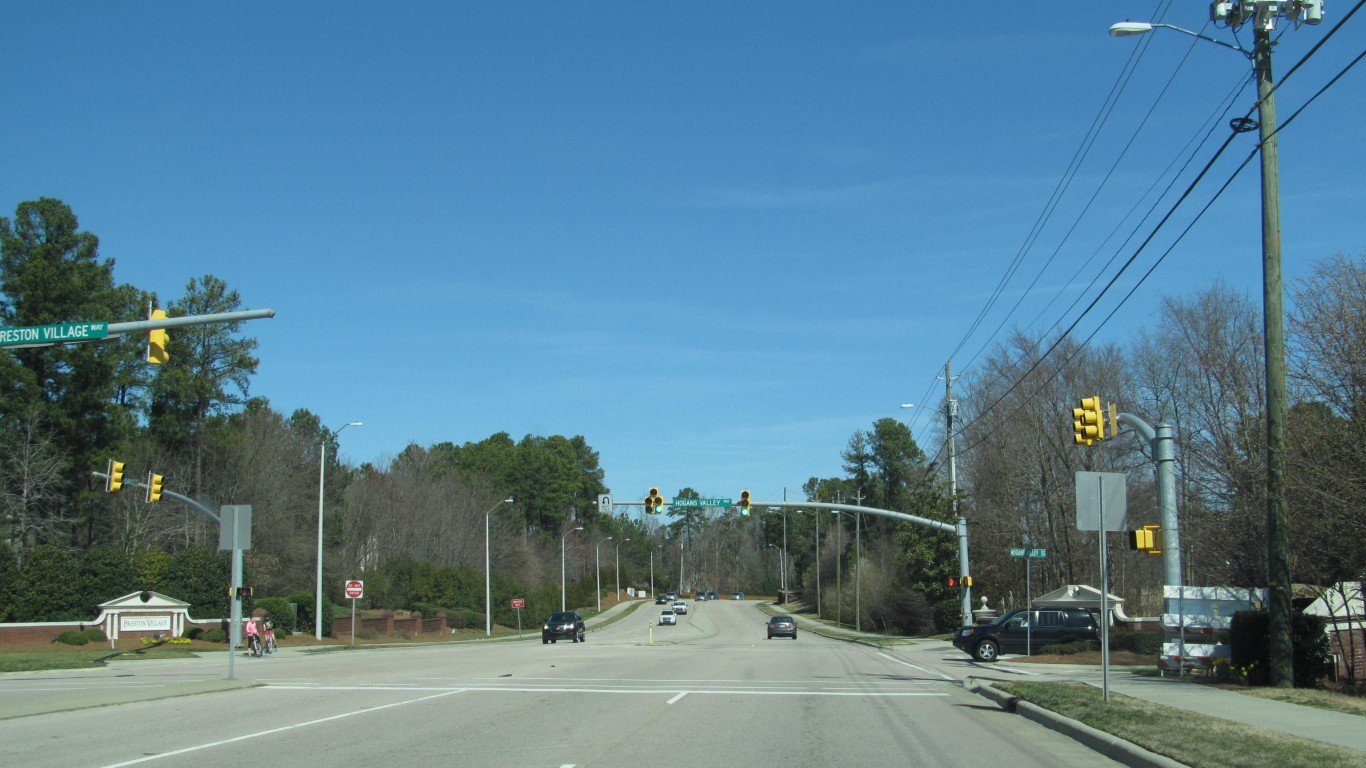
- Est. population growth, 2017 to 2022: +96.4%
3. Roosevelt Island (New York, NY)
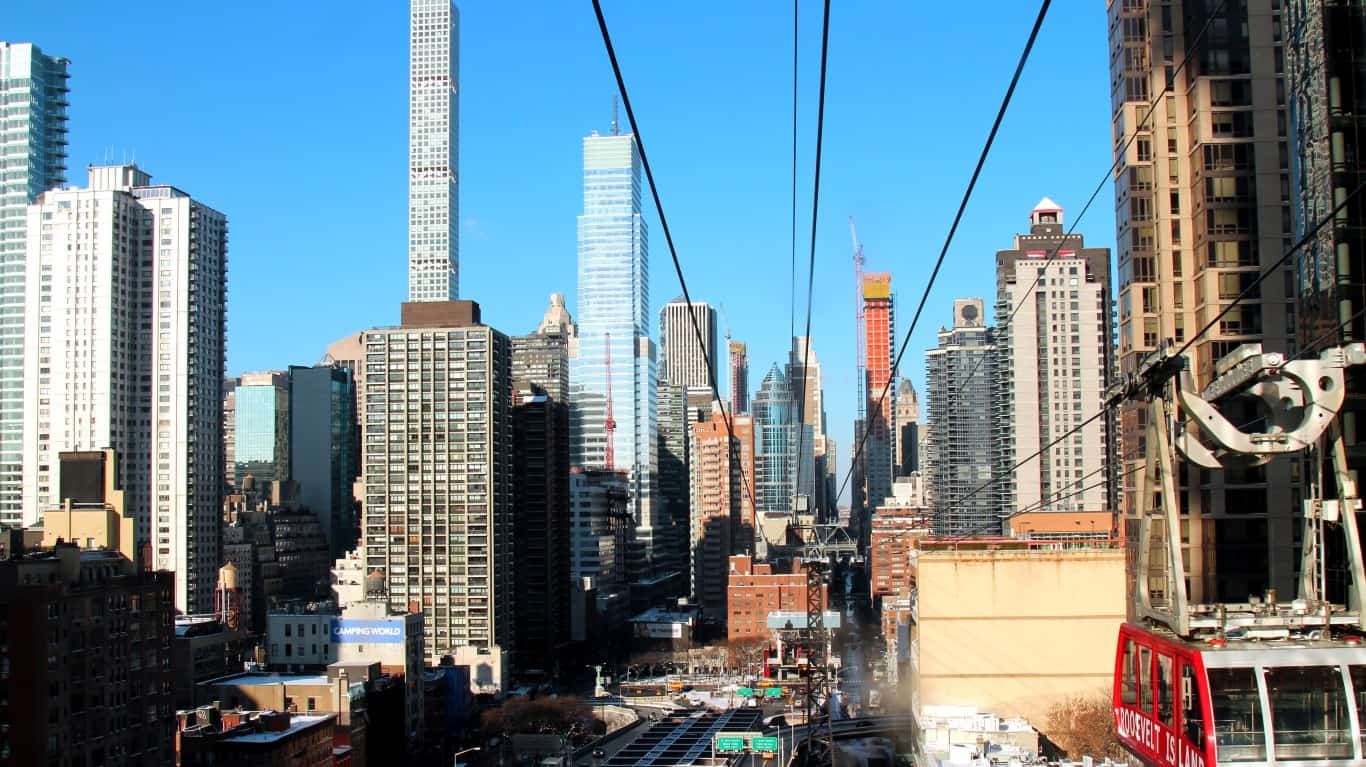
- Est. population growth, 2017 to 2022: +101.9%
2. Downtown (Tampa, FL)
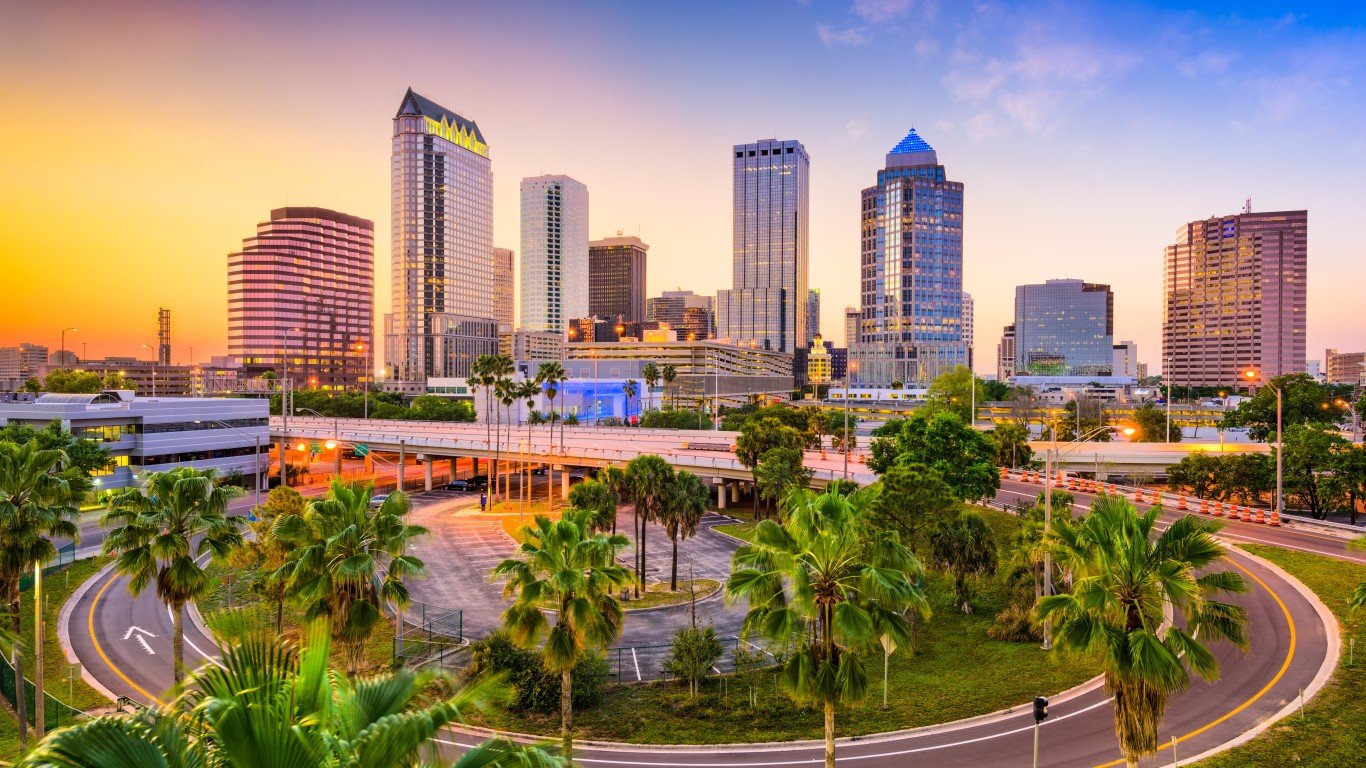
- Est. population growth, 2017 to 2022: +127.3%
1. Kyle Canyon (Las Vegas, NV)
- Est. population growth, 2017 to 2022: +176.0%