
On March 26, 2024, the Francis Scott Key Bridge in Baltimore collapsed after a cargo ship collided with the bridge. The cargo ship, known as the Dali, veered off course after temporarily losing power. A mayday call sent out before the collision prevented any further traffic from traveling on the bridge, but six construction workers were killed.
The Francis Scott Key Bridge in Baltimore was built in 1977. Although Baltimore is one of the cities with the oldest bridges, the average age of a bridge in Baltimore is 52 years. The Francis Scott Key Bridge was nearing 50 years old, but it was in fair condition compared to some of the oldest bridges in the USA. (To read about other historical structures, check out The Oldest Hotel in Each American State.)
Many types of structures have influenced human settlement throughout history and bridges have significantly impacted civilizations since ancient times. Even though the United States is home to many historical bridges, such as the Frankford Avenue Bridge in Philadelphia, the oldest bridges in the world are located outside the U.S., in countries such as Greece, China, and Spain.
Nowadays, bridges are built to allow for travel over obstacles such as bodies of water or railroads. They can also improve traffic conditions and increase efficiency, especially in larger cities. However, many of the oldest bridges still standing are historical landmarks and some of the newer bridges are engineering marvels.
There are many cities in the country with a significant number of old bridges, but the city with the oldest bridges is Camden, New Jersey.
To determine the cities with the oldest bridges, 24/7 Tempo reviewed data on highway bridge attributes from the National Bridge Inventory of the U.S. Department of Transportation’s Bureau of Transportation Statistics. Cities were ranked based on the average age of all bridges within city boundaries as of 2024, weighted by bridge surface area. Only cities with at least 25 bridges and 40,000 residents were considered. Data on the percentage of bridge surface area in “poor” condition is based on “good,” “fair,” and “poor” classifications from the Federal Highway Administration. Supplemental data on population is from the U.S. Census Bureau’s American Community Survey and are five-year estimates for the year 2022. Bridge locations were aggregated to the city level using spatial boundary definitions from the U.S. Census Bureau.
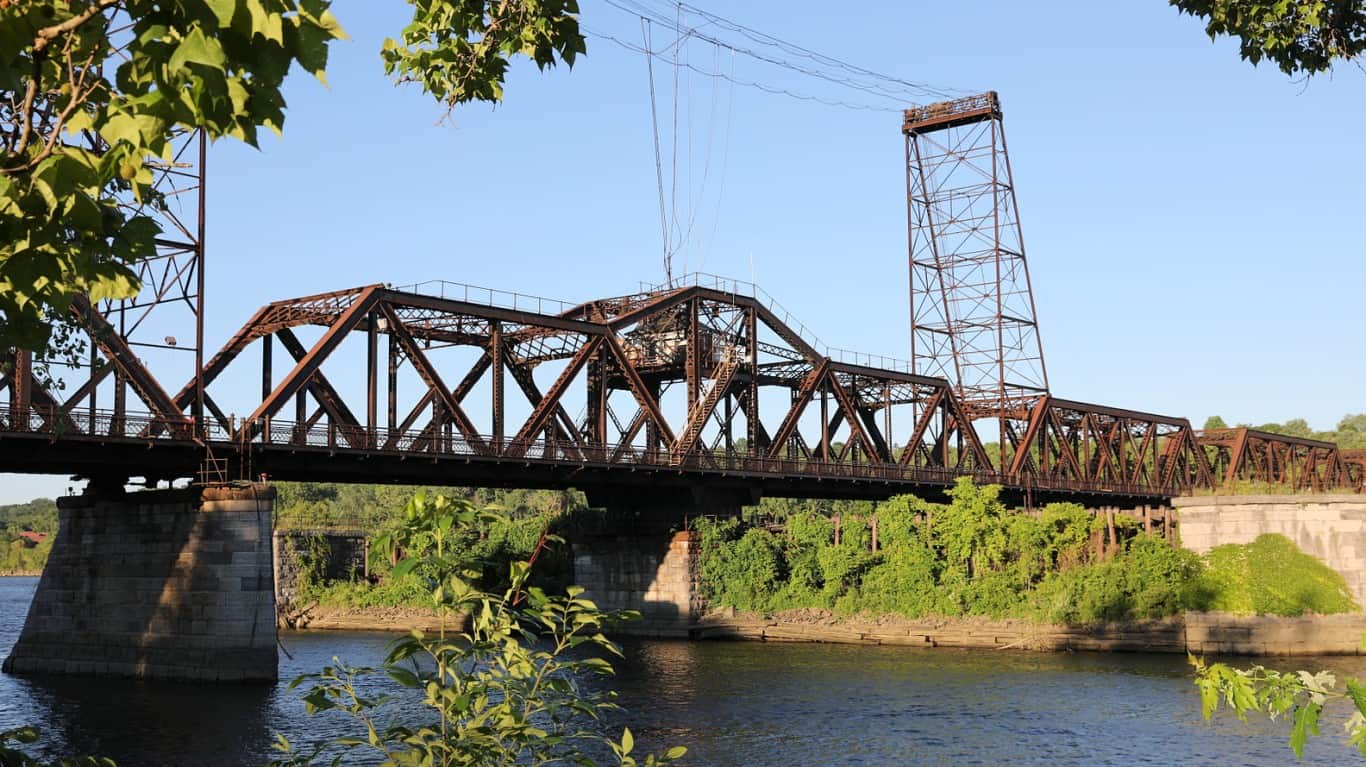
40. St. Louis, MO
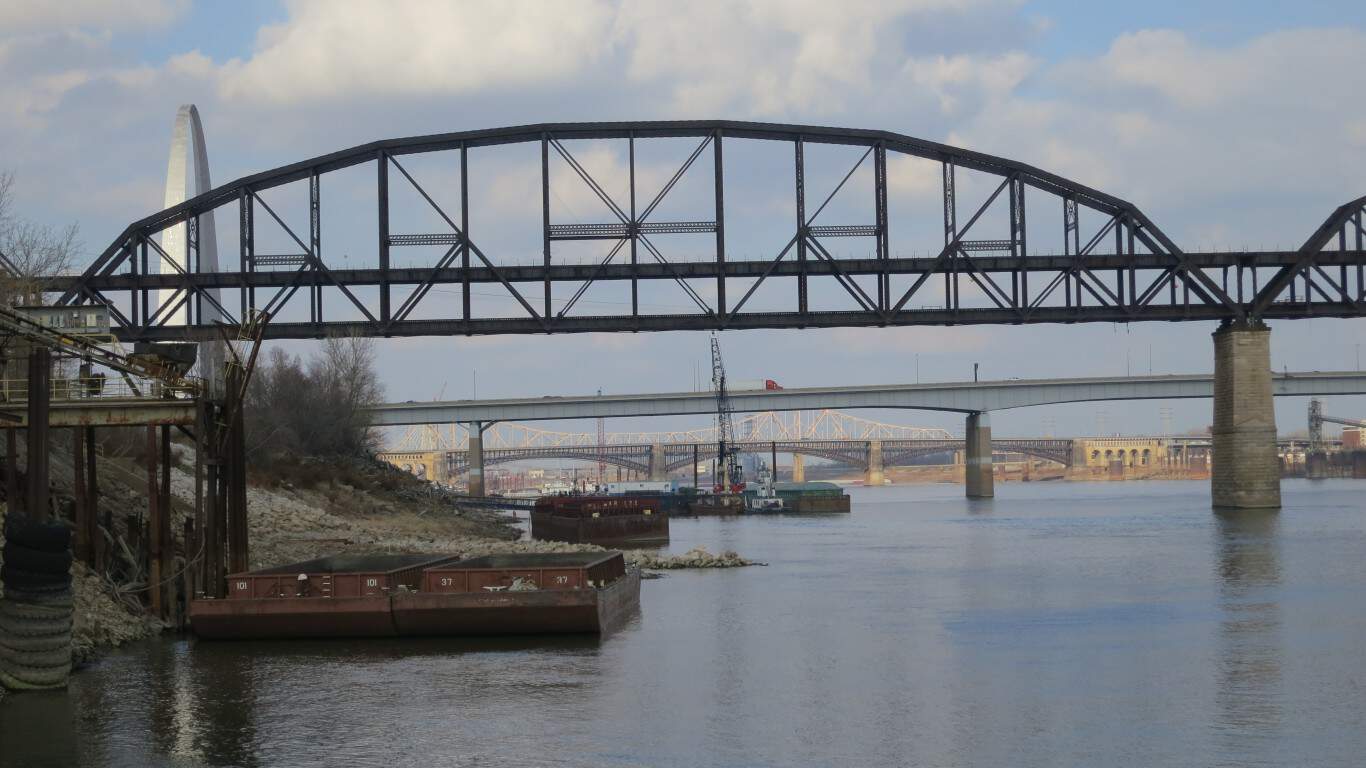
- Avg. age of bridges: 50 years
- Bridge area in “poor” condition: 5.4%
- Total population: 298,018
39. Bridgeport, CT

- Avg. age of bridges: 50 years
- Bridge area in “poor” condition: 2.3%
- Total population: 148,470
38. Jackson, MS
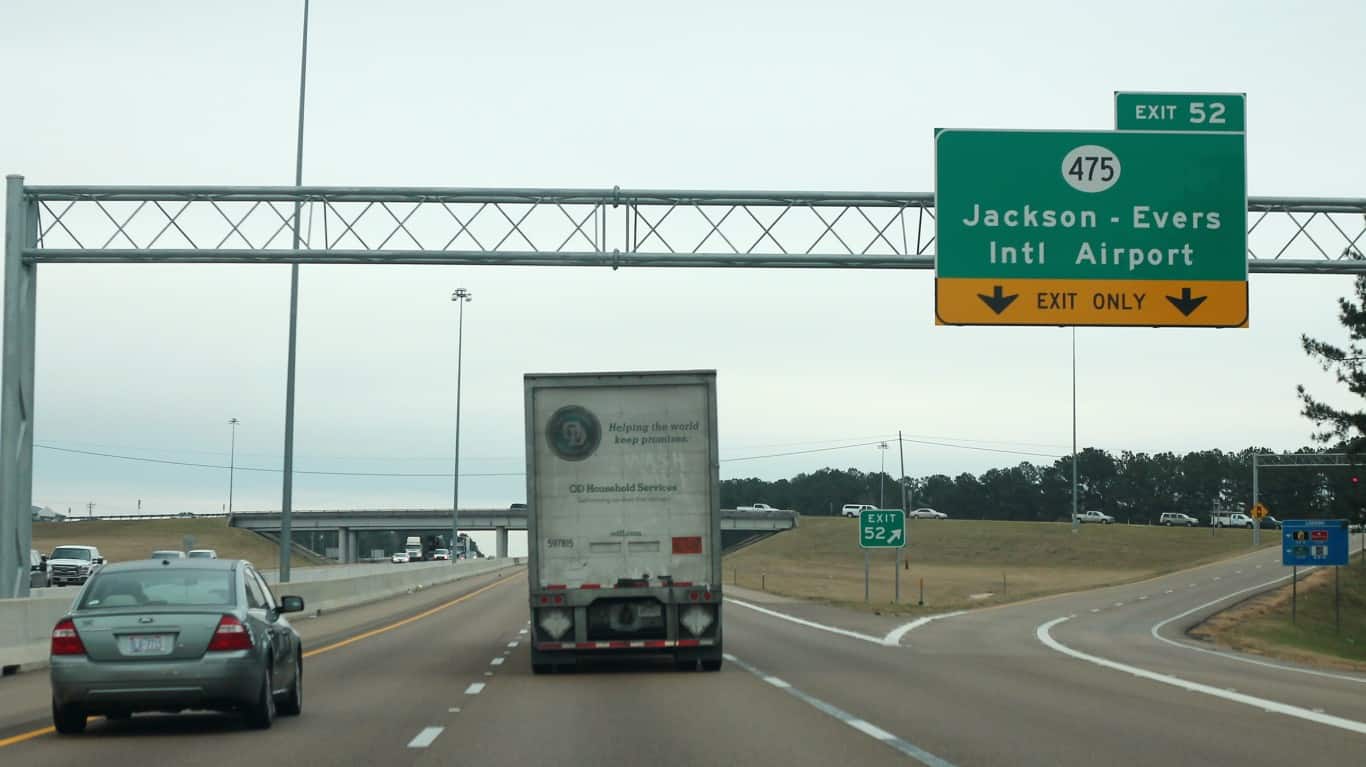
- Avg. age of bridges: 50 years
- Bridge area in “poor” condition: 3.8%
- Total population: 153,271
37. Salem, OR
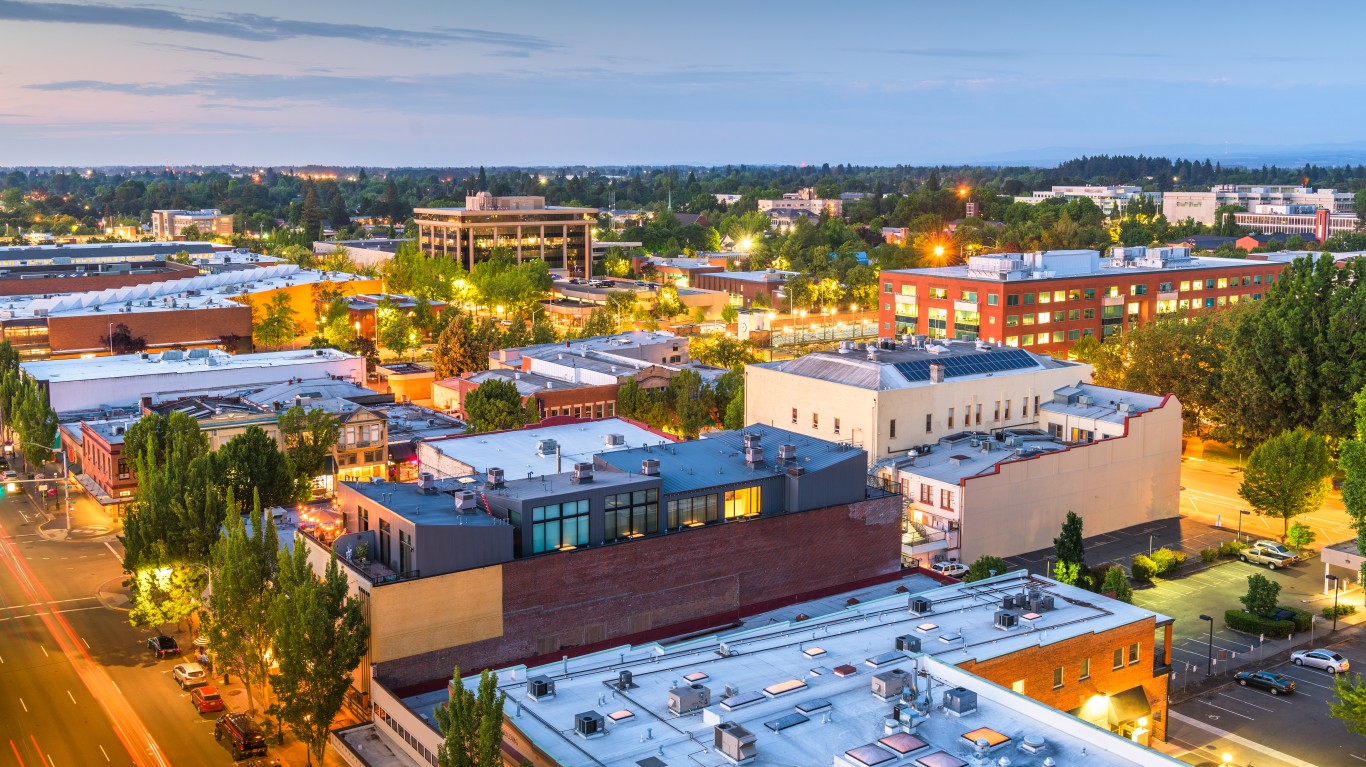
- Avg. age of bridges: 50 years
- Bridge area in “poor” condition: 0.0%
- Total population: 175,754
36. Albany, NY
- Avg. age of bridges: 51 years
- Bridge area in “poor” condition: 0.0%
- Total population: 99,692
35. Arlington, VA
- Avg. age of bridges: 51 years
- Bridge area in “poor” condition: 4.5%
- Total population: 235,845
34. Richmond, VA

- Avg. age of bridges: 51 years
- Bridge area in “poor” condition: 11.6%
- Total population: 227,171
33. Cleveland, OH
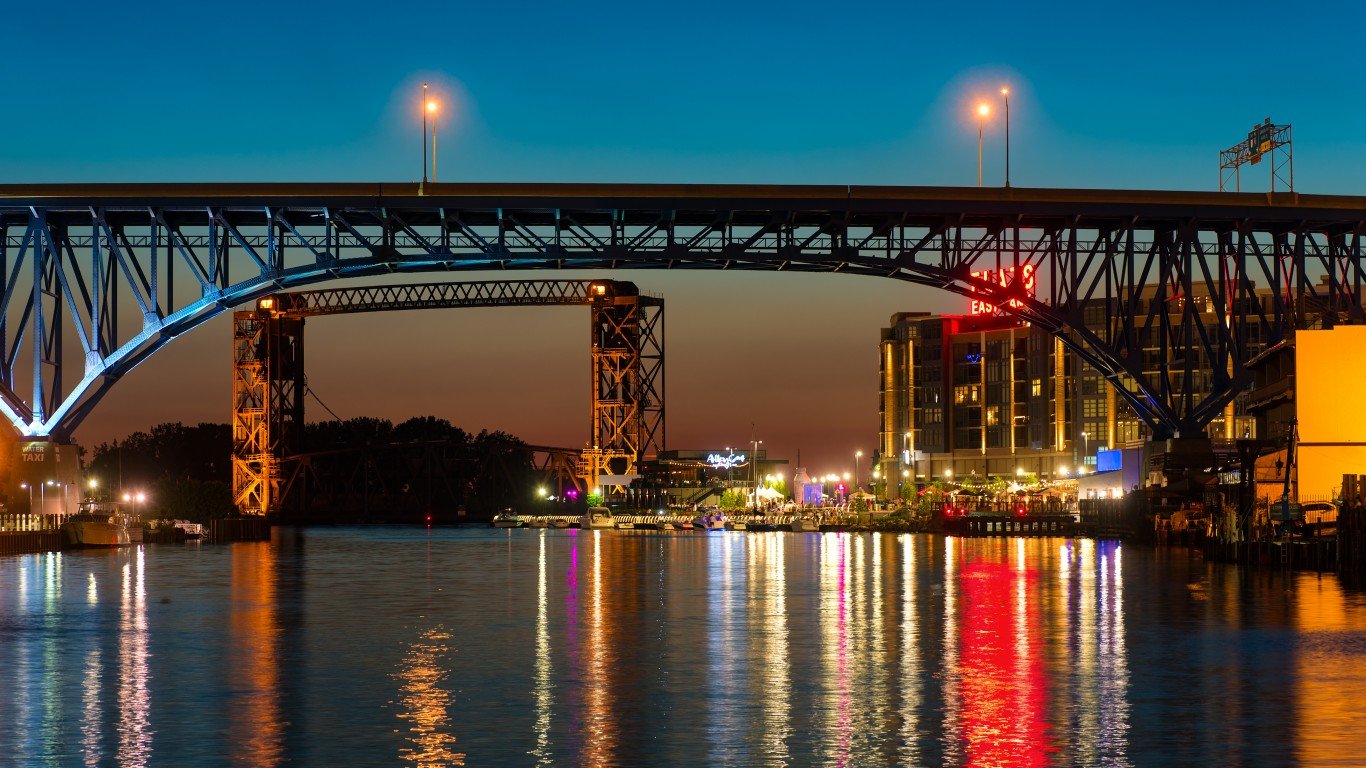
- Avg. age of bridges: 52 years
- Bridge area in “poor” condition: 6.6%
- Total population: 370,365
32. Grand Rapids, MI
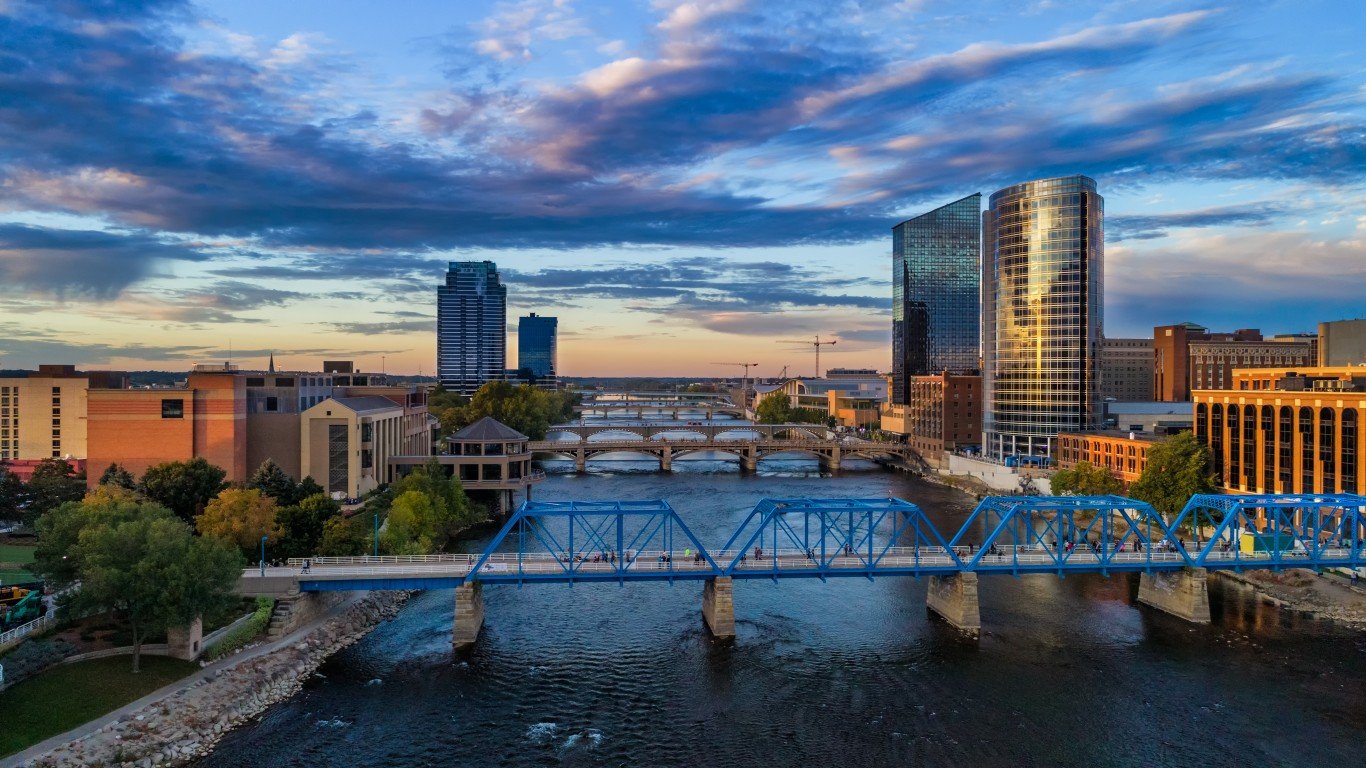
- Avg. age of bridges: 52 years
- Bridge area in “poor” condition: 9.3%
- Total population: 198,096
31. Baltimore, MD

- Avg. age of bridges: 52 years
- Bridge area in “poor” condition: 7.3%
- Total population: 584,548
30. Montgomery, AL

- Avg. age of bridges: 52 years
- Bridge area in “poor” condition: 1.5%
- Total population: 199,819
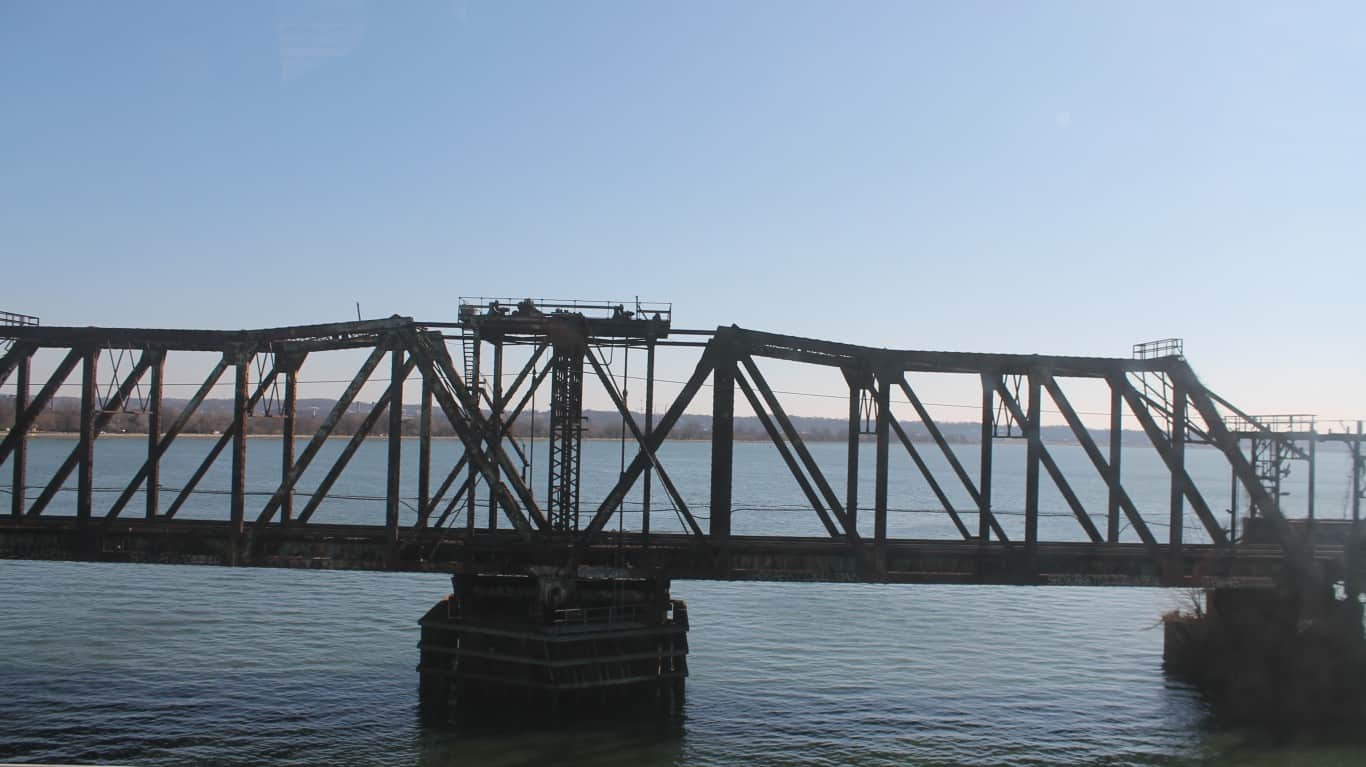
29. Charleston, WV
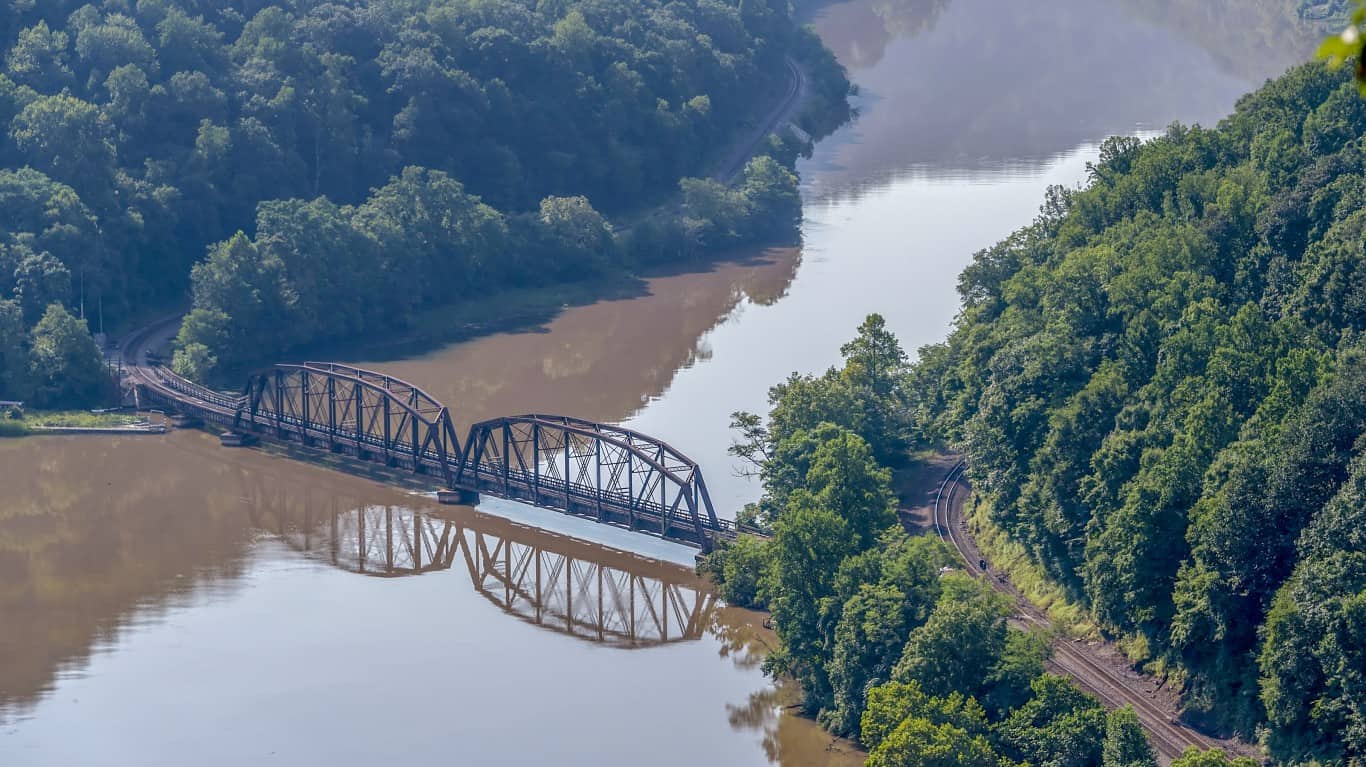
- Avg. age of bridges: 53 years
- Bridge area in “poor” condition: 6.5%
- Total population: 48,415
28. Waterbury, CT

- Avg. age of bridges: 53 years
- Bridge area in “poor” condition: 40.0%
- Total population: 114,480
27. Miami, FL
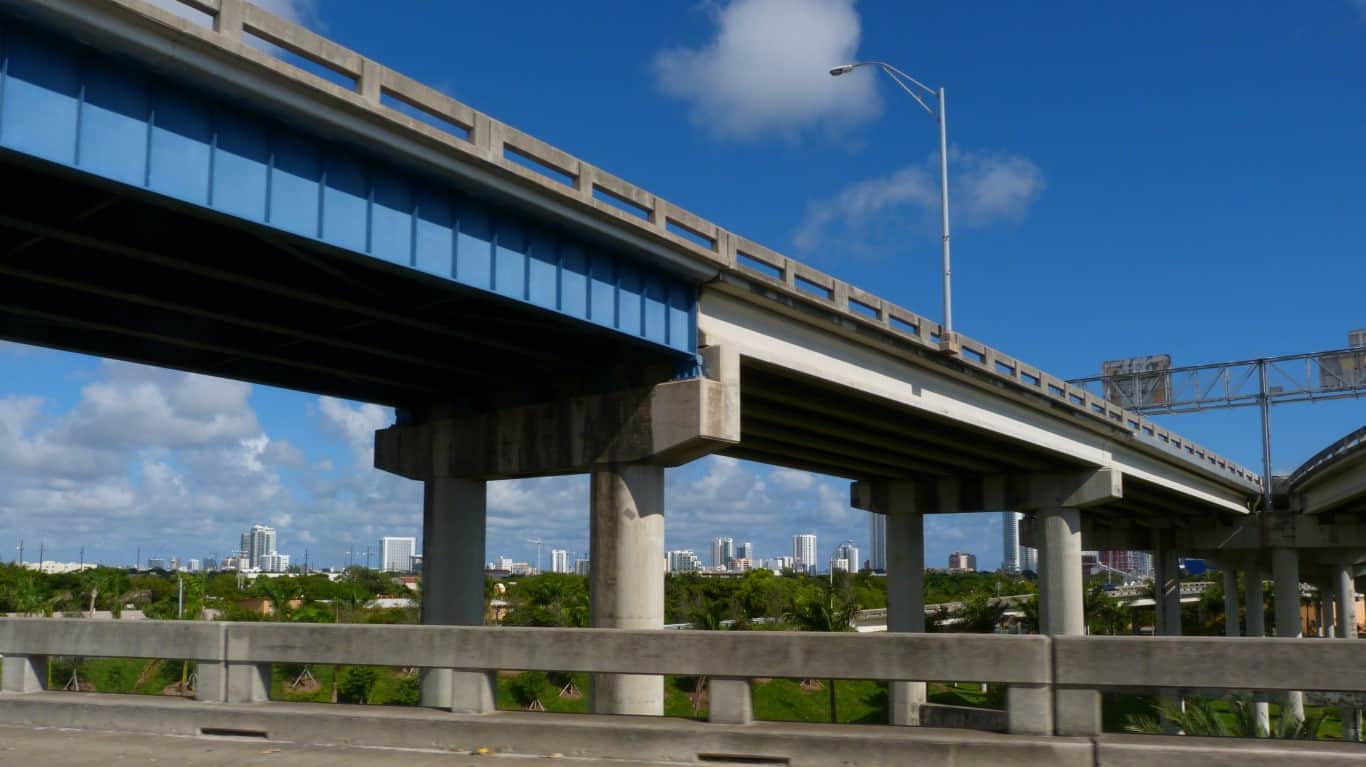
- Avg. age of bridges: 53 years
- Bridge area in “poor” condition: 2.2%
- Total population: 443,665
26. Syracuse, NY
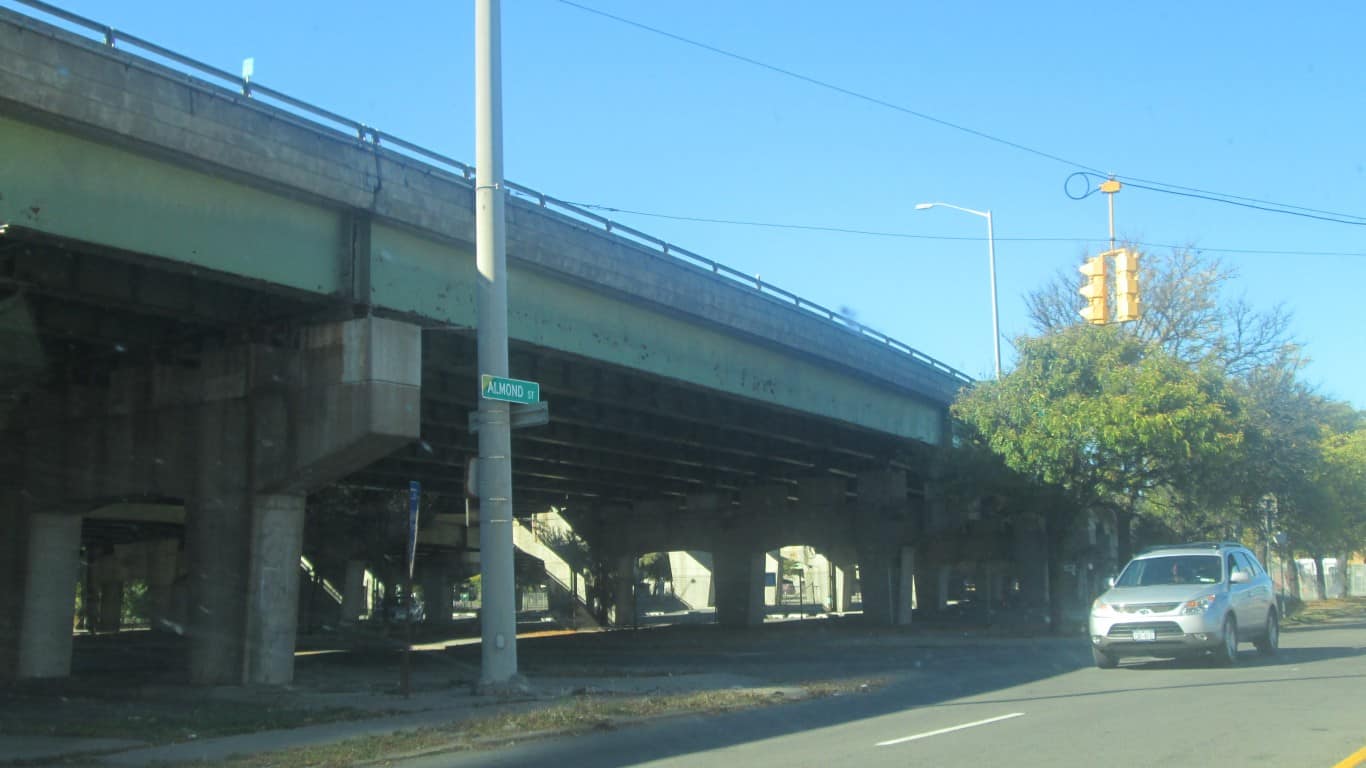
- Avg. age of bridges: 53 years
- Bridge area in “poor” condition: 13.3%
- Total population: 146,134
25. Akron, OH
- Avg. age of bridges: 53 years
- Bridge area in “poor” condition: 1.5%
- Total population: 190,273
24. Seattle, WA
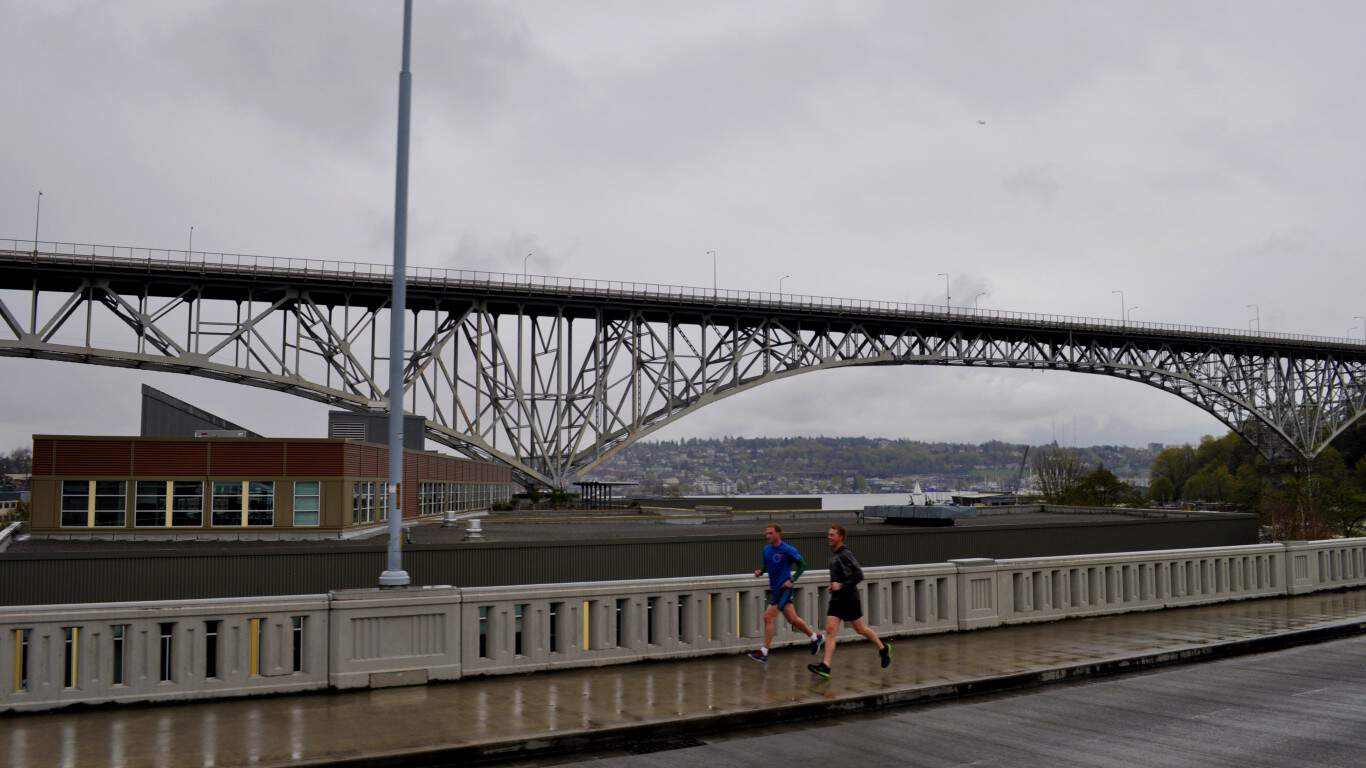
- Avg. age of bridges: 53 years
- Bridge area in “poor” condition: 10.1%
- Total population: 734,603
23. Detroit, MI
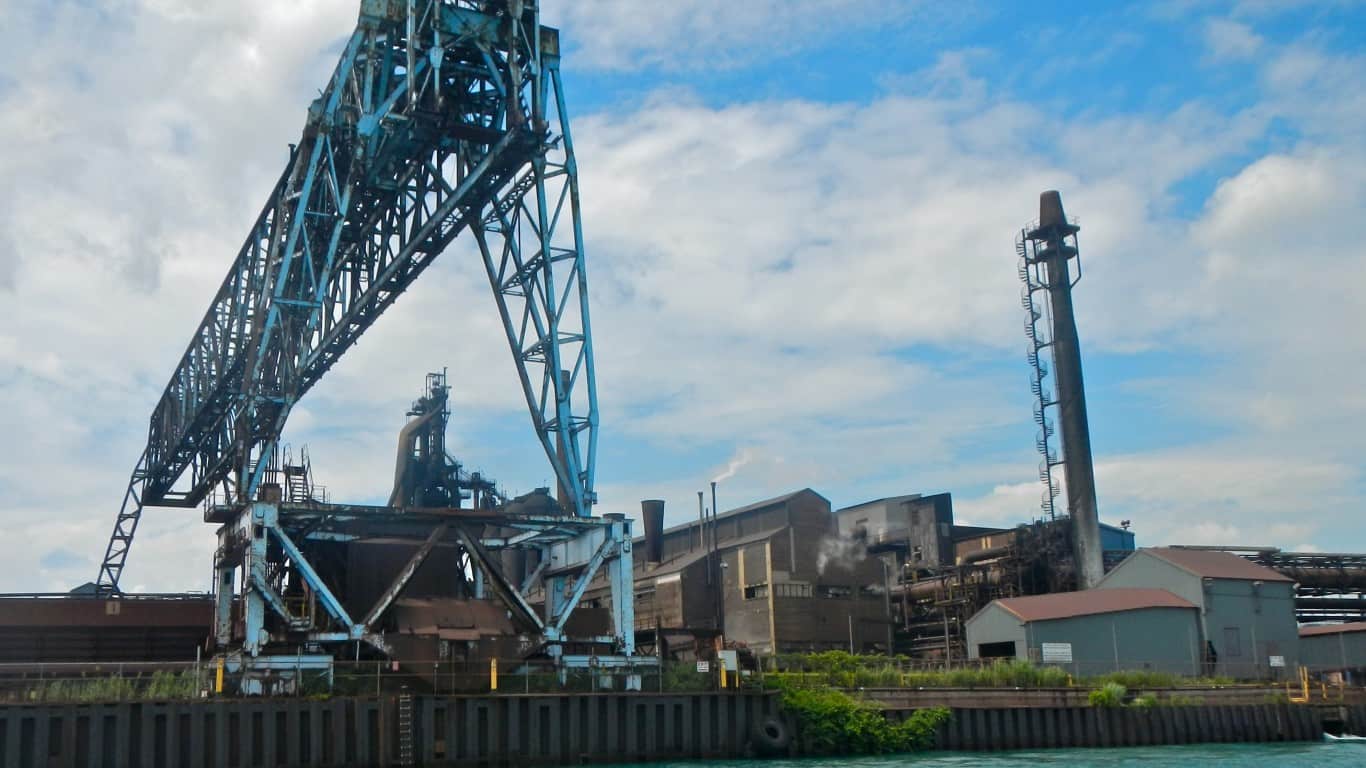
- Avg. age of bridges: 54 years
- Bridge area in “poor” condition: 6.0%
- Total population: 636,787
22. Los Angeles, CA
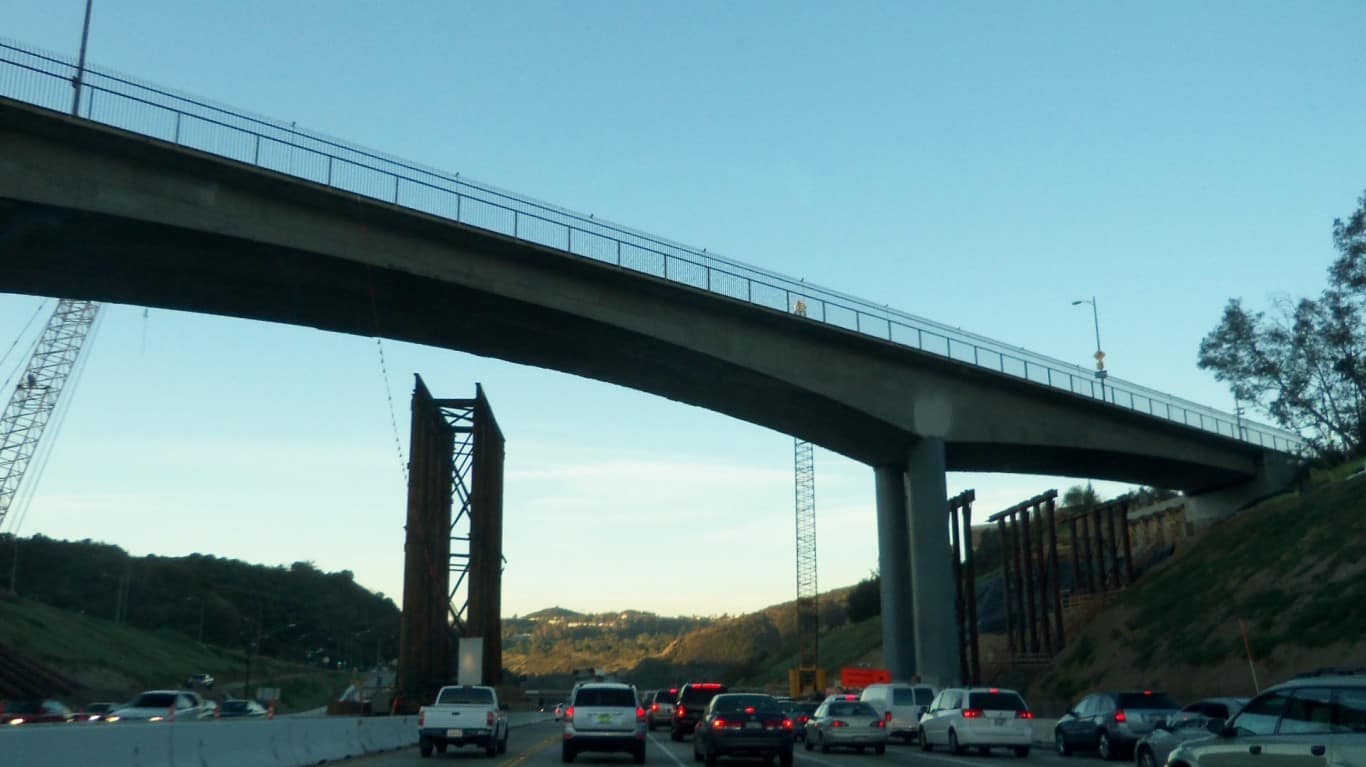
- Avg. age of bridges: 54 years
- Bridge area in “poor” condition: 3.7%
- Total population: 3,881,041
21. Topeka, KS
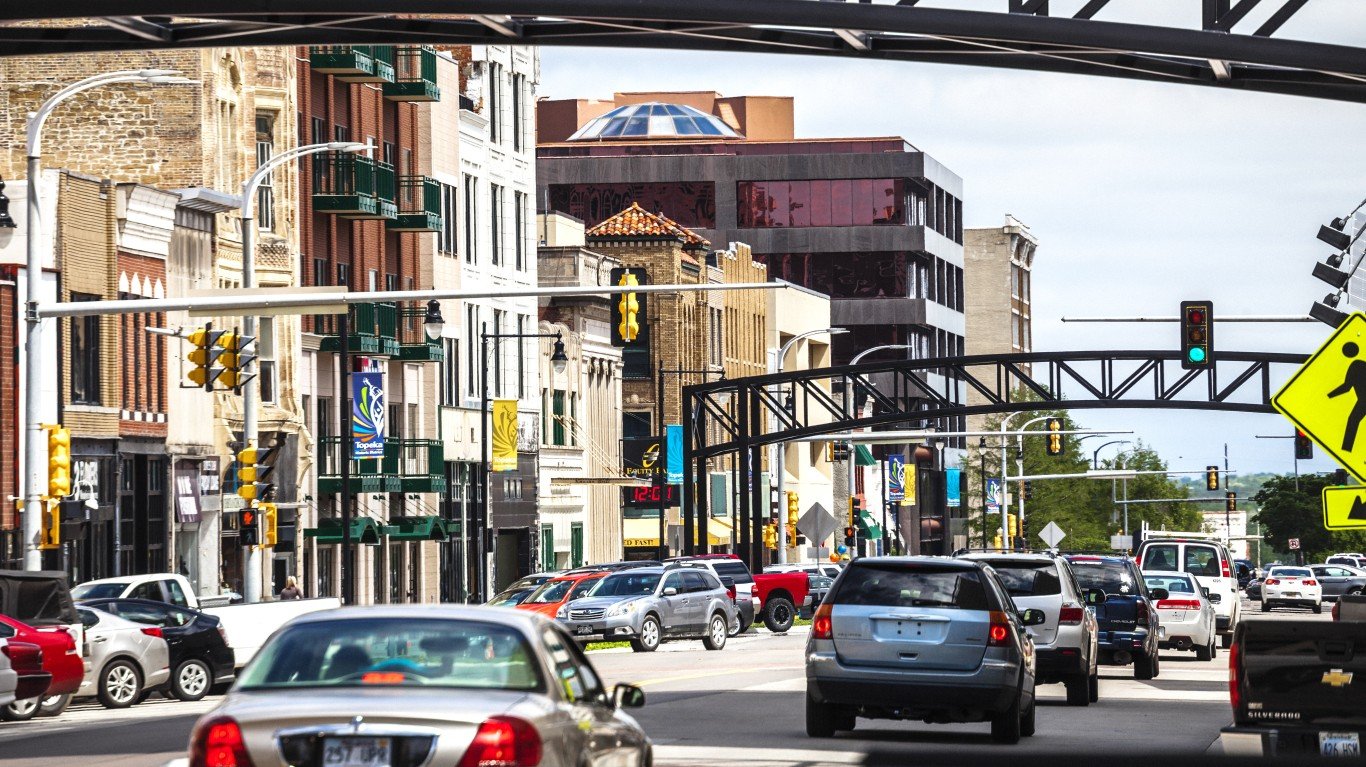
- Avg. age of bridges: 54 years
- Bridge area in “poor” condition: 9.1%
- Total population: 126,431
20. Sacramento, CA
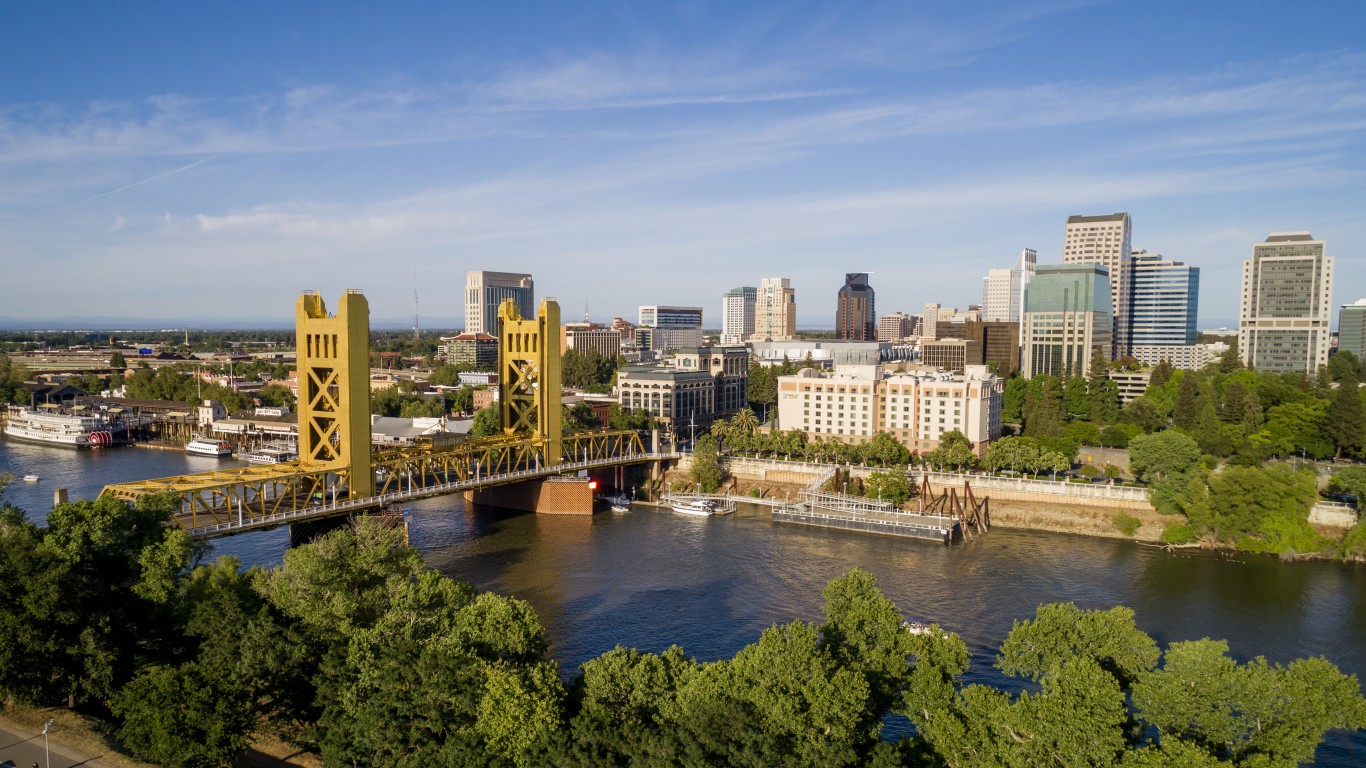
- Avg. age of bridges: 54 years
- Bridge area in “poor” condition: 5.6%
- Total population: 523,600
19. Hartford, CT
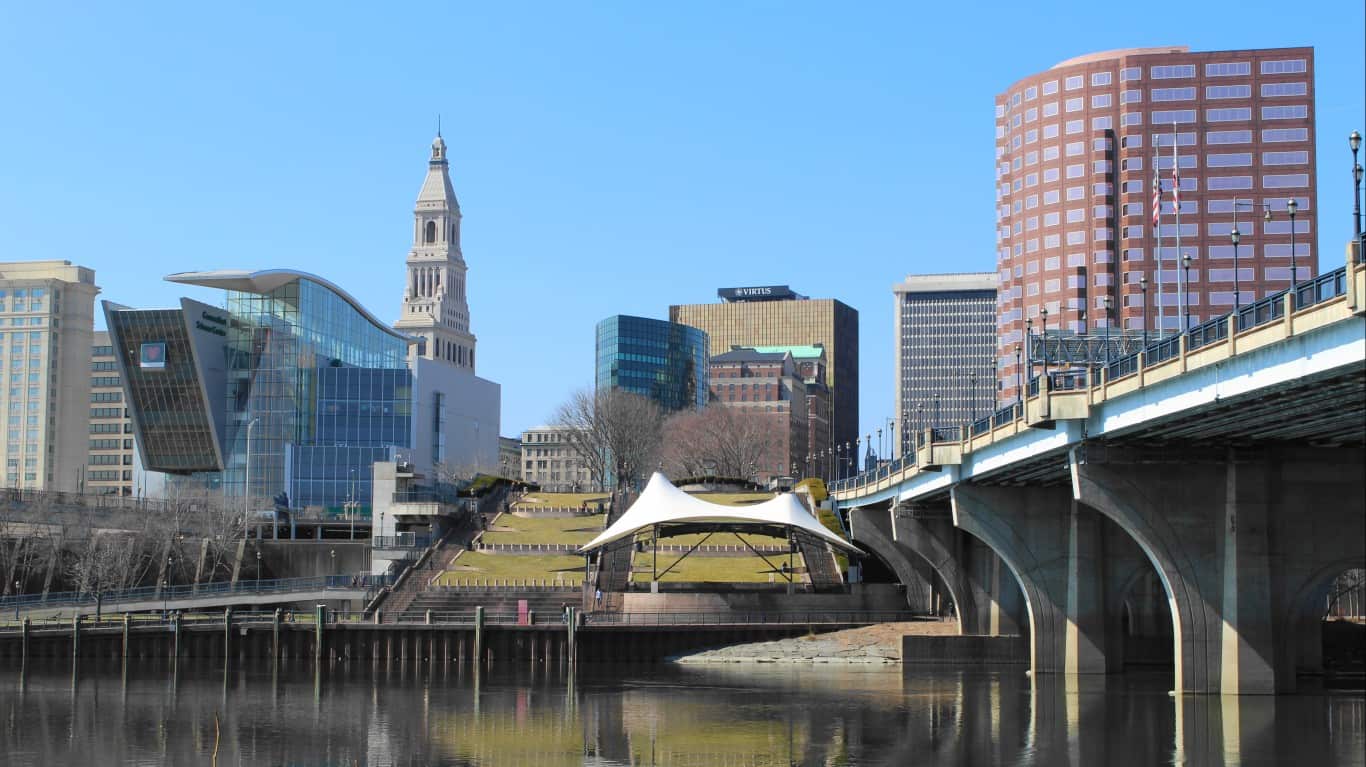
- Avg. age of bridges: 55 years
- Bridge area in “poor” condition: 5.5%
- Total population: 121,057
18. Jersey City, NJ
- Avg. age of bridges: 55 years
- Bridge area in “poor” condition: 1.1%
- Total population: 287,899
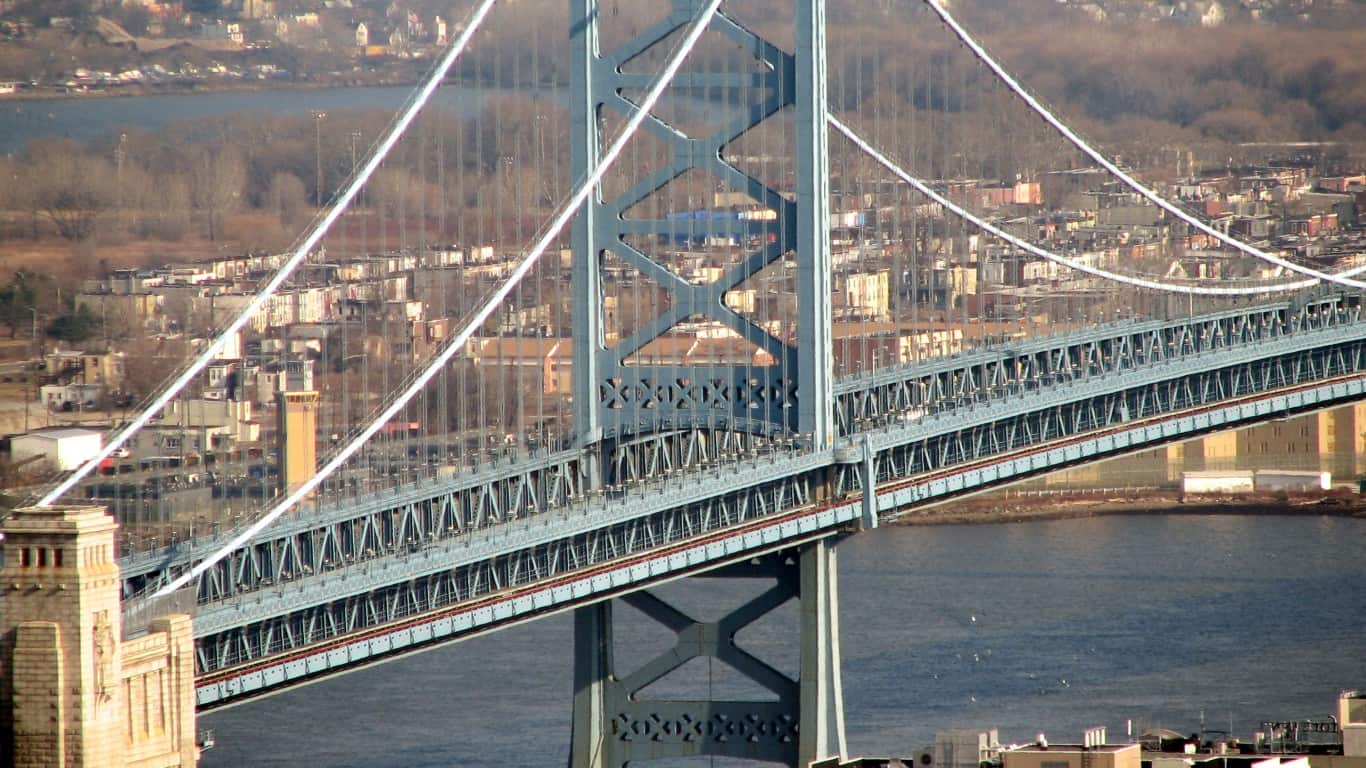
17. Philadelphia, PA
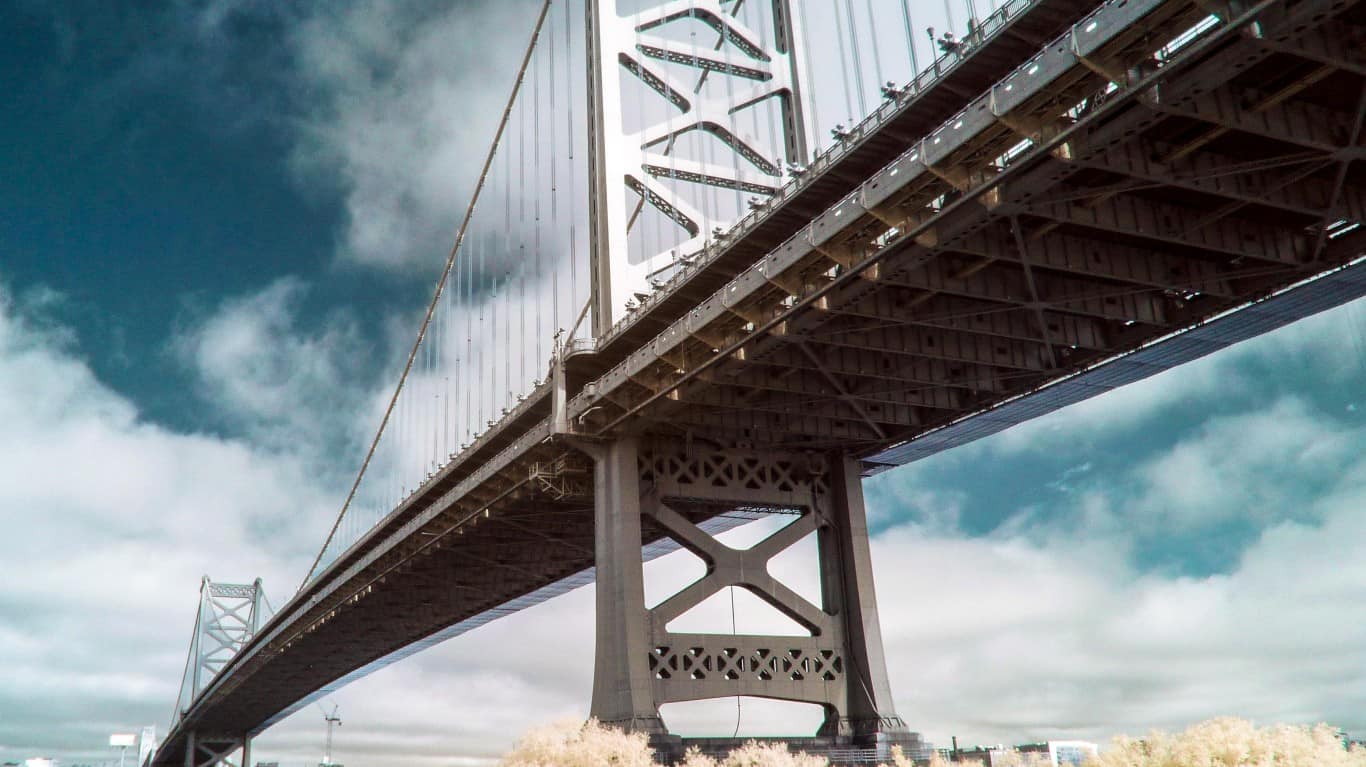
- Avg. age of bridges: 55 years
- Bridge area in “poor” condition: 7.0%
- Total population: 1,593,208
16. Pasadena, CA
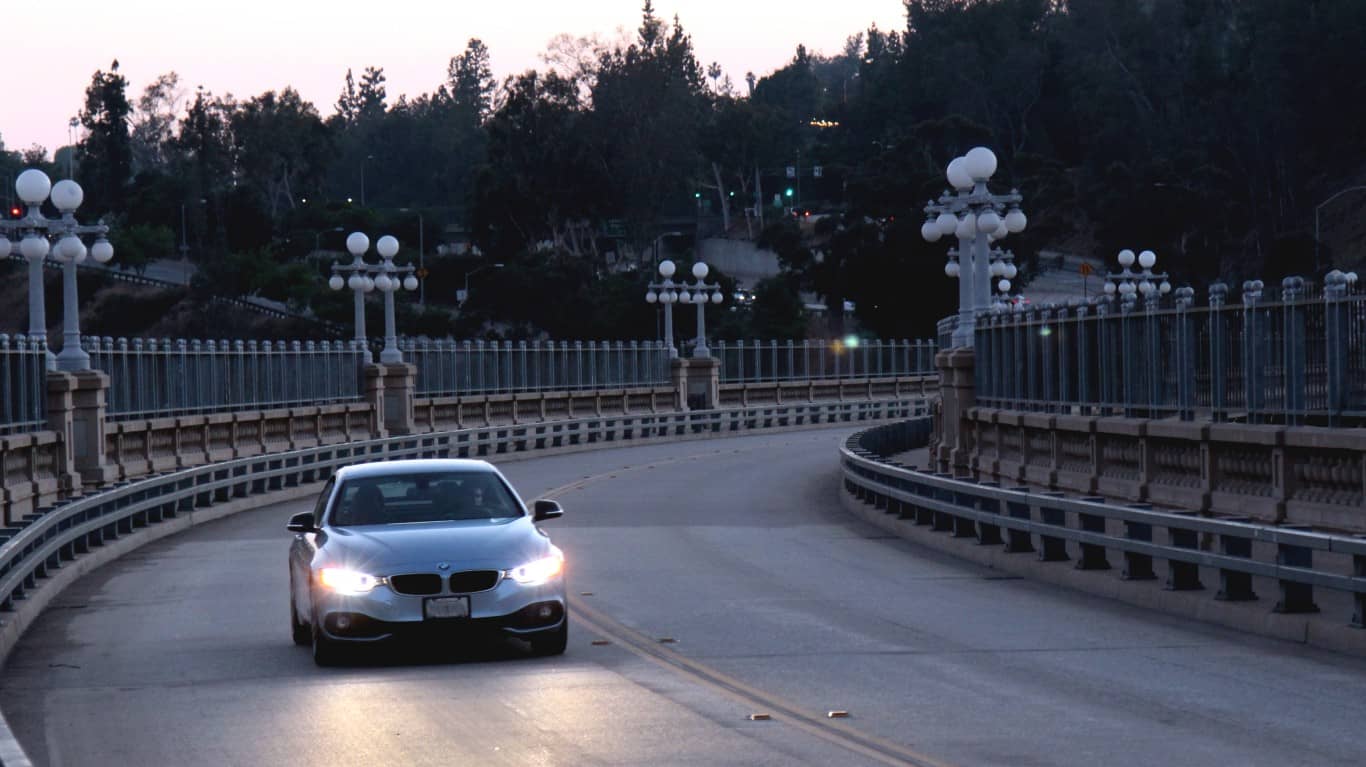
- Avg. age of bridges: 55 years
- Bridge area in “poor” condition: 0.8%
- Total population: 137,554
15. Davenport, IA
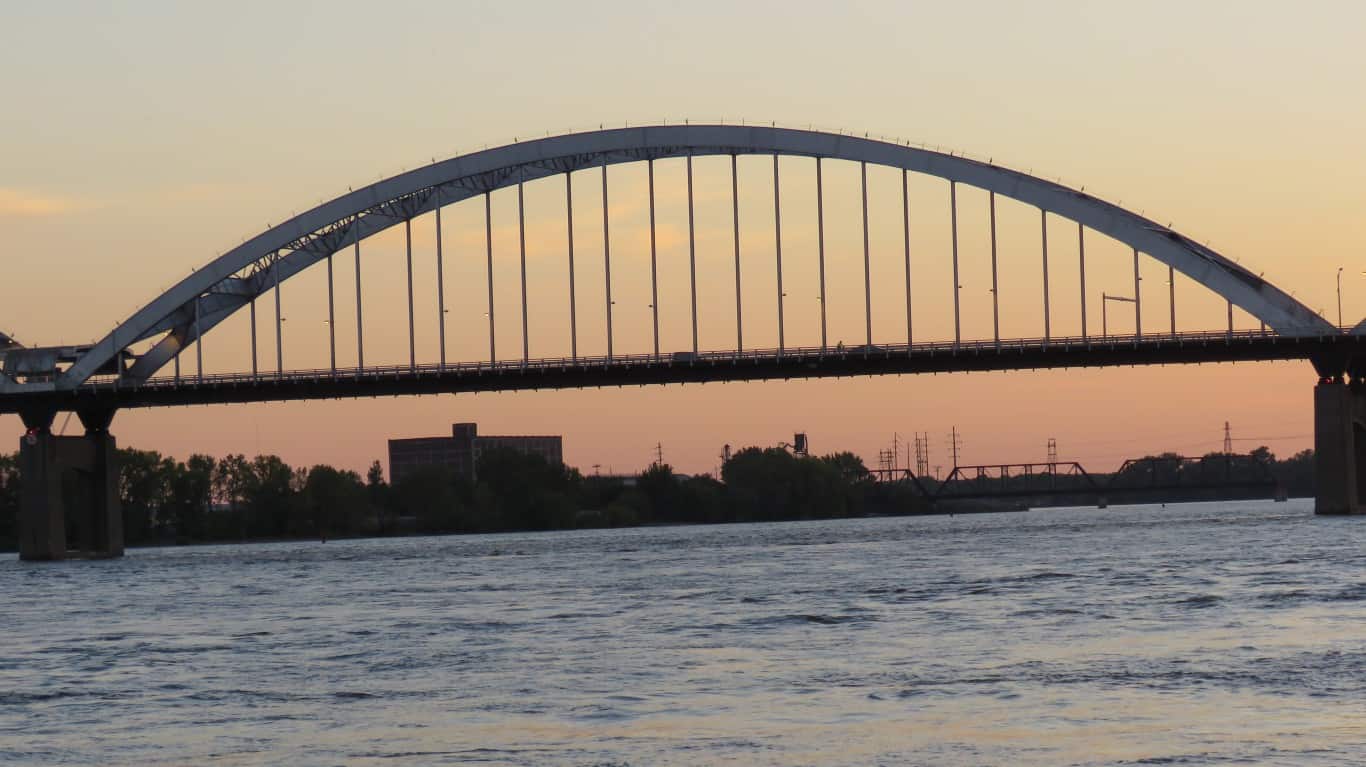
- Avg. age of bridges: 56 years
- Bridge area in “poor” condition: 59.3%
- Total population: 101,448
14. Portland, OR
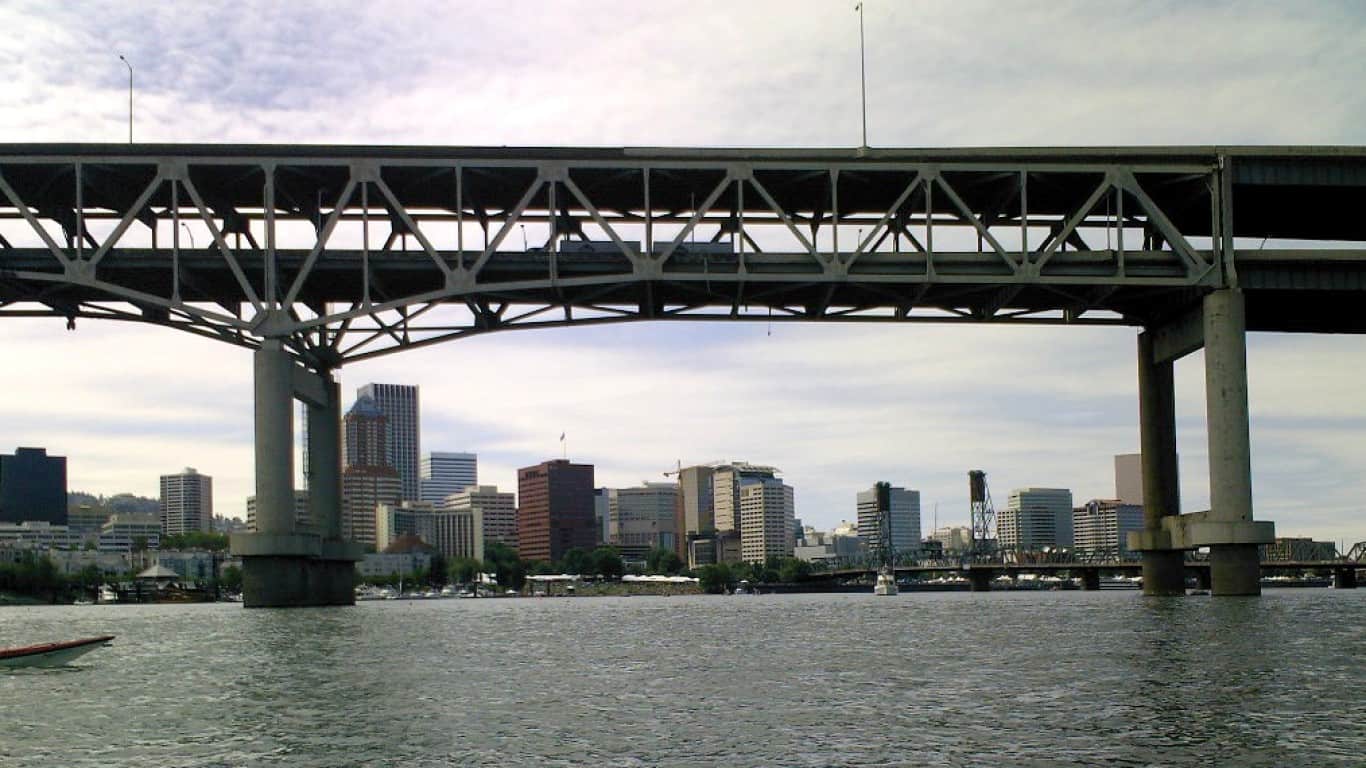
- Avg. age of bridges: 56 years
- Bridge area in “poor” condition: 3.5%
- Total population: 646,101
13. Newark, NJ
- Avg. age of bridges: 57 years
- Bridge area in “poor” condition: 2.1%
- Total population: 307,355
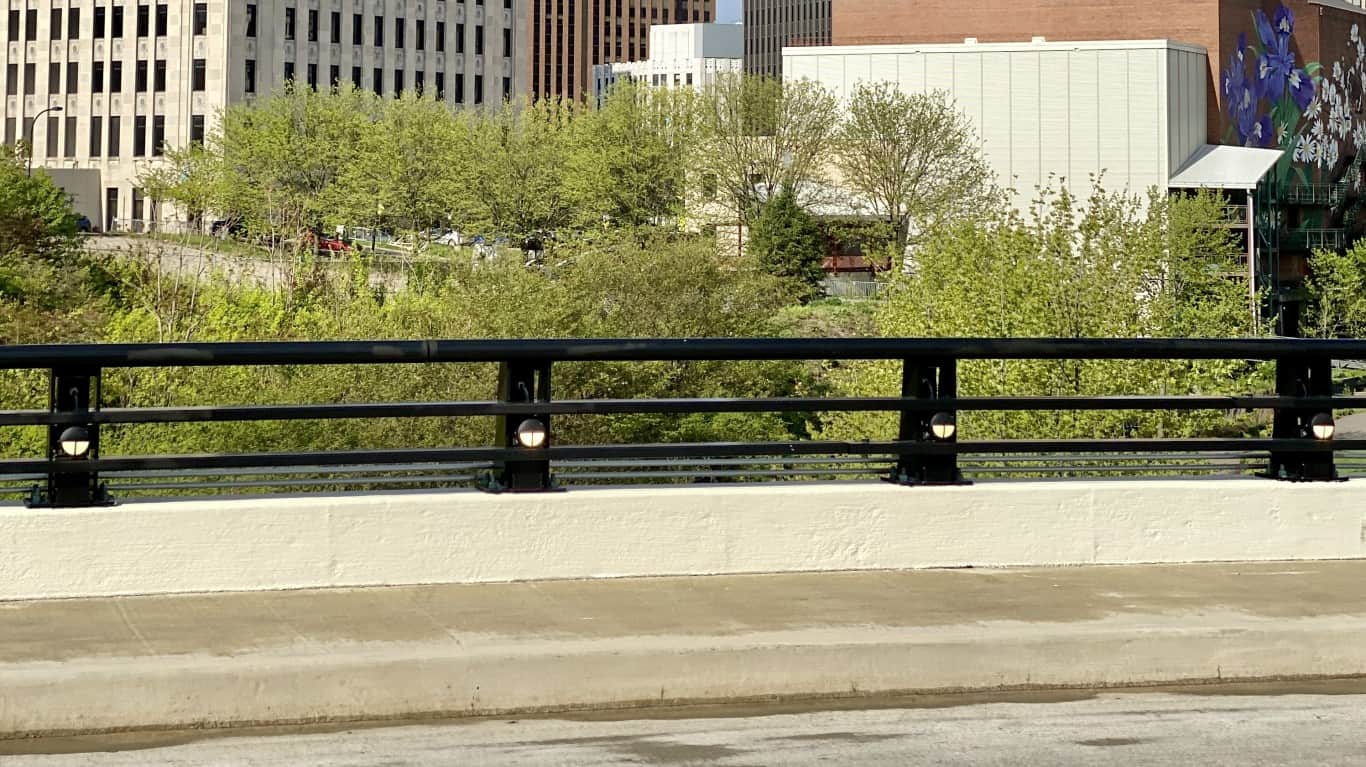
12. Rochester, NY
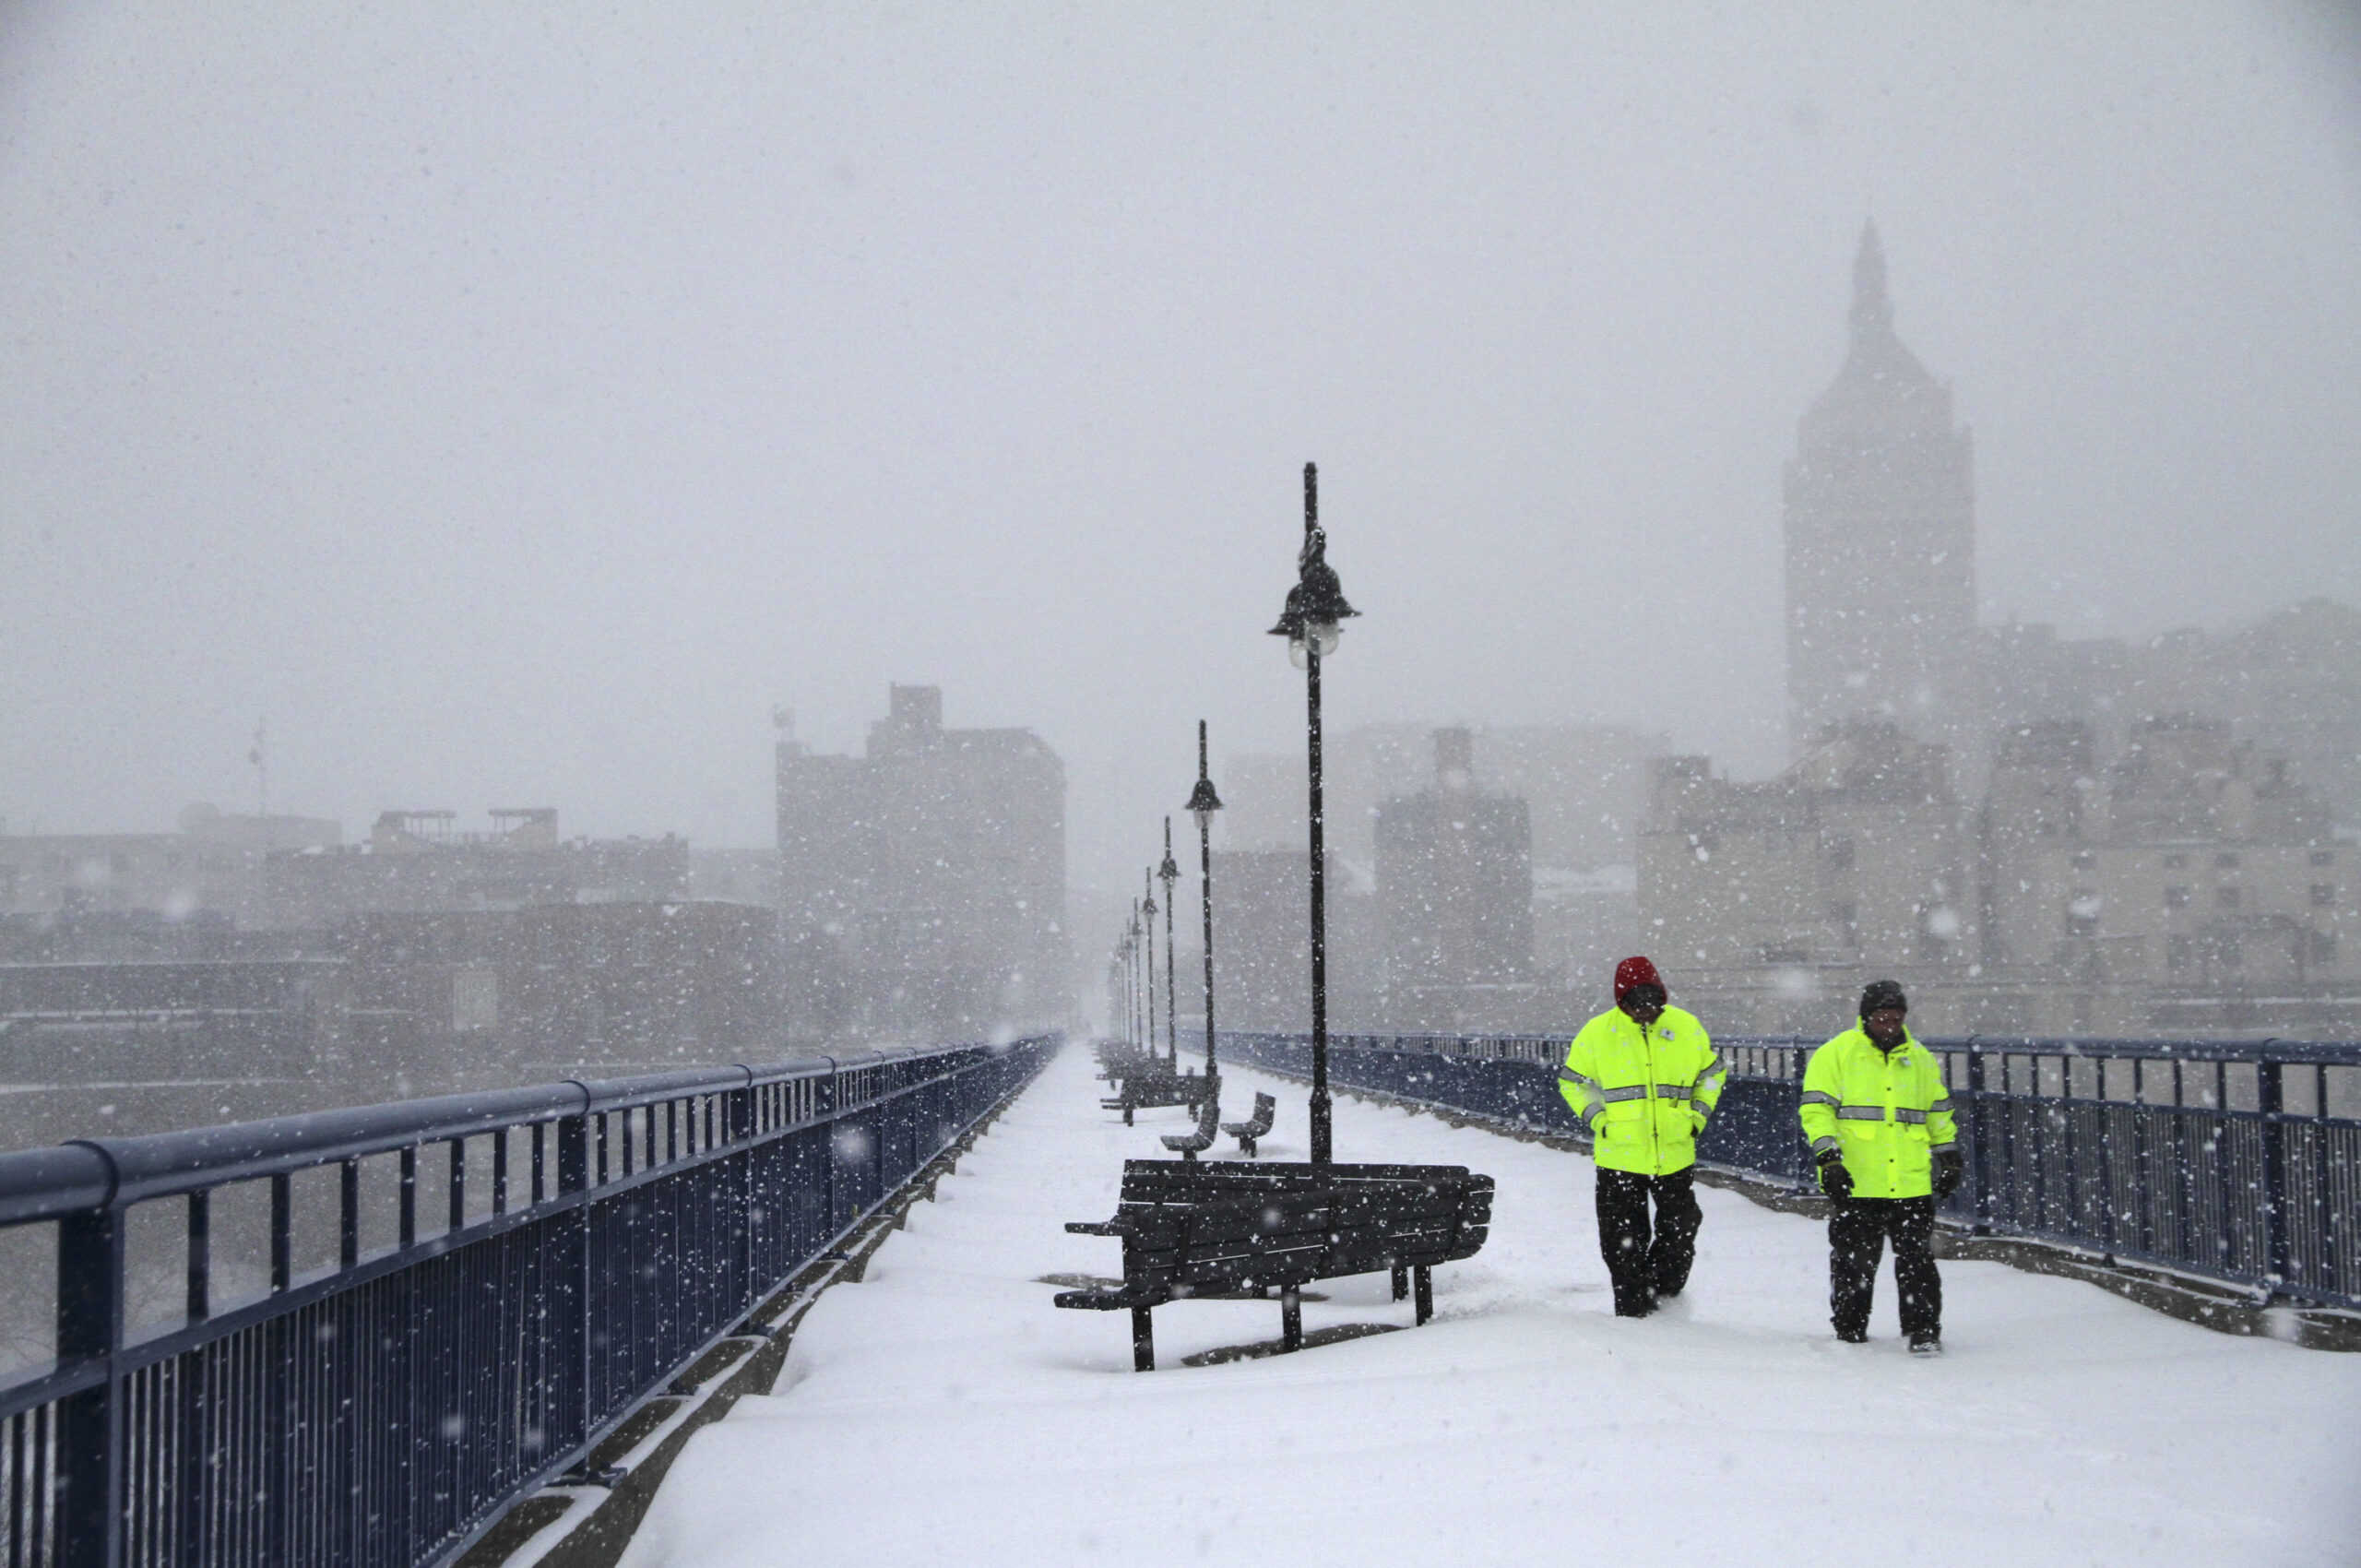
- Avg. age of bridges: 58 years
- Bridge area in “poor” condition: 5.3%
- Total population: 210,992
11. Spokane, WA
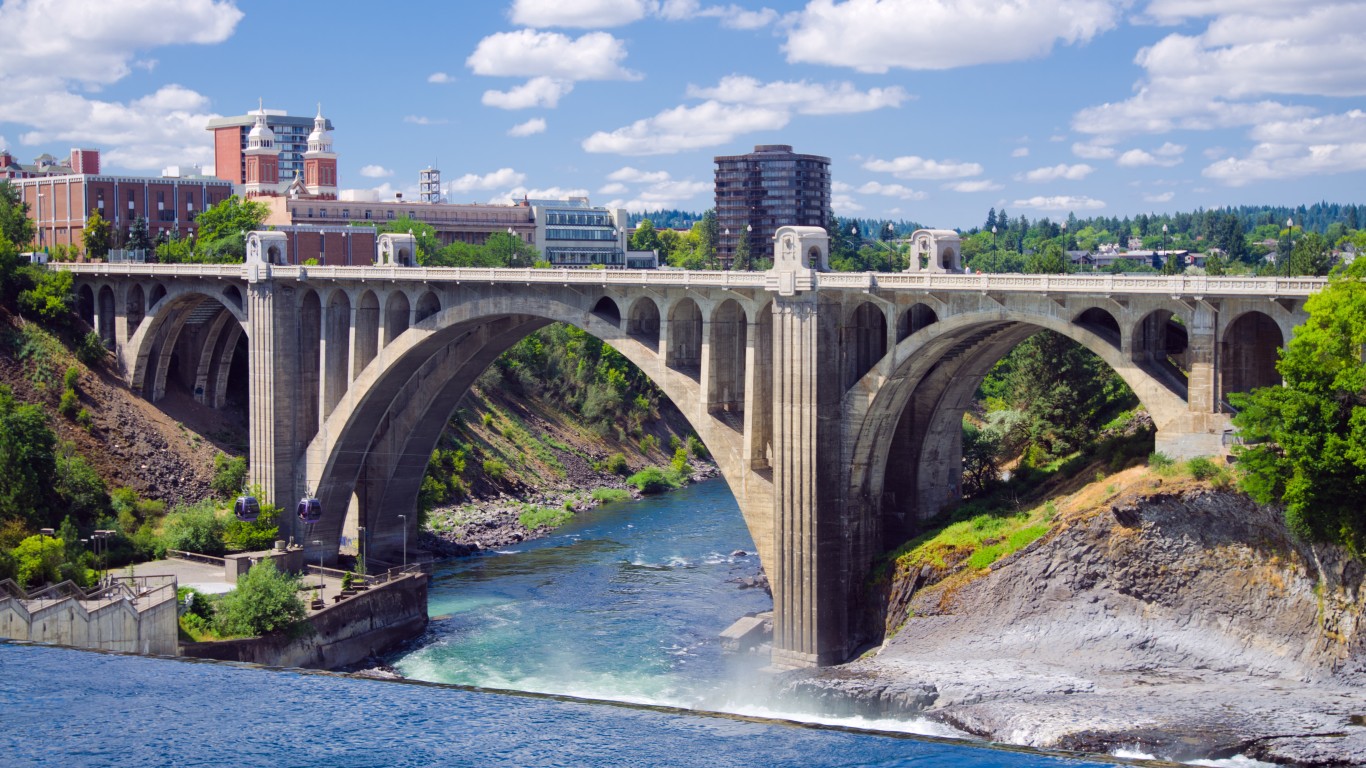
- Avg. age of bridges: 58 years
- Bridge area in “poor” condition: 19.7%
- Total population: 227,922
10. Chicago, IL
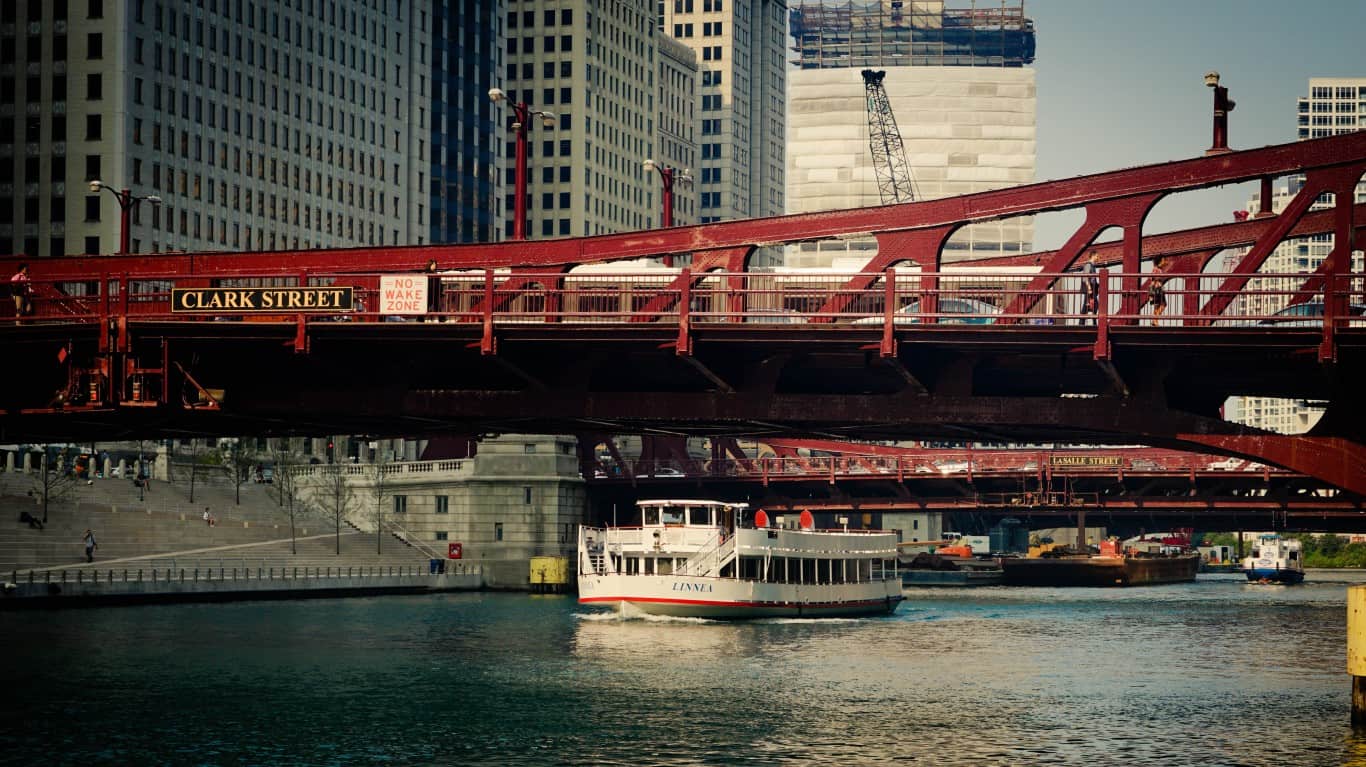
- Avg. age of bridges: 61 years
- Bridge area in “poor” condition: 15.9%
- Total population: 2,721,914
9. Wilmington, DE
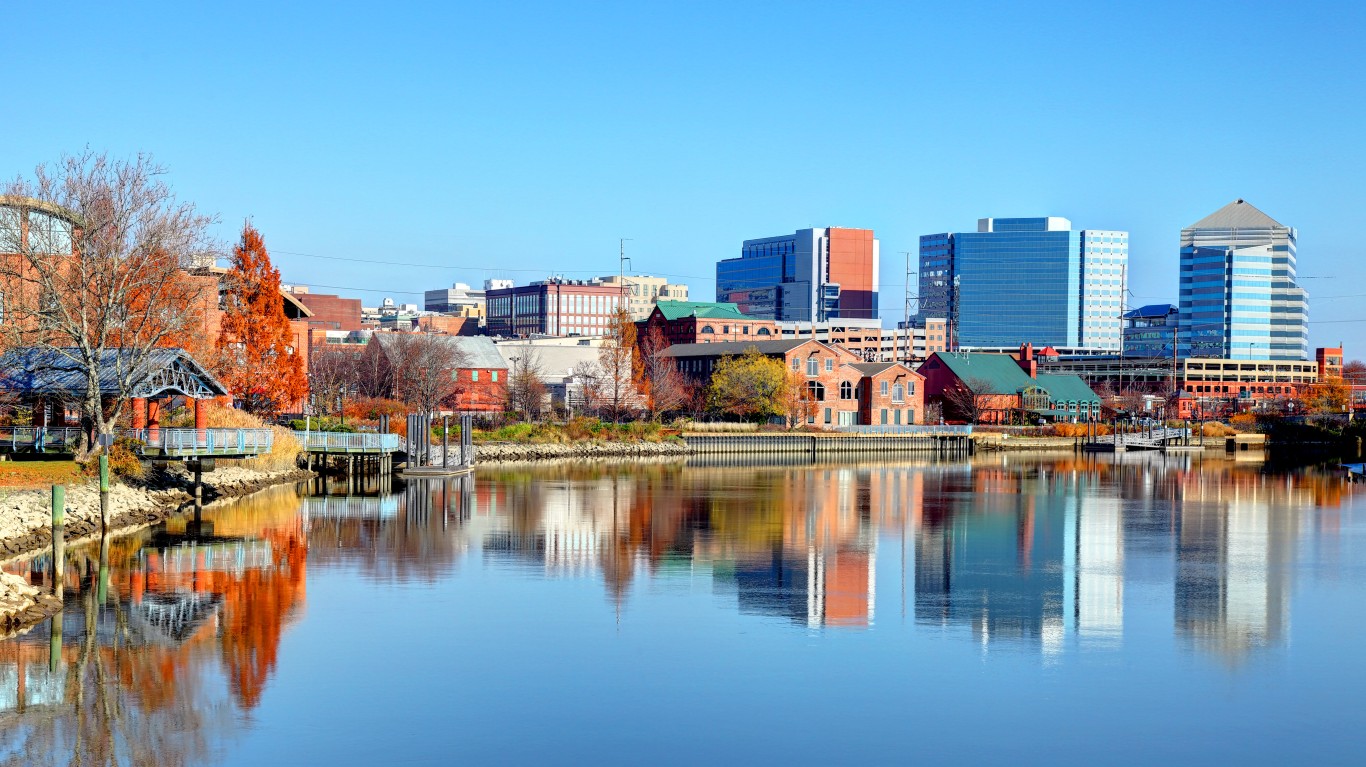
- Avg. age of bridges: 61 years
- Bridge area in “poor” condition: 0.0%
- Total population: 71,034
8. Buffalo, NY
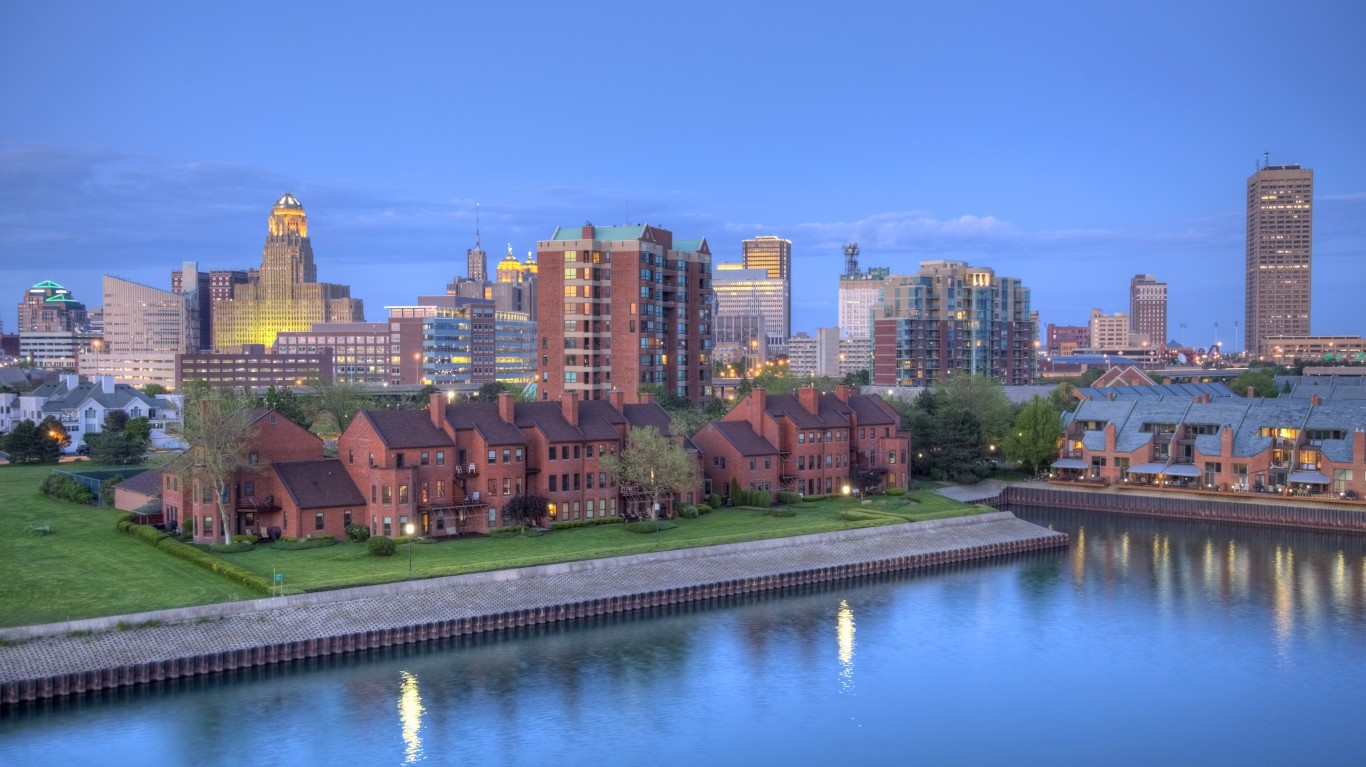
- Avg. age of bridges: 61 years
- Bridge area in “poor” condition: 8.1%
- Total population: 276,688
7. Pittsburgh, PA
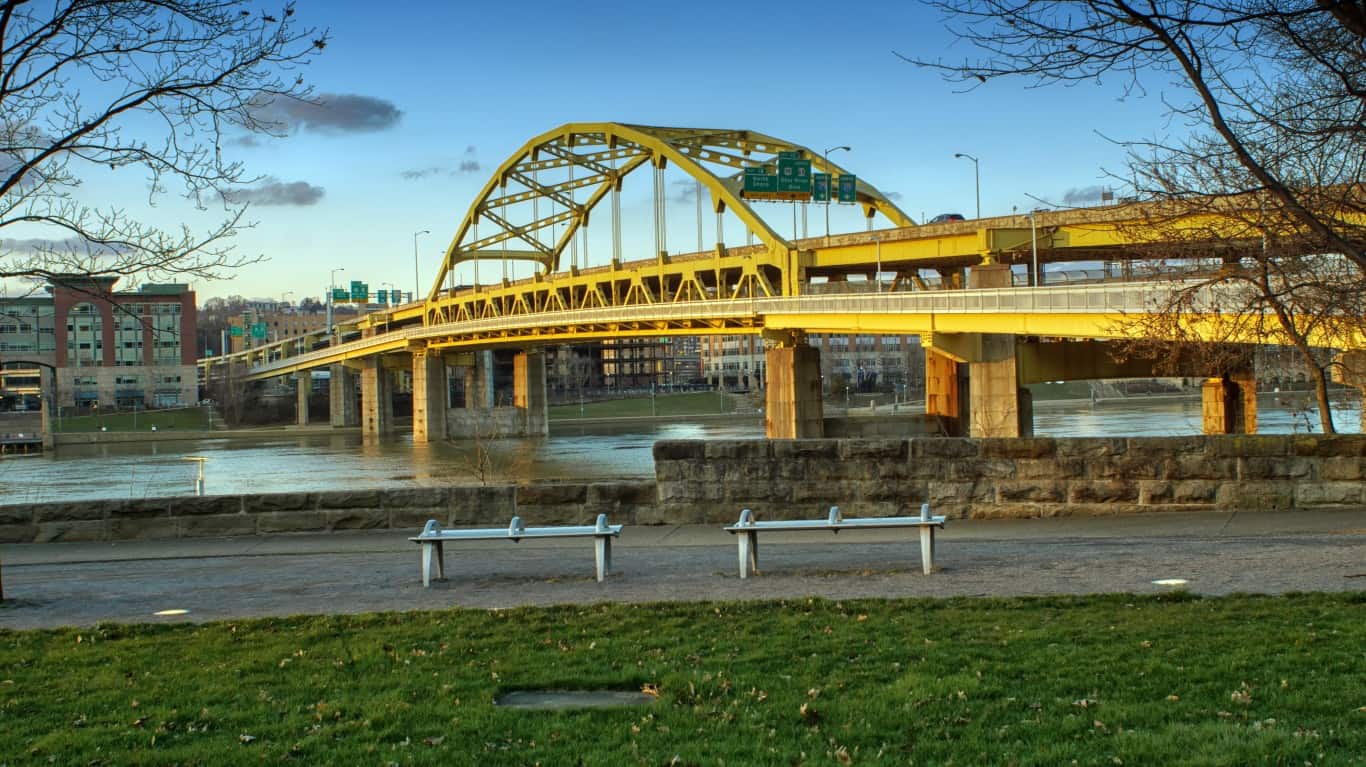
- Avg. age of bridges: 63 years
- Bridge area in “poor” condition: 5.7%
- Total population: 303,843
6. Springfield, MA
- Avg. age of bridges: 63 years
- Bridge area in “poor” condition: 7.3%
- Total population: 155,305
5. Washington, DC

- Avg. age of bridges: 66 years
- Bridge area in “poor” condition: 5.0%
- Total population: 670,587
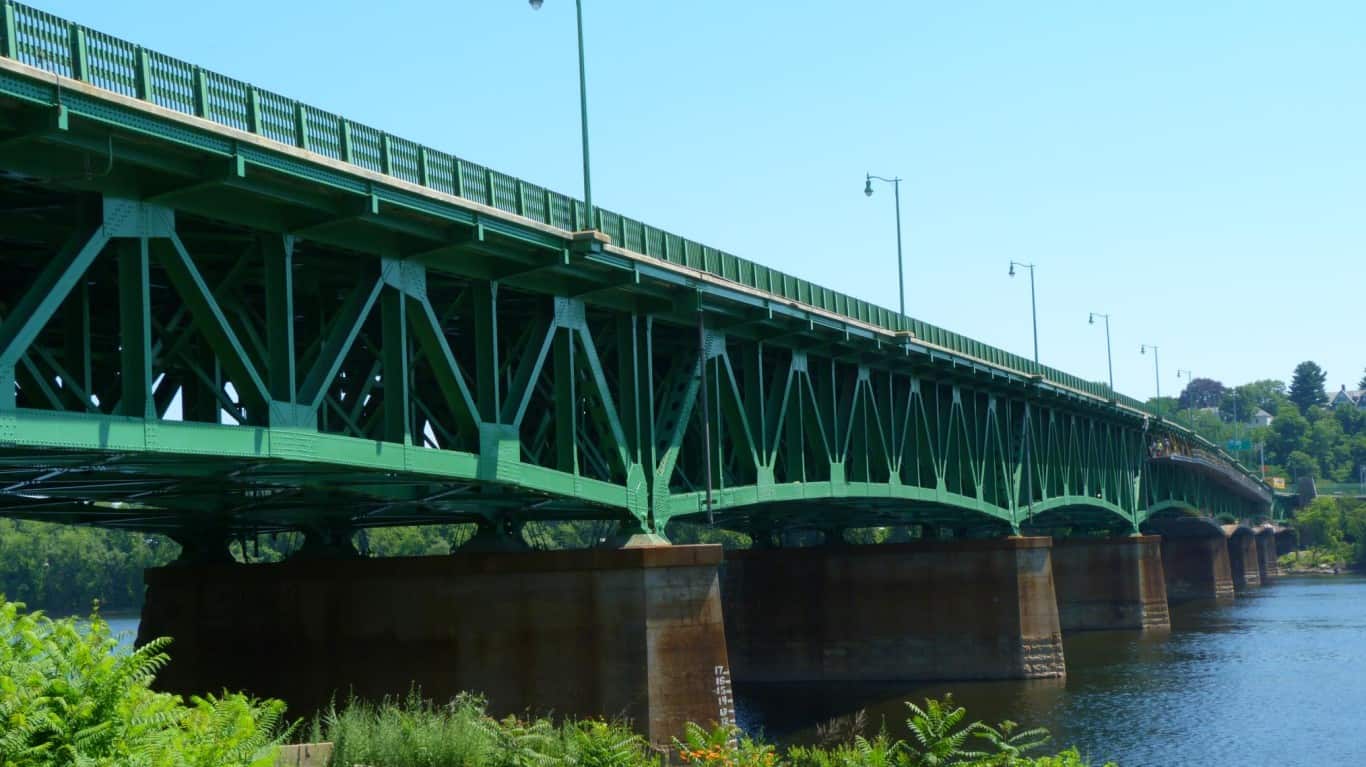
4. Harrisburg, PA

- Avg. age of bridges: 68 years
- Bridge area in “poor” condition: 9.1%
- Total population: 50,055
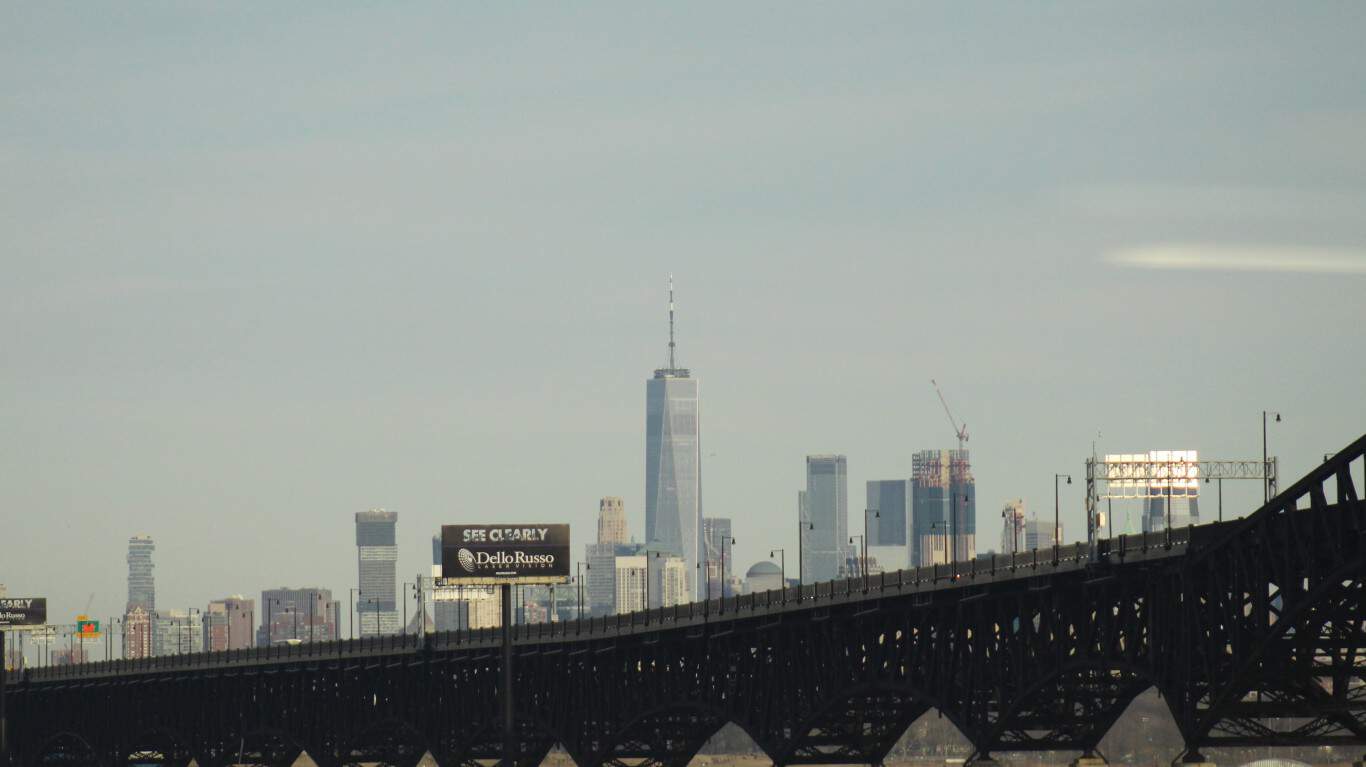
3. New York, NY
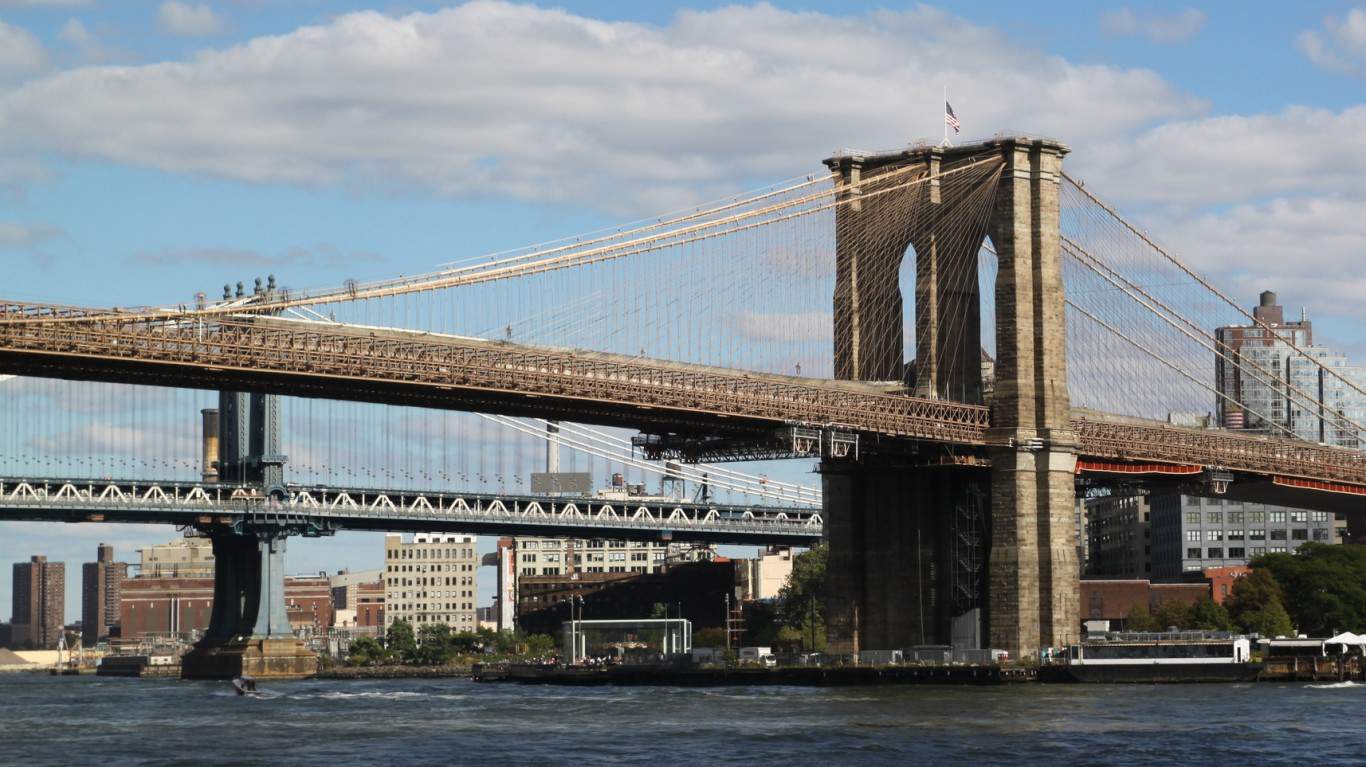
- Avg. age of bridges: 69 years
- Bridge area in “poor” condition: 16.2%
- Total population: 8,622,467
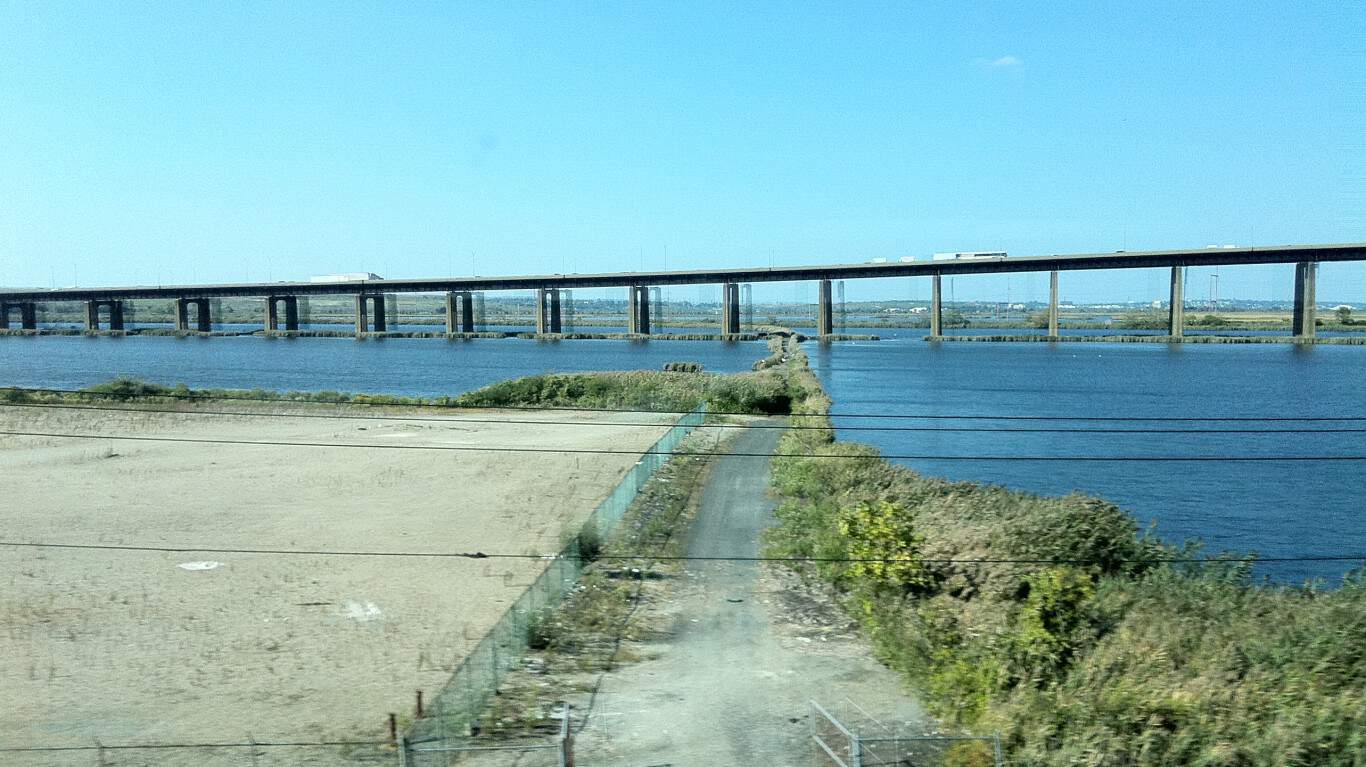
2. Kearny, NJ
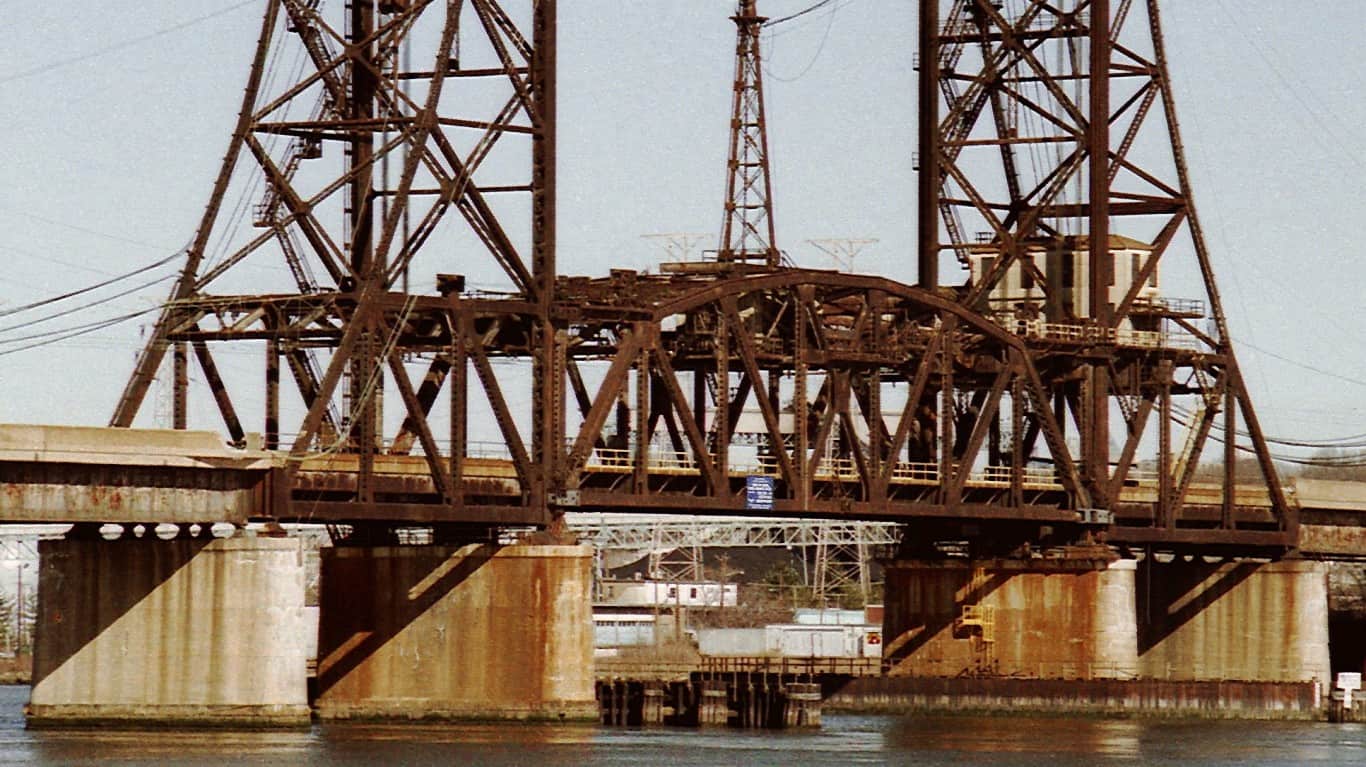
- Avg. age of bridges: 70 years
- Bridge area in “poor” condition: 75.4%
- Total population: 41,157
1. Camden, NJ
- Avg. age of bridges: 81 years
- Bridge area in “poor” condition: 0.6%
- Total population: 71,799