
Where in the U.S. is summer getting hotter? The answer is pretty much everywhere, but some cities are experiencing more drastic increases than others. Are you convinced it’s hotter than any other time in your life? You could be right.
Already in 2024, The Copernicus Climate Change Service, a program established by the European Union, reports that May is the hottest month on record. It’s the 12th consecutive month where the world’s average temperature set a record. It’s hot and only getting hotter.
People turn down the temperature on their AC system’s thermostat as temperatures increase. You may head to a lake, river, ocean, or pool to cool off and try to beat the heat. Excessive heat is dangerous in more ways than you might imagine, and staying hydrated only does so much. Heat increases the risk of serious complications in people with chronic health conditions like high blood pressure, heart disease, and diabetes.
Deaths related to heat exposure reached the highest levels ever during the heatwaves in 2006 per the EPA. EPA statistics for 2018 to 2020 are not ready yet, but an analysis of CDC reports found that more than 3,000 people died from the impact of excessive heat. It’s important to know where it’s getting hotter and plan accordingly to keep yourself and your loved ones cool.
While global temperatures keep increasing, many cities in the U.S. are also experiencing hotter summers. Our list of cities where summer is getting hotter sheds light on where temperatures are soaring. (Also read The Average Summer Temperature Every Decade Since 1895.)
To determine the cities where summer is getting hotter, 24/7 Tempo reviewed historical temperature data from the National Centers for Environmental Information of the National Oceanic and Atmospheric Administration. Metropolitan statistical areas were ranked based on the difference in average maximum temperature during June, July, and August of 2019 through 2023 from the average maximum temperature during June, July, and August of 1901 through 2000. Data was aggregated from the county to the metropolitan level using boundary definitions from the U.S. Census Bureau. Data on population is from the Census Bureau’s 2022 American Community Survey and are five-year estimates.
Here is the list of the cities where summer is getting hotter:
50. St. George, UT

- Avg. max temp., summer 2019-2023: 90.6°F (+2.7°F warmer than normal)
- Avg. max temp., summer 1901-2000: 87.9°F
- Total population: 183,297
49. San Francisco-Oakland-Fremont, CA

Girl looking at beautiful summer coastal landscape, on hiking trip. Woman relaxing on mountain. Golden Gate Bridge, over Pacific Ocean and San Francisco Bay, San Francisco, California, USA.
- Avg. max temp., summer 2019-2023: 77.8°F (+2.7°F warmer than normal)
- Avg. max temp., summer 1901-2000: 75.0°F
- Total population: 4,692,242
48. Atlantic City-Hammonton, NJ
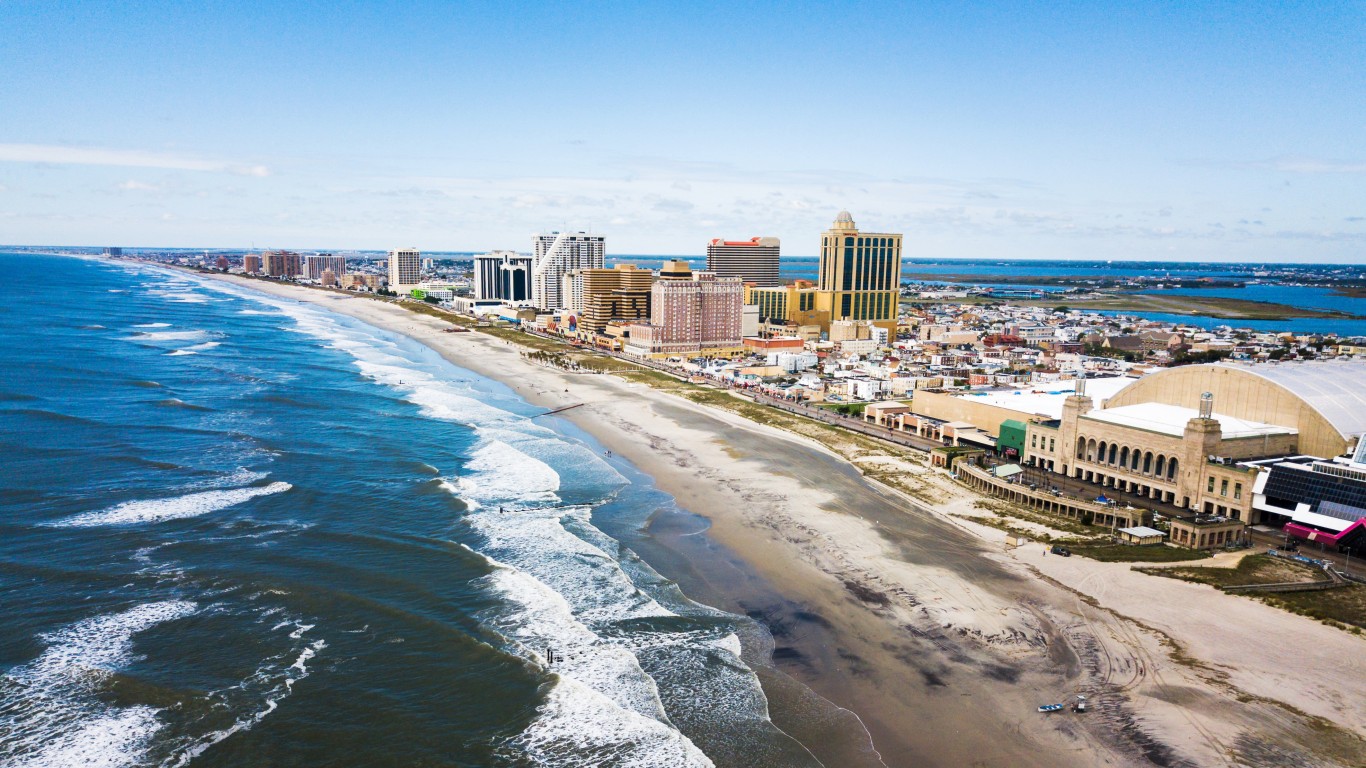
- Avg. max temp., summer 2019-2023: 84.1°F (+2.8°F warmer than normal)
- Avg. max temp., summer 1901-2000: 81.3°F
- Total population: 274,339
47. Fort Collins-Loveland, CO

- Avg. max temp., summer 2019-2023: 77.0°F (+2.8°F warmer than normal)
- Avg. max temp., summer 1901-2000: 74.2°F
- Total population: 359,363
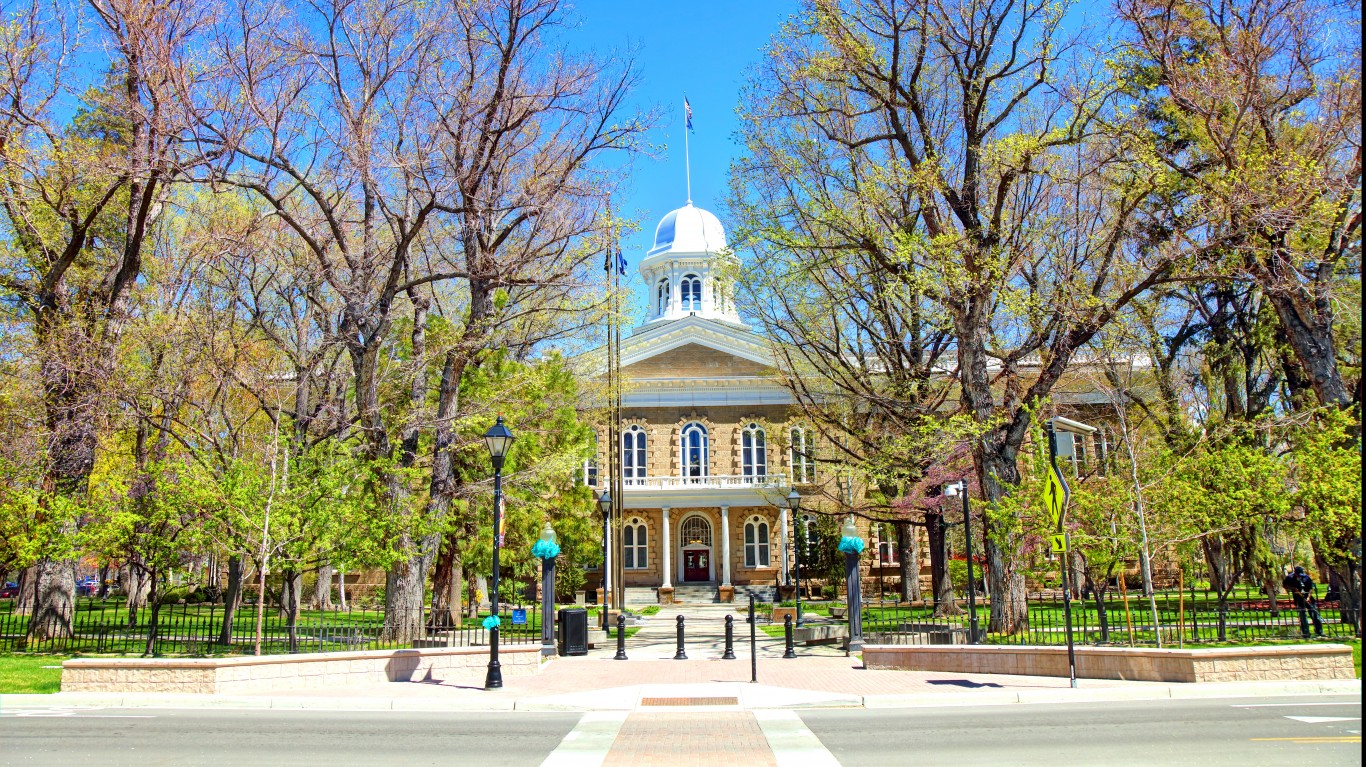
46. Reno, NV

- Avg. max temp., summer 2019-2023: 85.9°F (+2.8°F warmer than normal)
- Avg. max temp., summer 1901-2000: 83.1°F
- Total population: 490,769
45. Carson City, NV
- Avg. max temp., summer 2019-2023: 84.6°F (+2.8°F warmer than normal)
- Avg. max temp., summer 1901-2000: 81.8°F
- Total population: 58,249
44. Riverside-San Bernardino-Ontario, CA
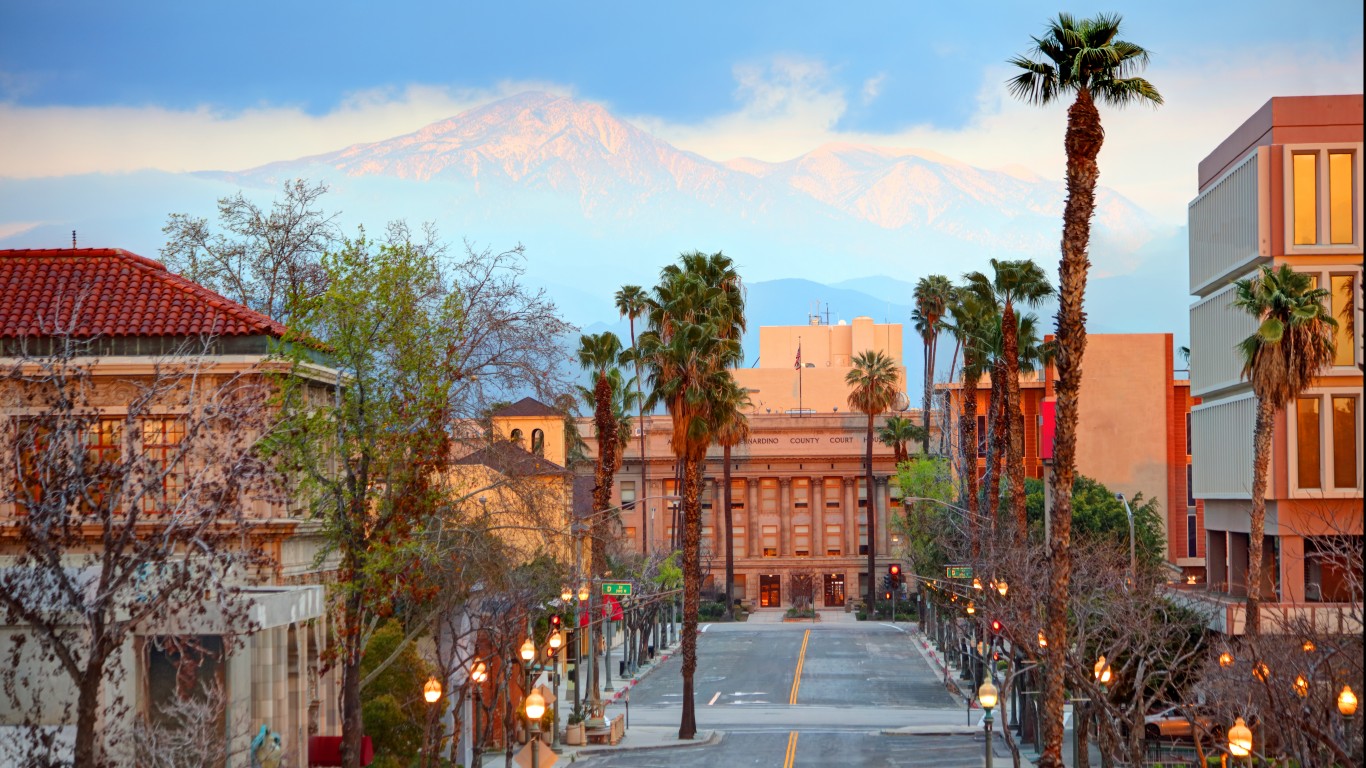
- Avg. max temp., summer 2019-2023: 99.8°F (+2.8°F warmer than normal)
- Avg. max temp., summer 1901-2000: 97.0°F
- Total population: 4,610,050
43. Coeur d’Alene, ID

- Avg. max temp., summer 2019-2023: 78.9°F (+2.8°F warmer than normal)
- Avg. max temp., summer 1901-2000: 76.1°F
- Total population: 173,396
42. Twin Falls, ID

- Avg. max temp., summer 2019-2023: 85.6°F (+2.9°F warmer than normal)
- Avg. max temp., summer 1901-2000: 82.7°F
- Total population: 115,066
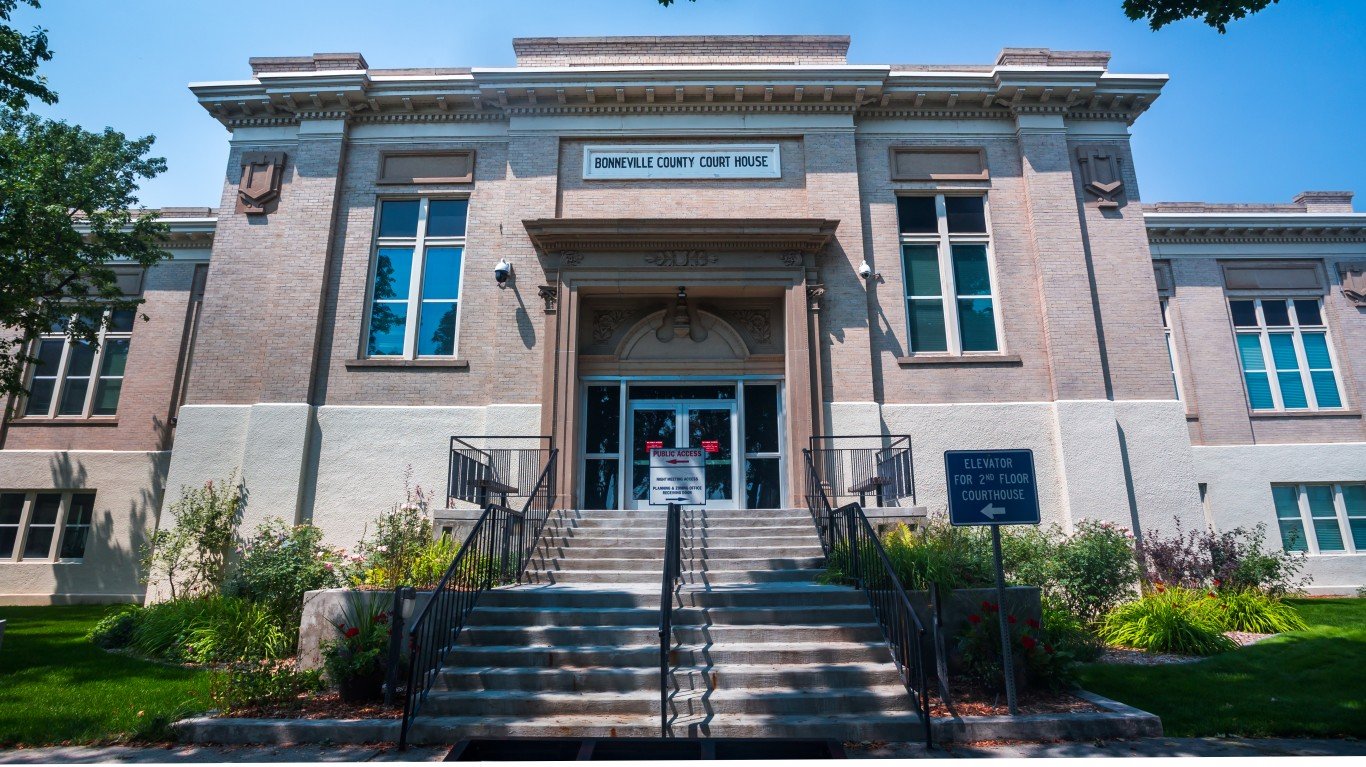
41. Sierra Vista-Douglas, AZ

- Avg. max temp., summer 2019-2023: 93.8°F (+2.9°F warmer than normal)
- Avg. max temp., summer 1901-2000: 90.9°F
- Total population: 125,504
40. San Diego-Chula Vista-Carlsbad, CA

San Diego, California, USA downtown skyline.
- Avg. max temp., summer 2019-2023: 89.9°F (+2.9°F warmer than normal)
- Avg. max temp., summer 1901-2000: 87.0°F
- Total population: 3,289,701
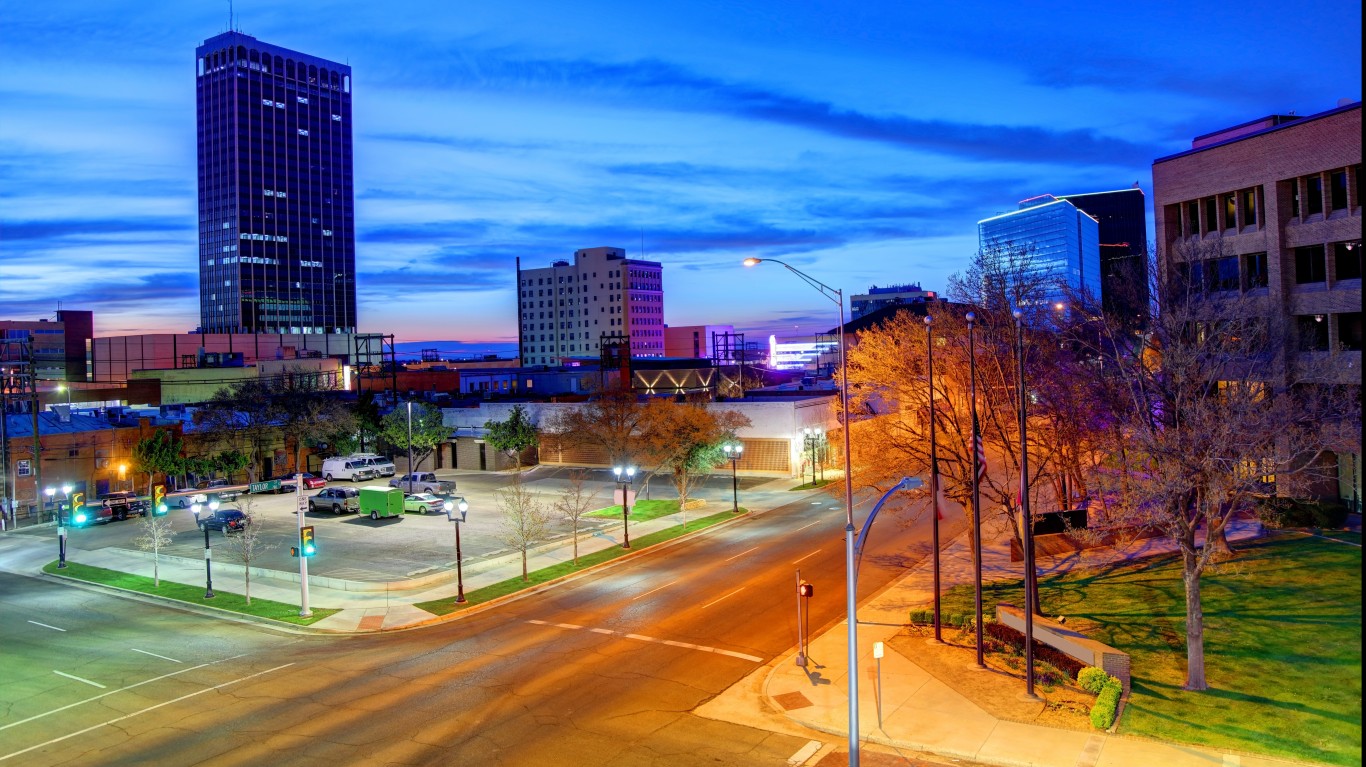
39. Odessa, TX
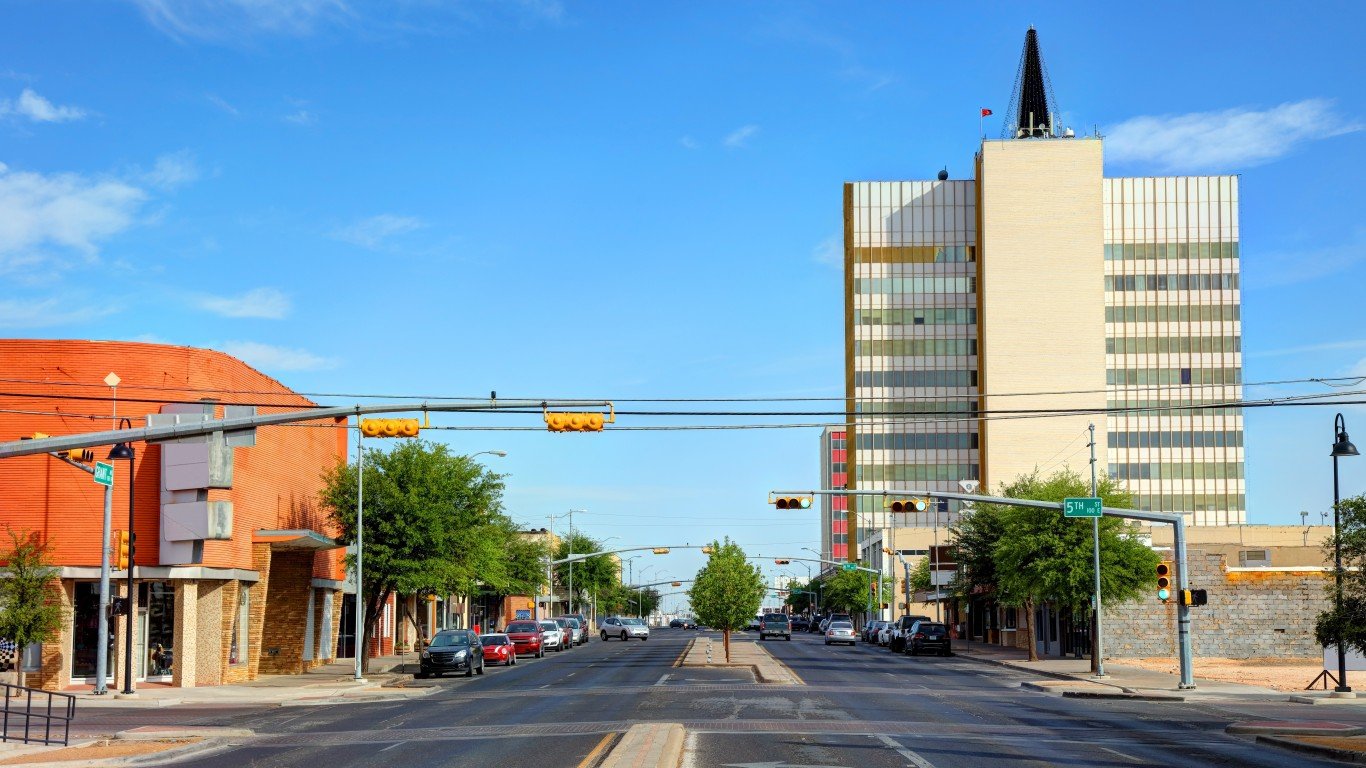
- Avg. max temp., summer 2019-2023: 96.9°F (+2.9°F warmer than normal)
- Avg. max temp., summer 1901-2000: 94.0°F
- Total population: 162,300
38. Idaho Falls, ID
- Avg. max temp., summer 2019-2023: 81.0°F (+2.9°F warmer than normal)
- Avg. max temp., summer 1901-2000: 78.1°F
- Total population: 158,478
37. Santa Maria-Santa Barbara, CA

- Avg. max temp., summer 2019-2023: 81.7°F (+2.9°F warmer than normal)
- Avg. max temp., summer 1901-2000: 78.8°F
- Total population: 445,213
36. Longview-Kelso, WA

- Avg. max temp., summer 2019-2023: 75.4°F (+2.9°F warmer than normal)
- Avg. max temp., summer 1901-2000: 72.5°F
- Total population: 110,621
35. Providence-Warwick, RI-MA
- Avg. max temp., summer 2019-2023: 80.7°F (+3.0°F warmer than normal)
- Avg. max temp., summer 1901-2000: 77.7°F
- Total population: 1,670,949
34. Amarillo, TX
- Avg. max temp., summer 2019-2023: 93.0°F (+3.0°F warmer than normal)
- Avg. max temp., summer 1901-2000: 90.1°F
- Total population: 269,278
33. Salisbury, MD

- Avg. max temp., summer 2019-2023: 87.1°F (+3.0°F warmer than normal)
- Avg. max temp., summer 1901-2000: 84.2°F
- Total population: 421,982
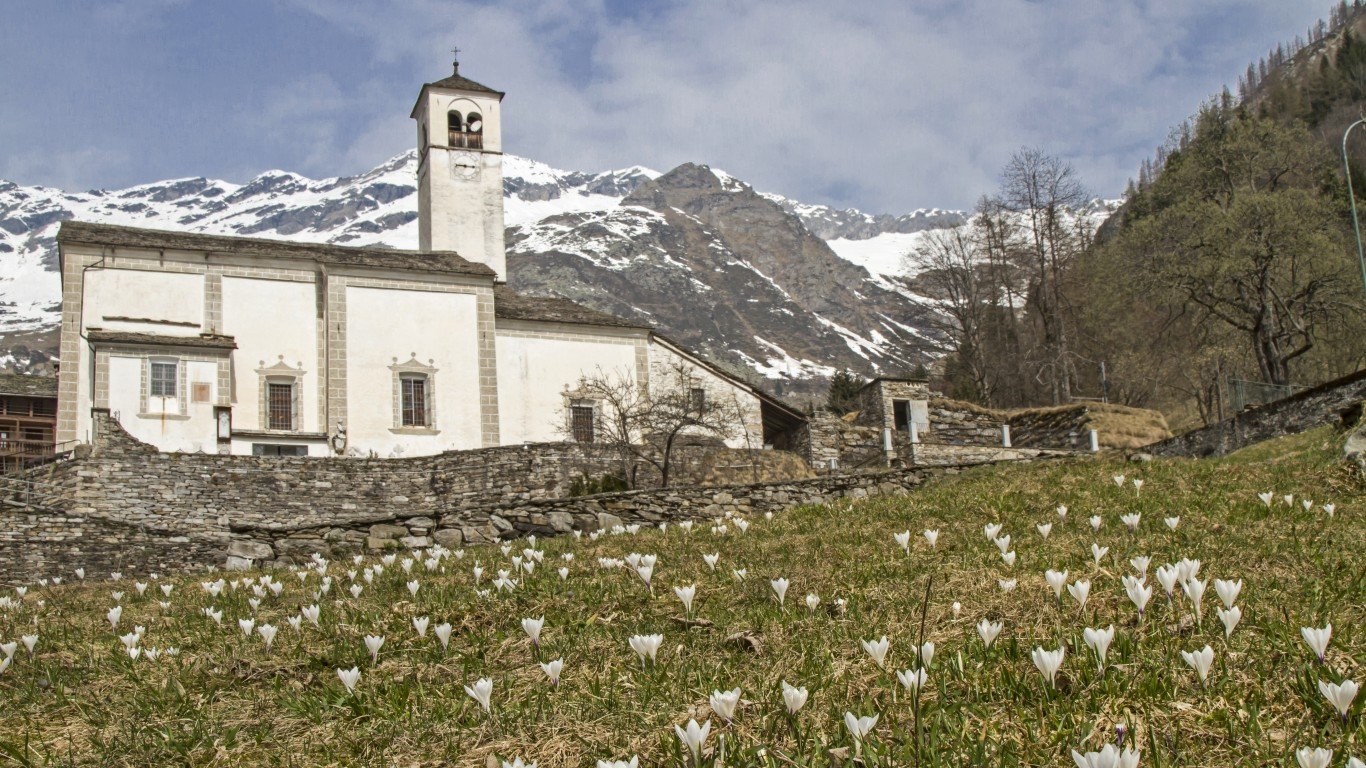
32. Logan, UT-ID
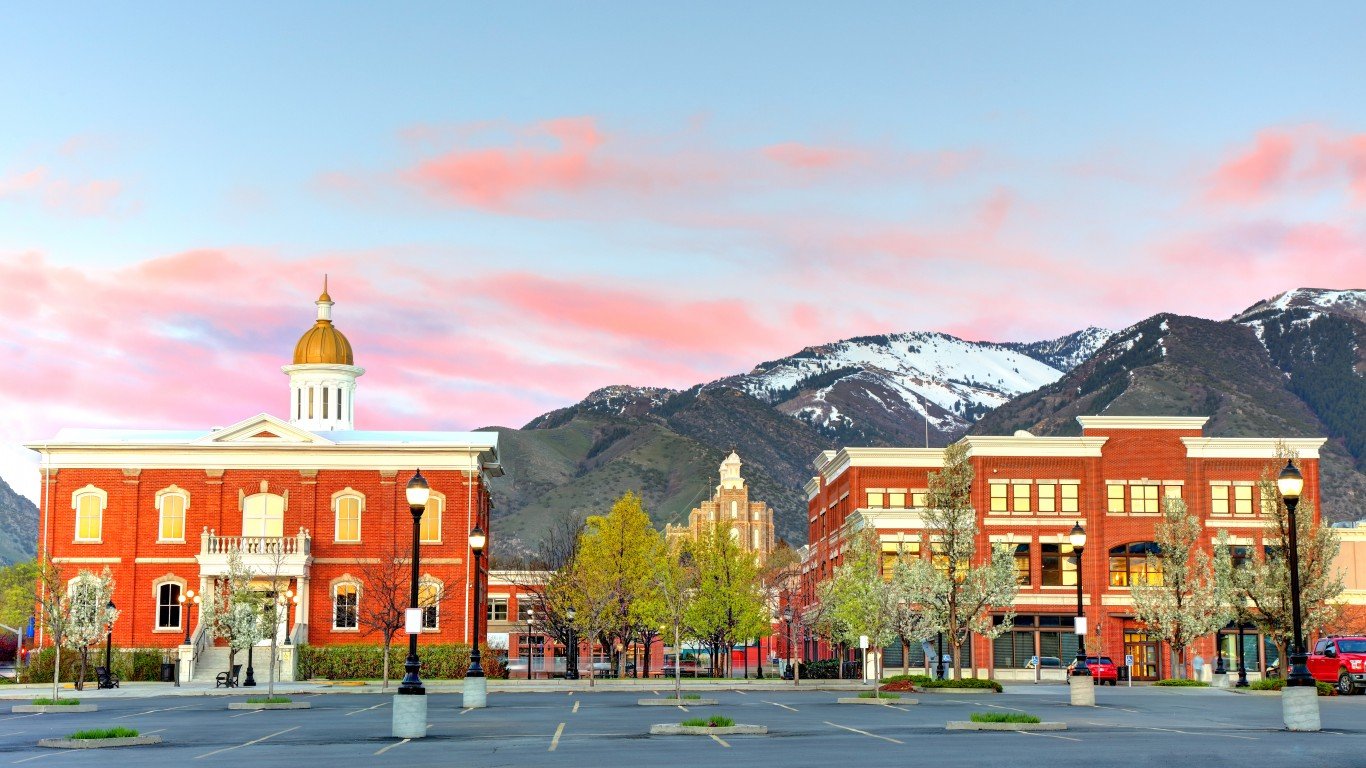
- Avg. max temp., summer 2019-2023: 80.0°F (+3.0°F warmer than normal)
- Avg. max temp., summer 1901-2000: 77.1°F
- Total population: 148,804
31. El Paso, TX

- Avg. max temp., summer 2019-2023: 96.0°F (+3.0°F warmer than normal)
- Avg. max temp., summer 1901-2000: 93.0°F
- Total population: 867,161
30. Trenton-Princeton, NJ

- Avg. max temp., summer 2019-2023: 85.8°F (+3.0°F warmer than normal)
- Avg. max temp., summer 1901-2000: 82.8°F
- Total population: 383,732
29. Santa Cruz-Watsonville, CA

- Avg. max temp., summer 2019-2023: 78.3°F (+3.0°F warmer than normal)
- Avg. max temp., summer 1901-2000: 75.3°F
- Total population: 268,571
28. Spokane-Spokane Valley, WA
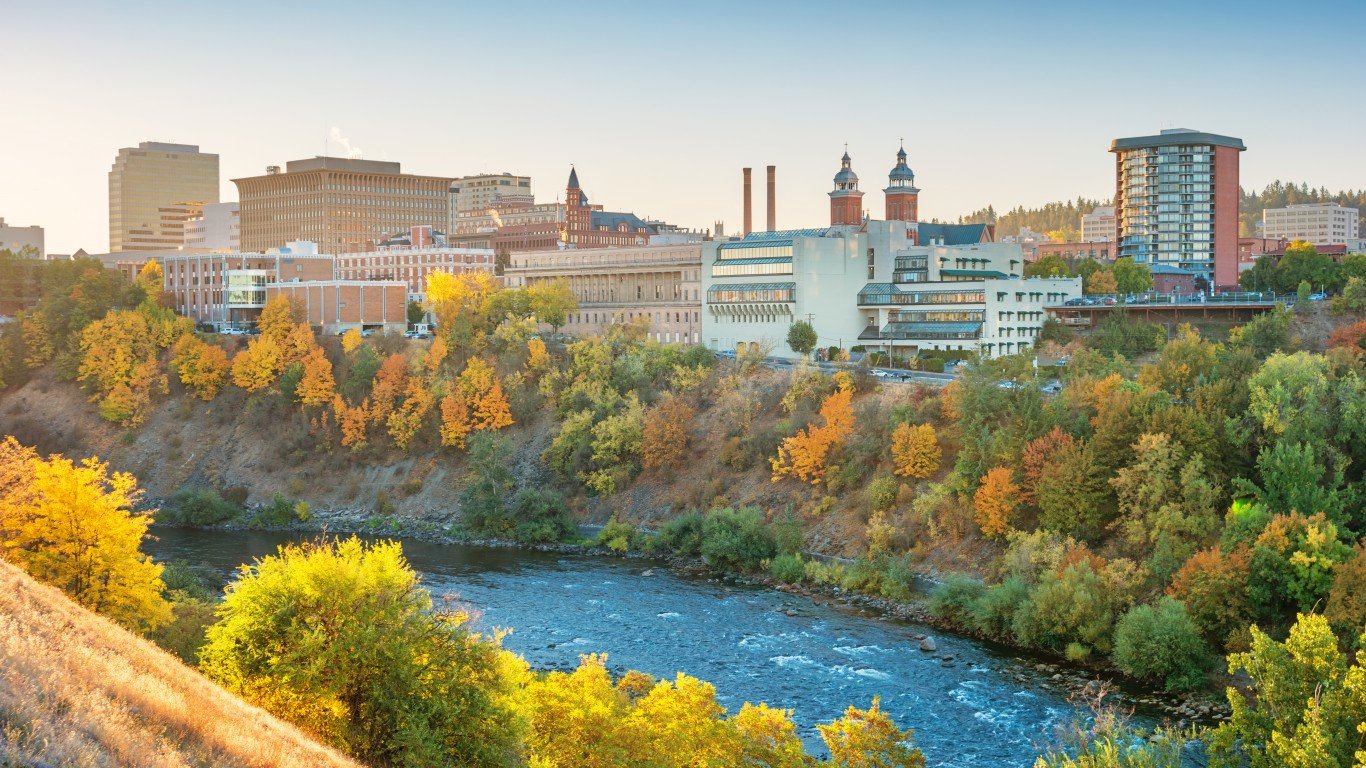
- Avg. max temp., summer 2019-2023: 81.3°F (+3.0°F warmer than normal)
- Avg. max temp., summer 1901-2000: 78.3°F
- Total population: 585,485
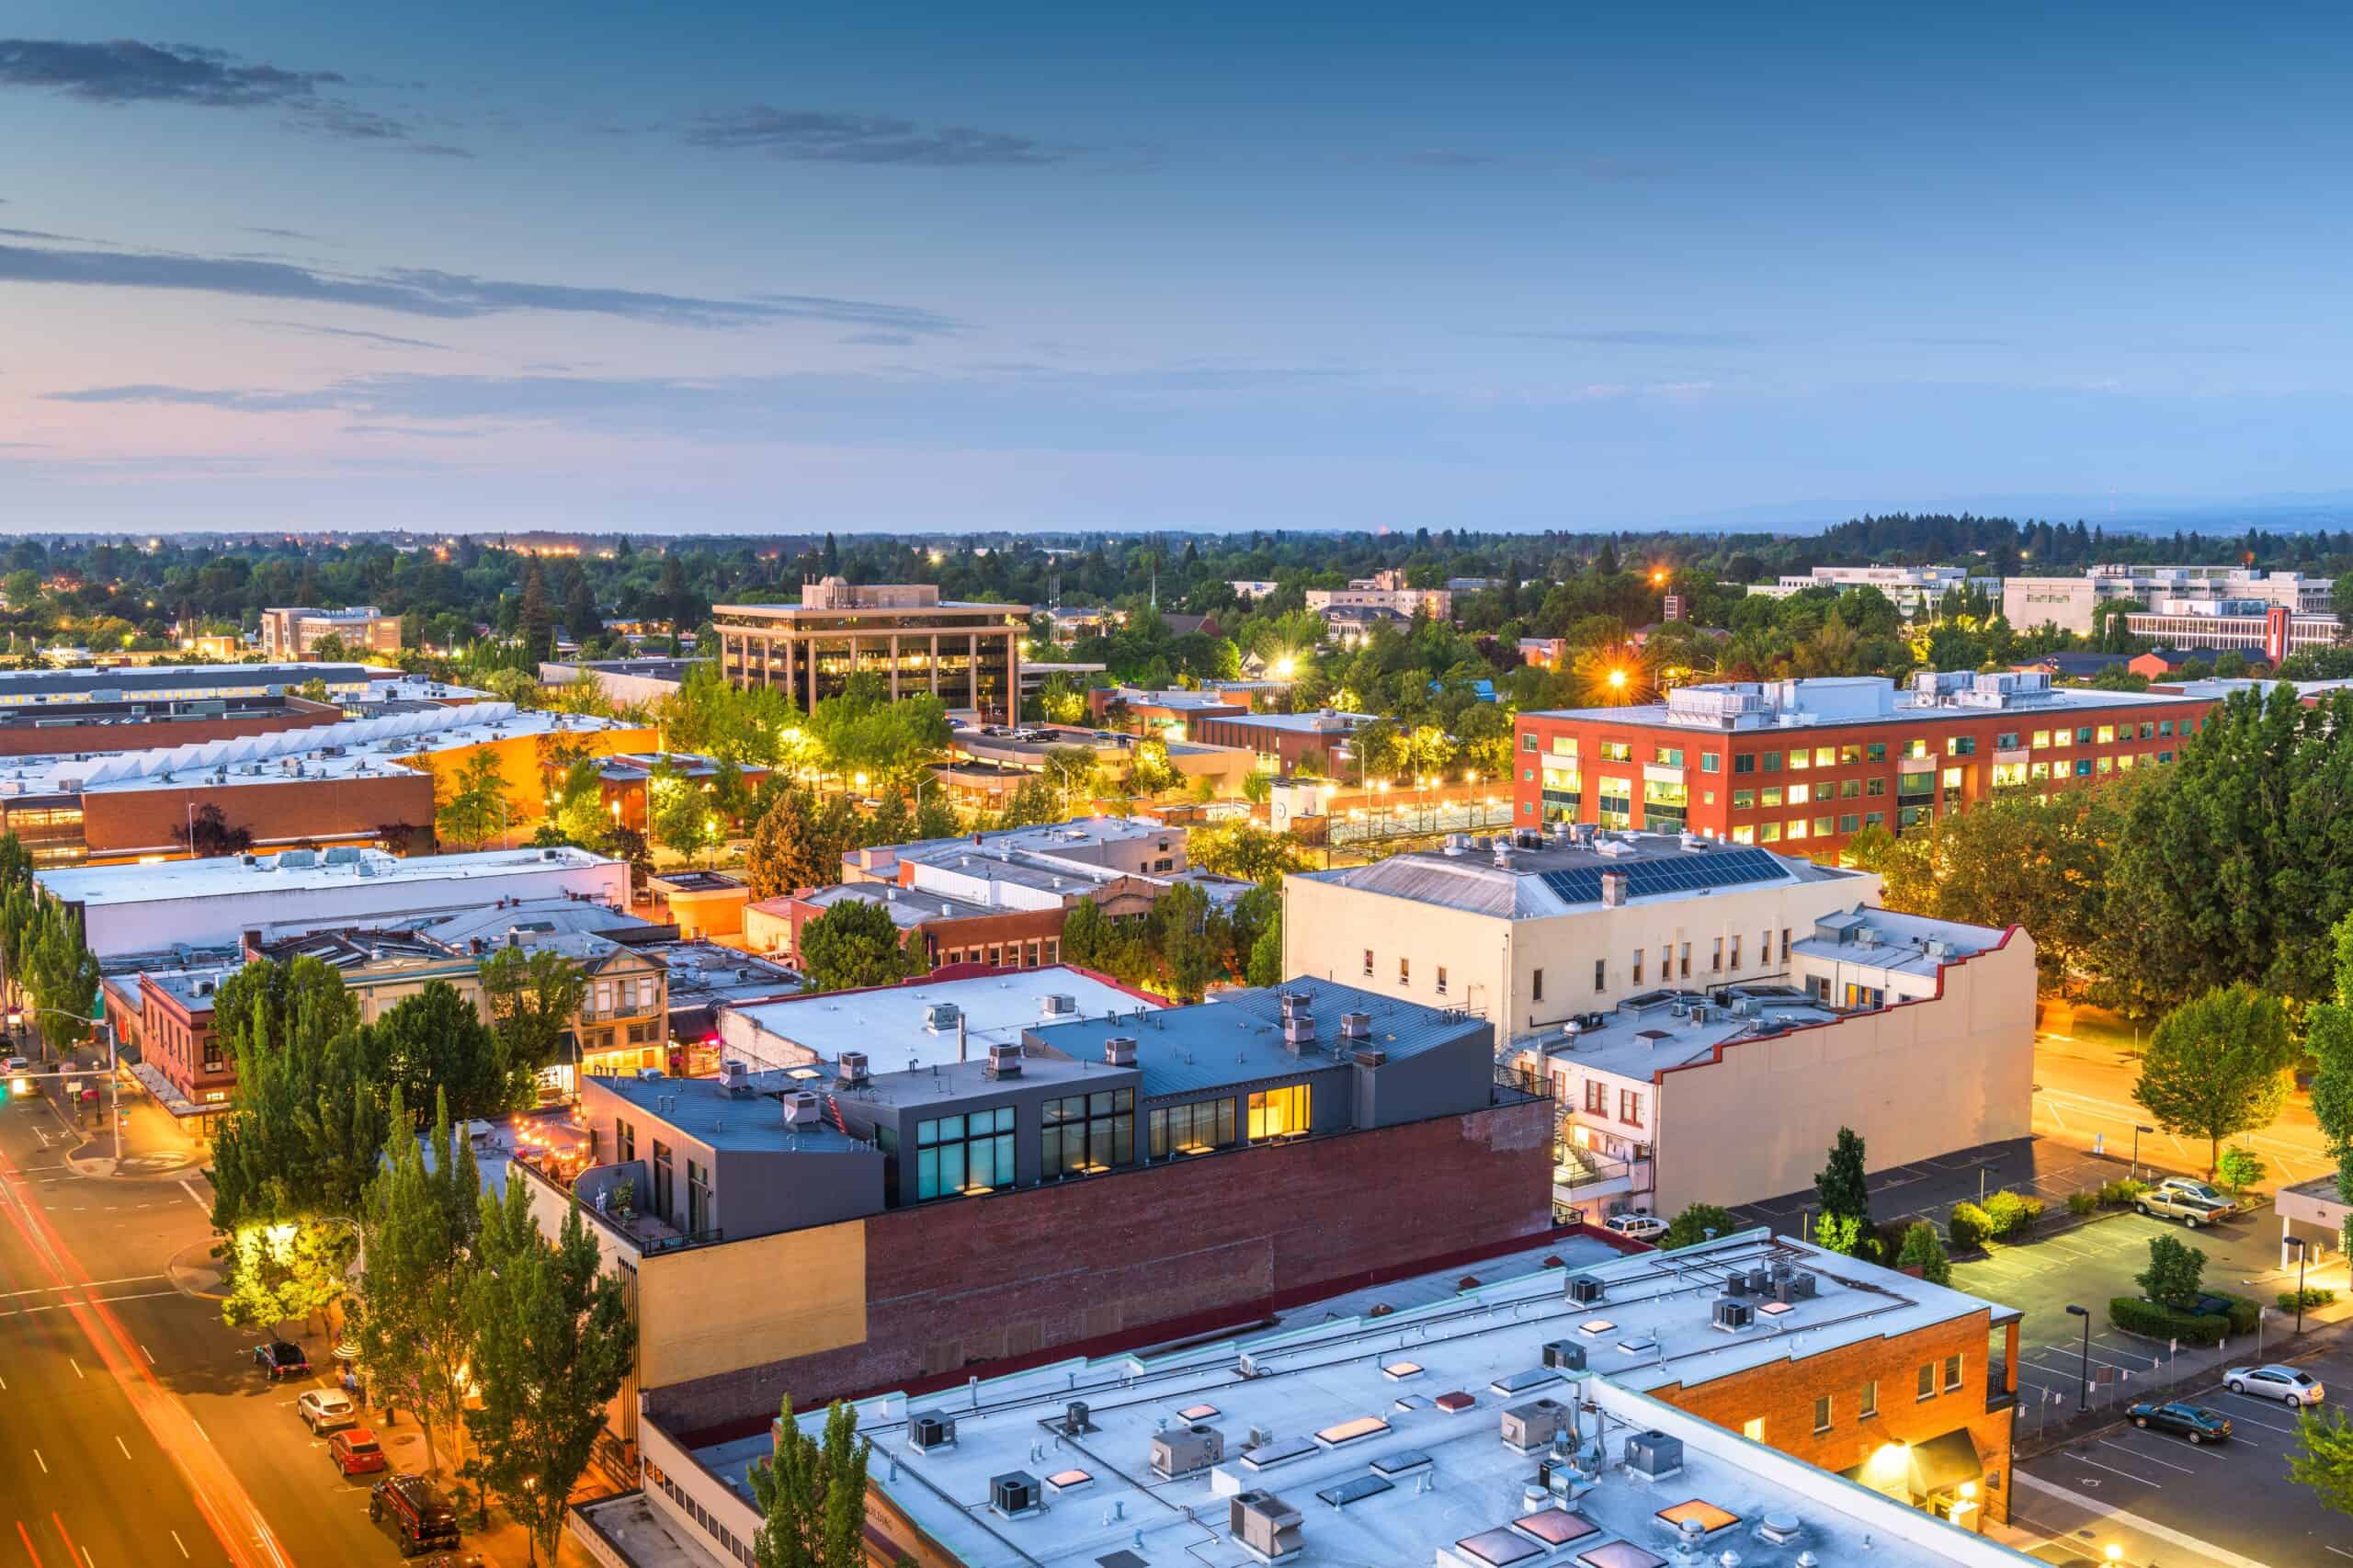
27. Portland-Vancouver-Hillsboro, OR-WA
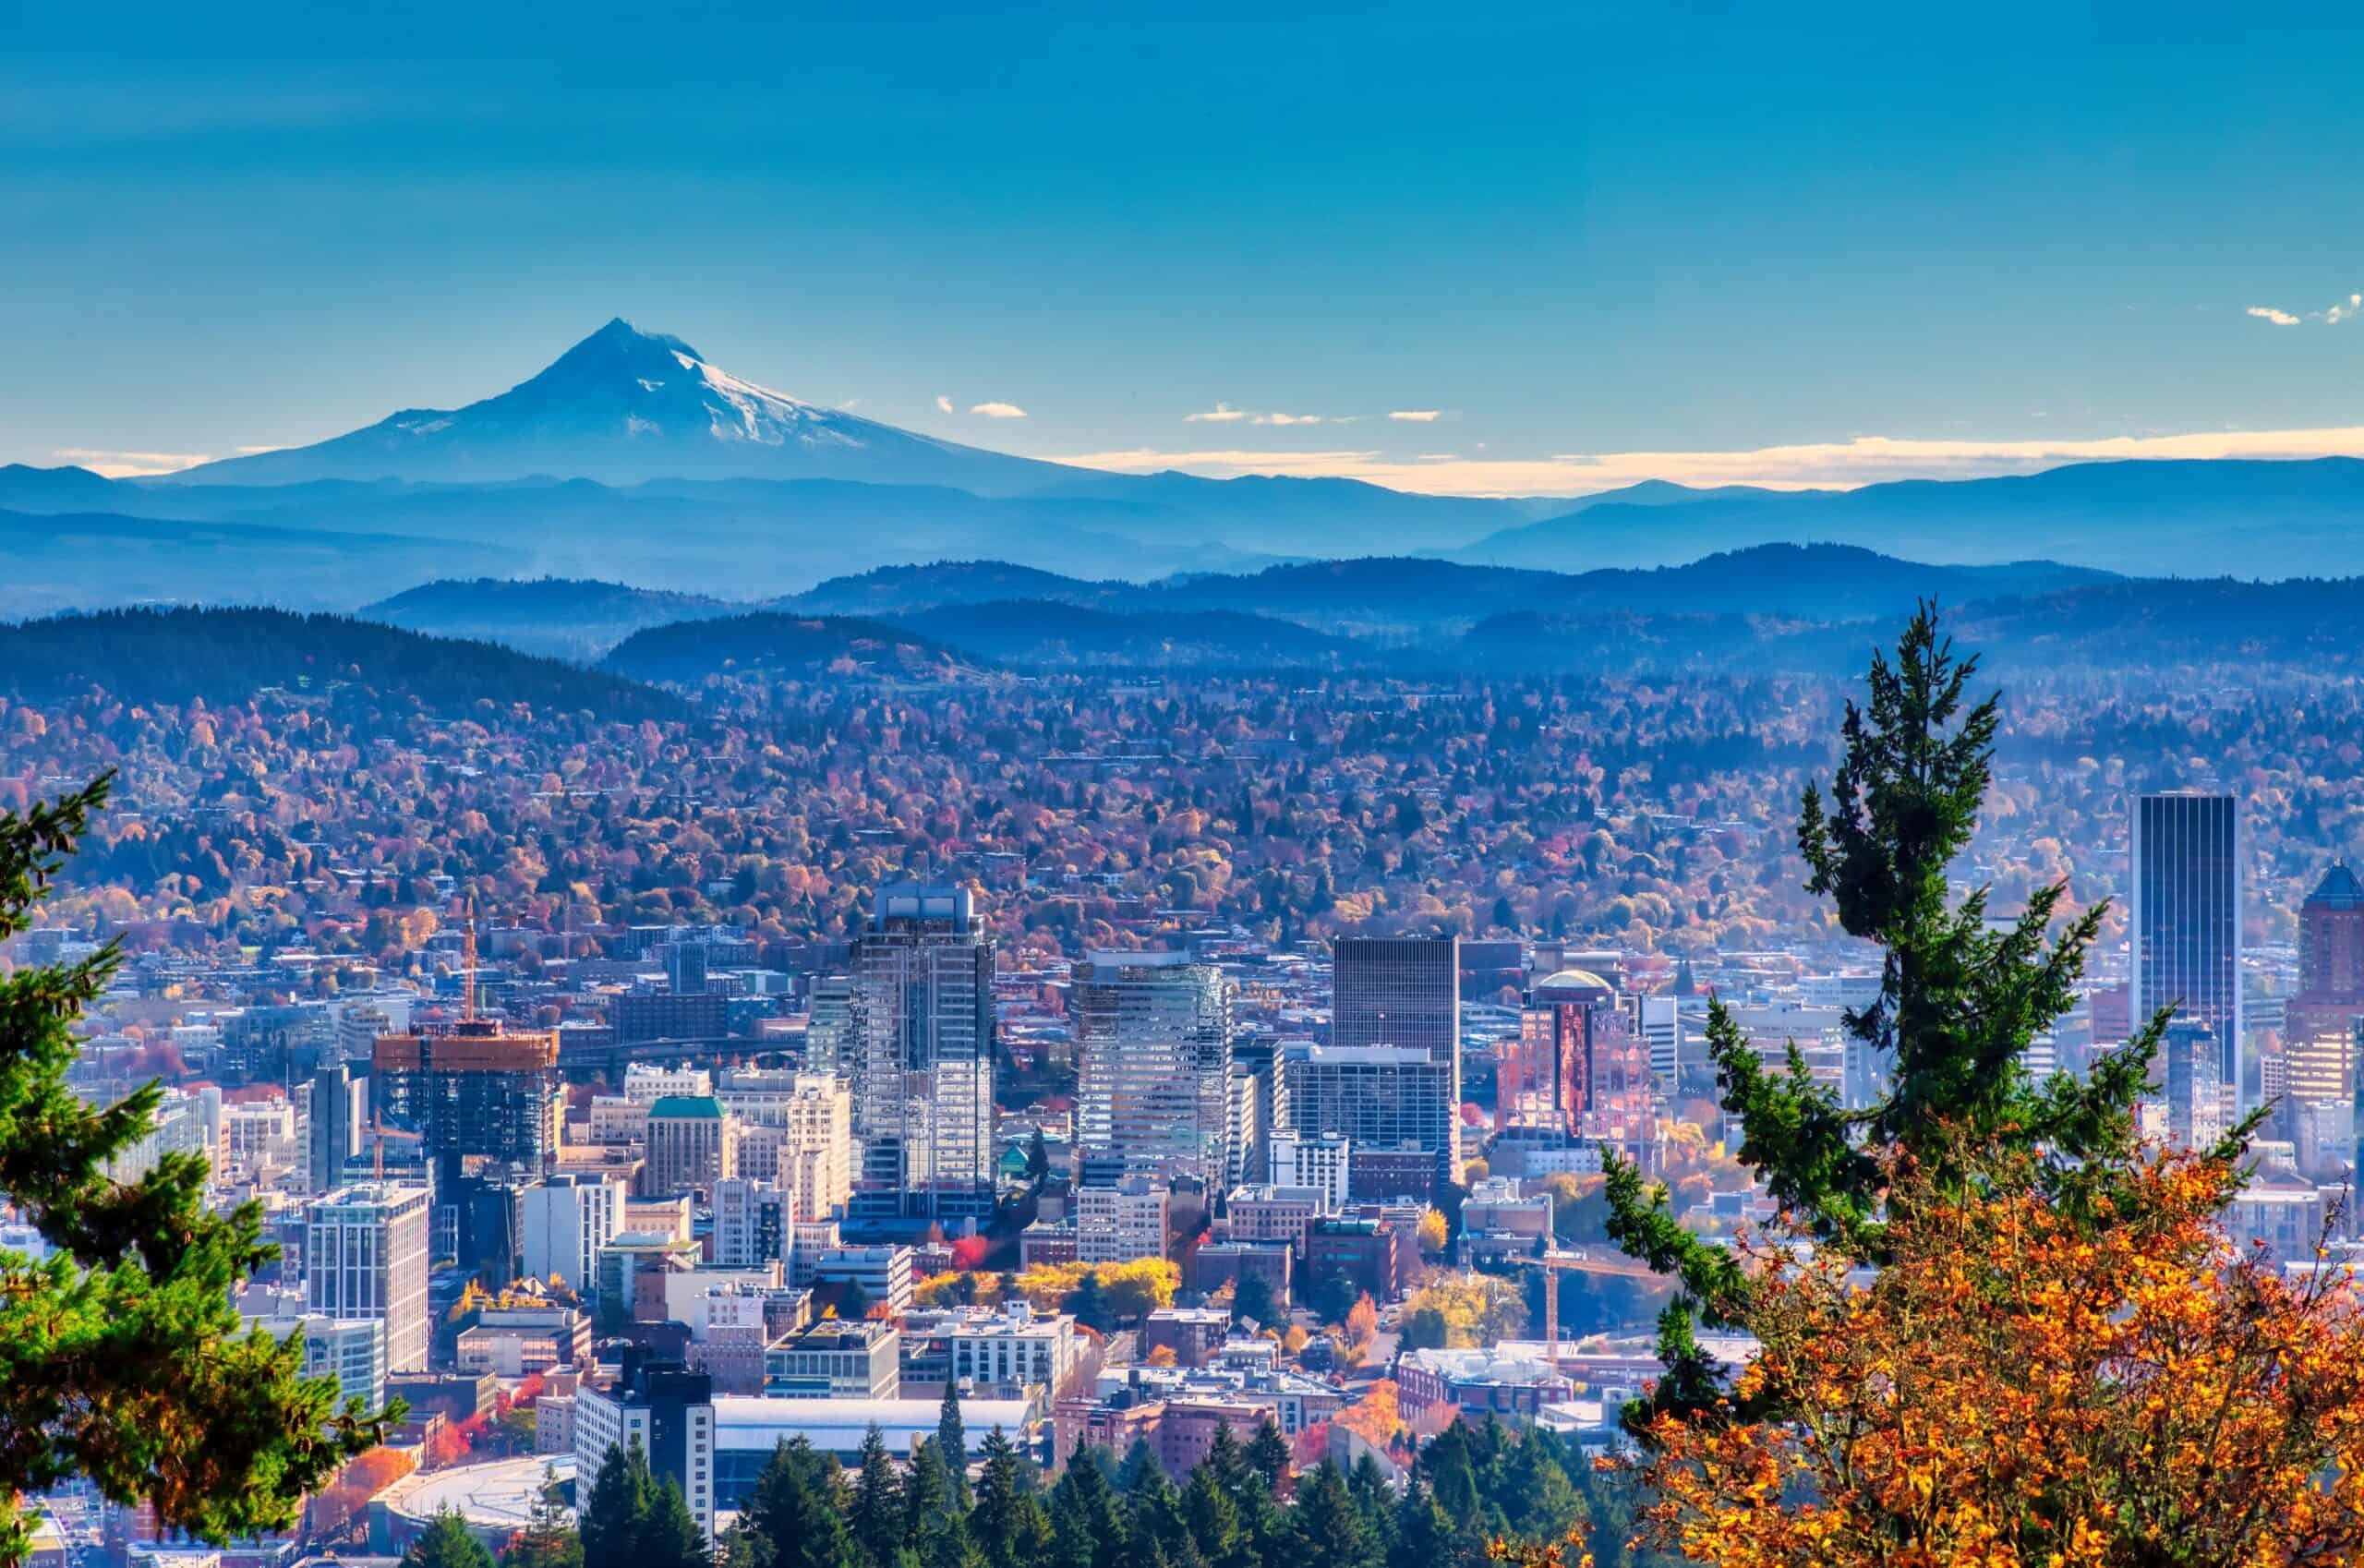
Aerial view of Portland, Oregon take in Autumn
- Avg. max temp., summer 2019-2023: 76.7°F (+3.0°F warmer than normal)
- Avg. max temp., summer 1901-2000: 73.7°F
- Total population: 2,505,312
26. Provo-Orem-Lehi, UT

- Avg. max temp., summer 2019-2023: 86.4°F (+3.1°F warmer than normal)
- Avg. max temp., summer 1901-2000: 83.4°F
- Total population: 677,964
25. Santa Fe, NM

- Avg. max temp., summer 2019-2023: 85.0°F (+3.1°F warmer than normal)
- Avg. max temp., summer 1901-2000: 81.9°F
- Total population: 154,481
24. Yuba City, CA
- Avg. max temp., summer 2019-2023: 94.6°F (+3.1°F warmer than normal)
- Avg. max temp., summer 1901-2000: 91.5°F
- Total population: 180,806
23. Albuquerque, NM
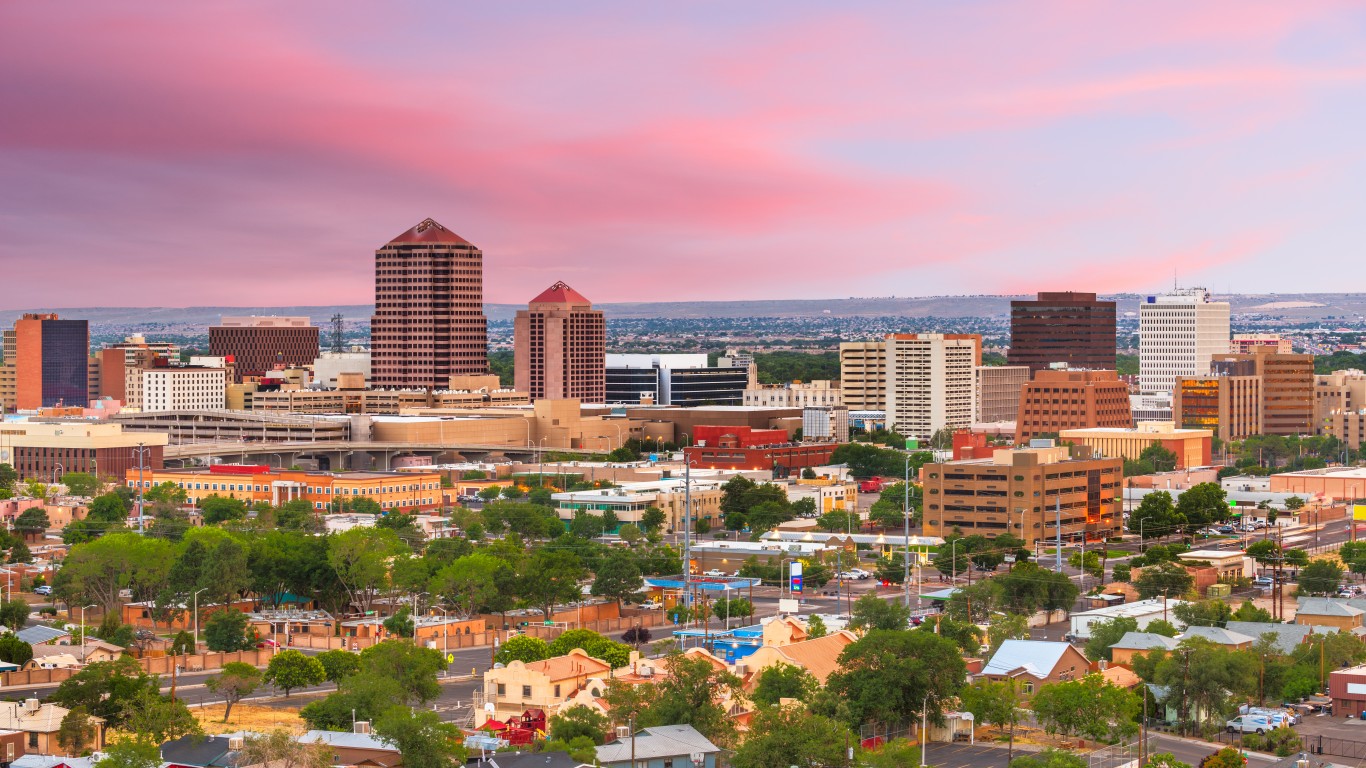
- Avg. max temp., summer 2019-2023: 88.6°F (+3.2°F warmer than normal)
- Avg. max temp., summer 1901-2000: 85.5°F
- Total population: 915,968
22. Chico, CA
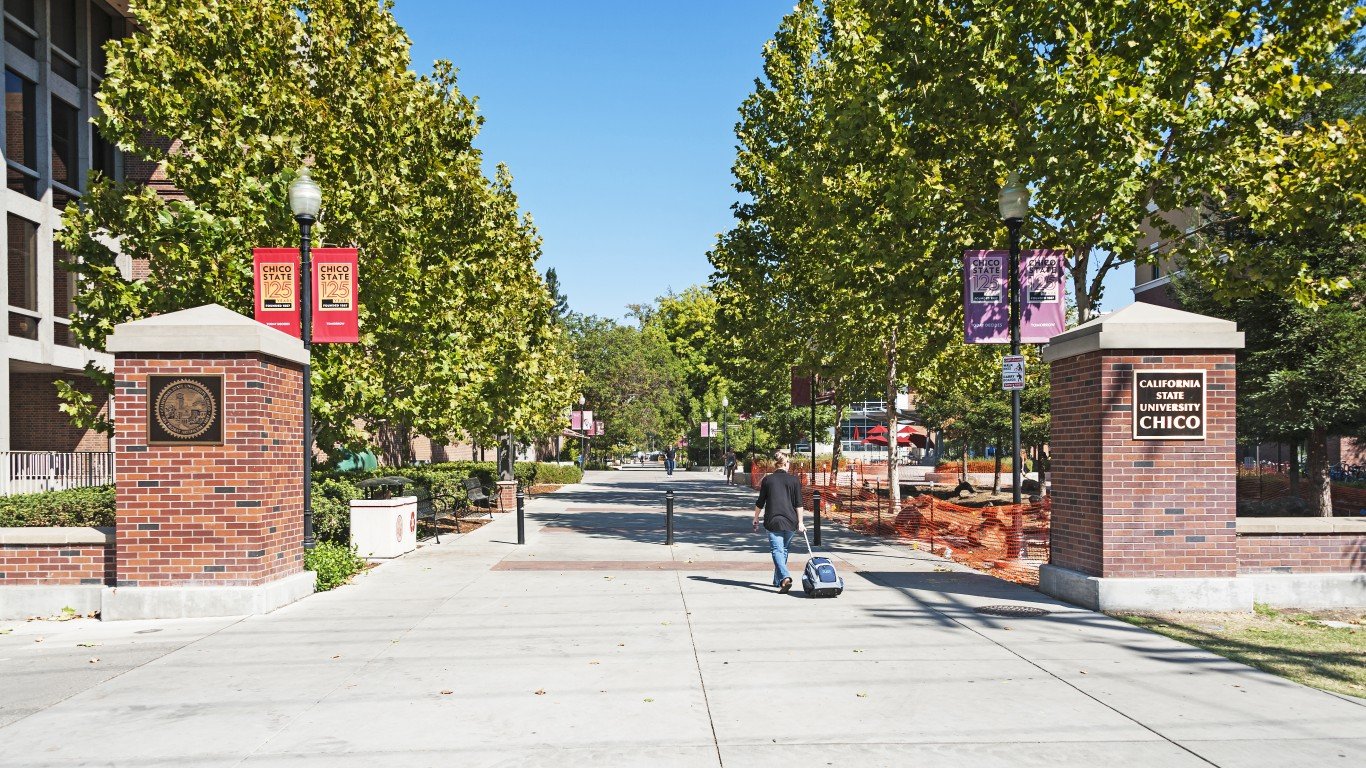
- Avg. max temp., summer 2019-2023: 92.5°F (+3.2°F warmer than normal)
- Avg. max temp., summer 1901-2000: 89.3°F
- Total population: 213,605
21. Colorado Springs, CO
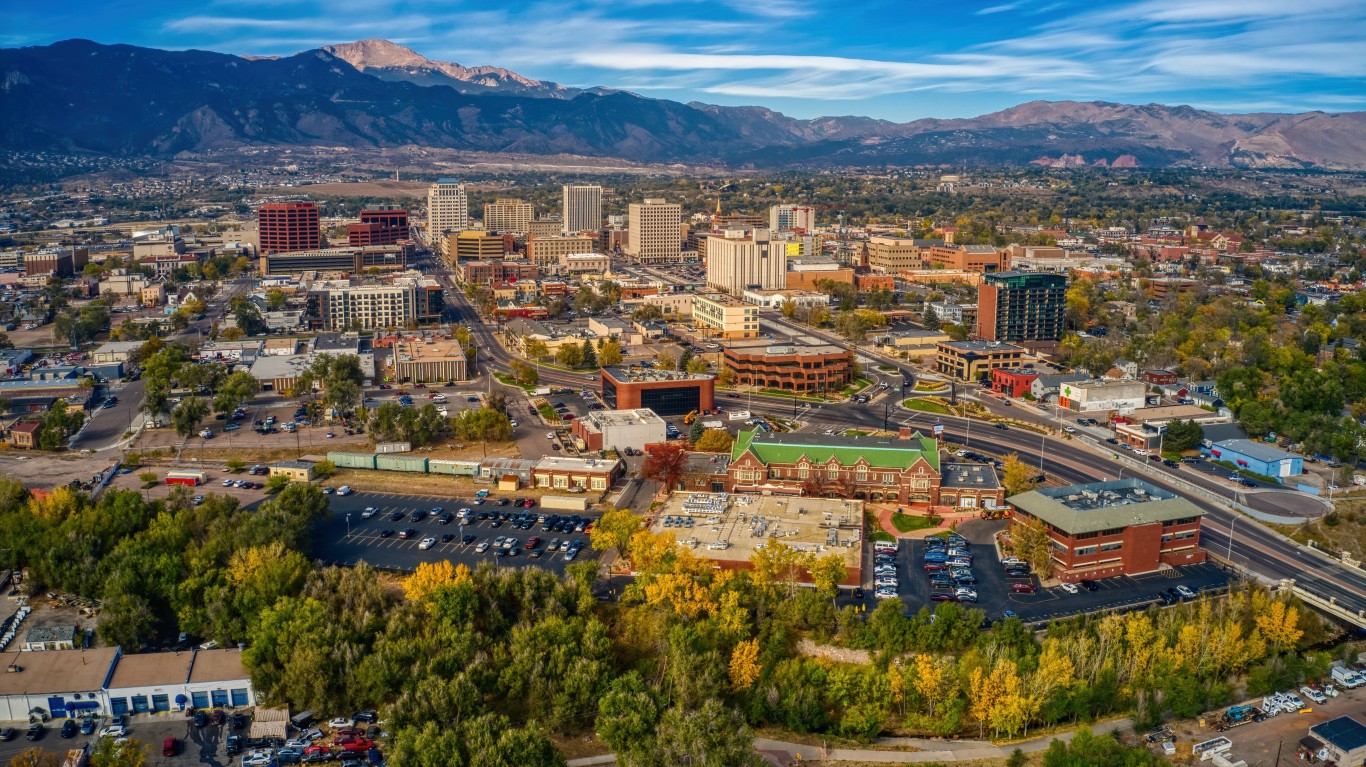
- Avg. max temp., summer 2019-2023: 79.3°F (+3.2°F warmer than normal)
- Avg. max temp., summer 1901-2000: 76.2°F
- Total population: 755,081
20. Flagstaff, AZ
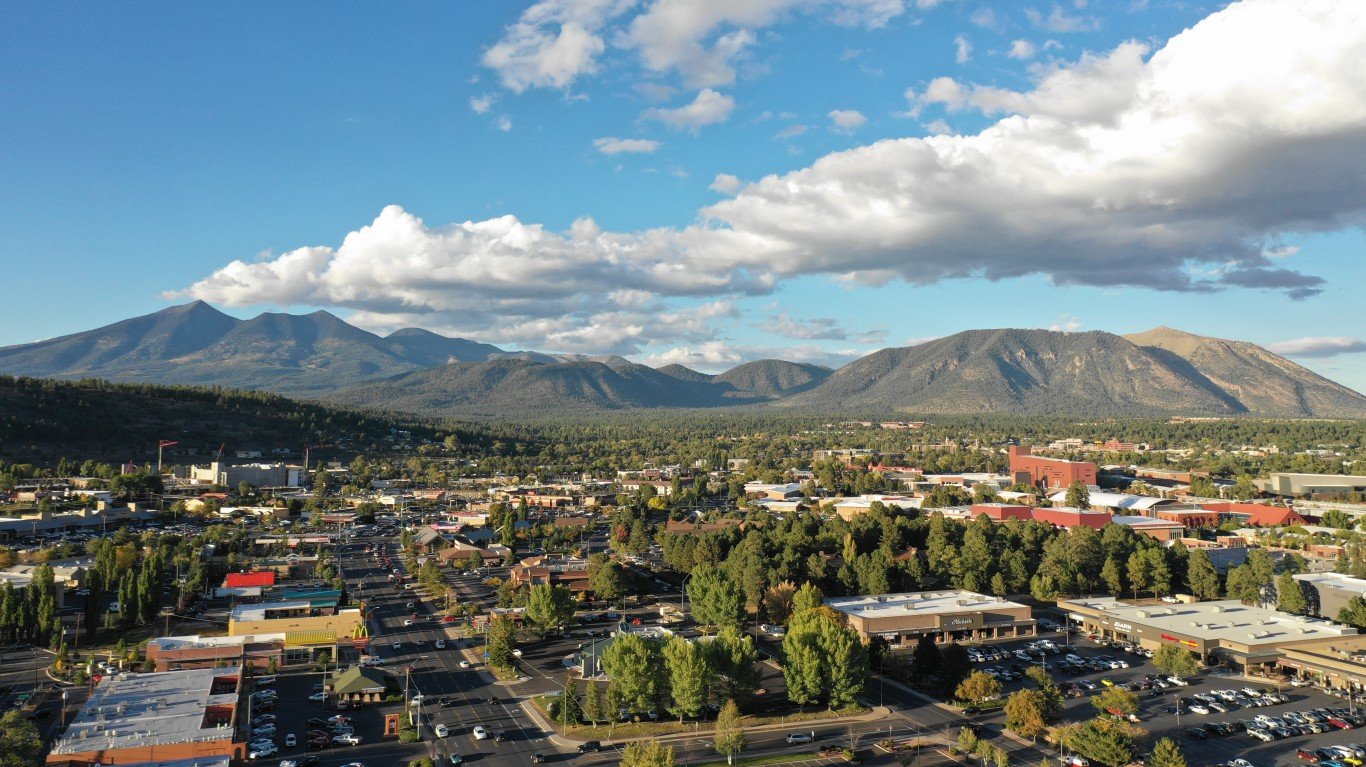
- Avg. max temp., summer 2019-2023: 89.3°F (+3.2°F warmer than normal)
- Avg. max temp., summer 1901-2000: 86.1°F
- Total population: 144,705
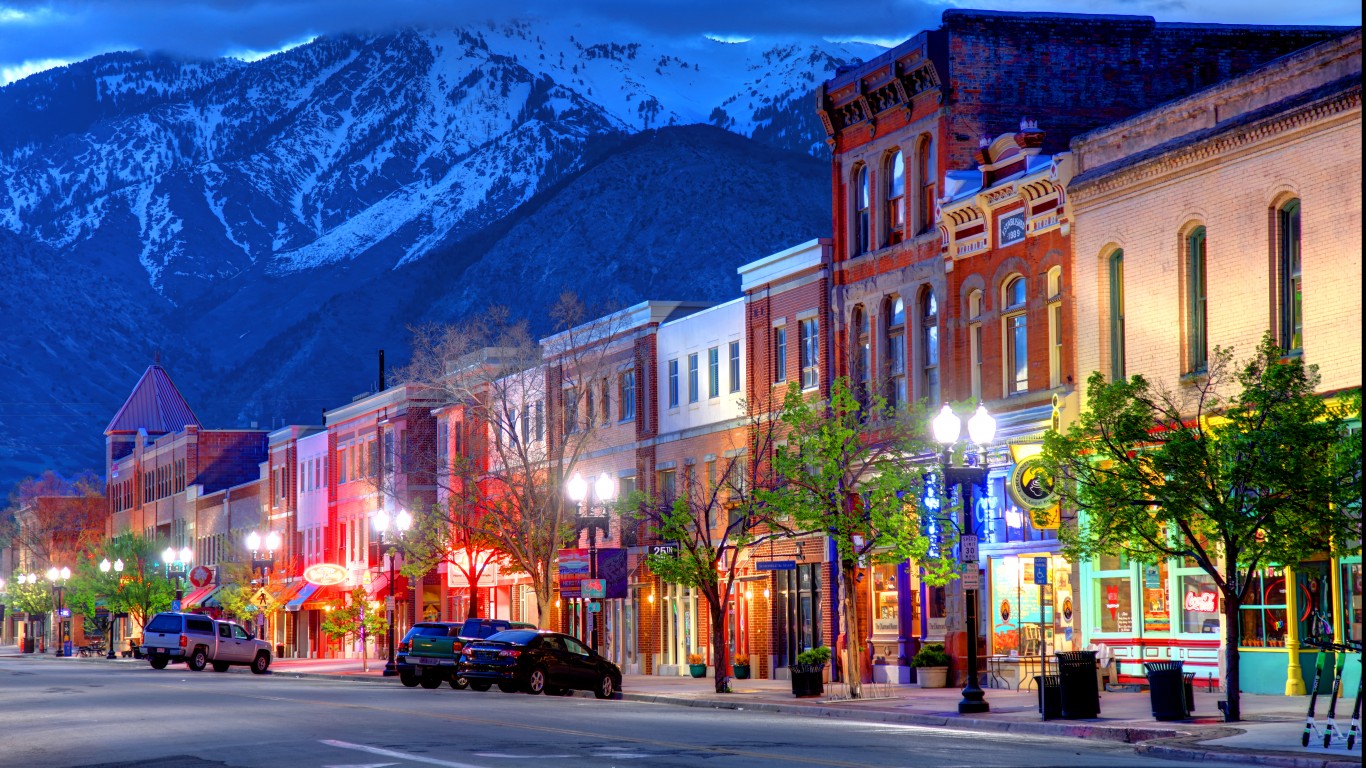
19. Salt Lake City-Murray, UT
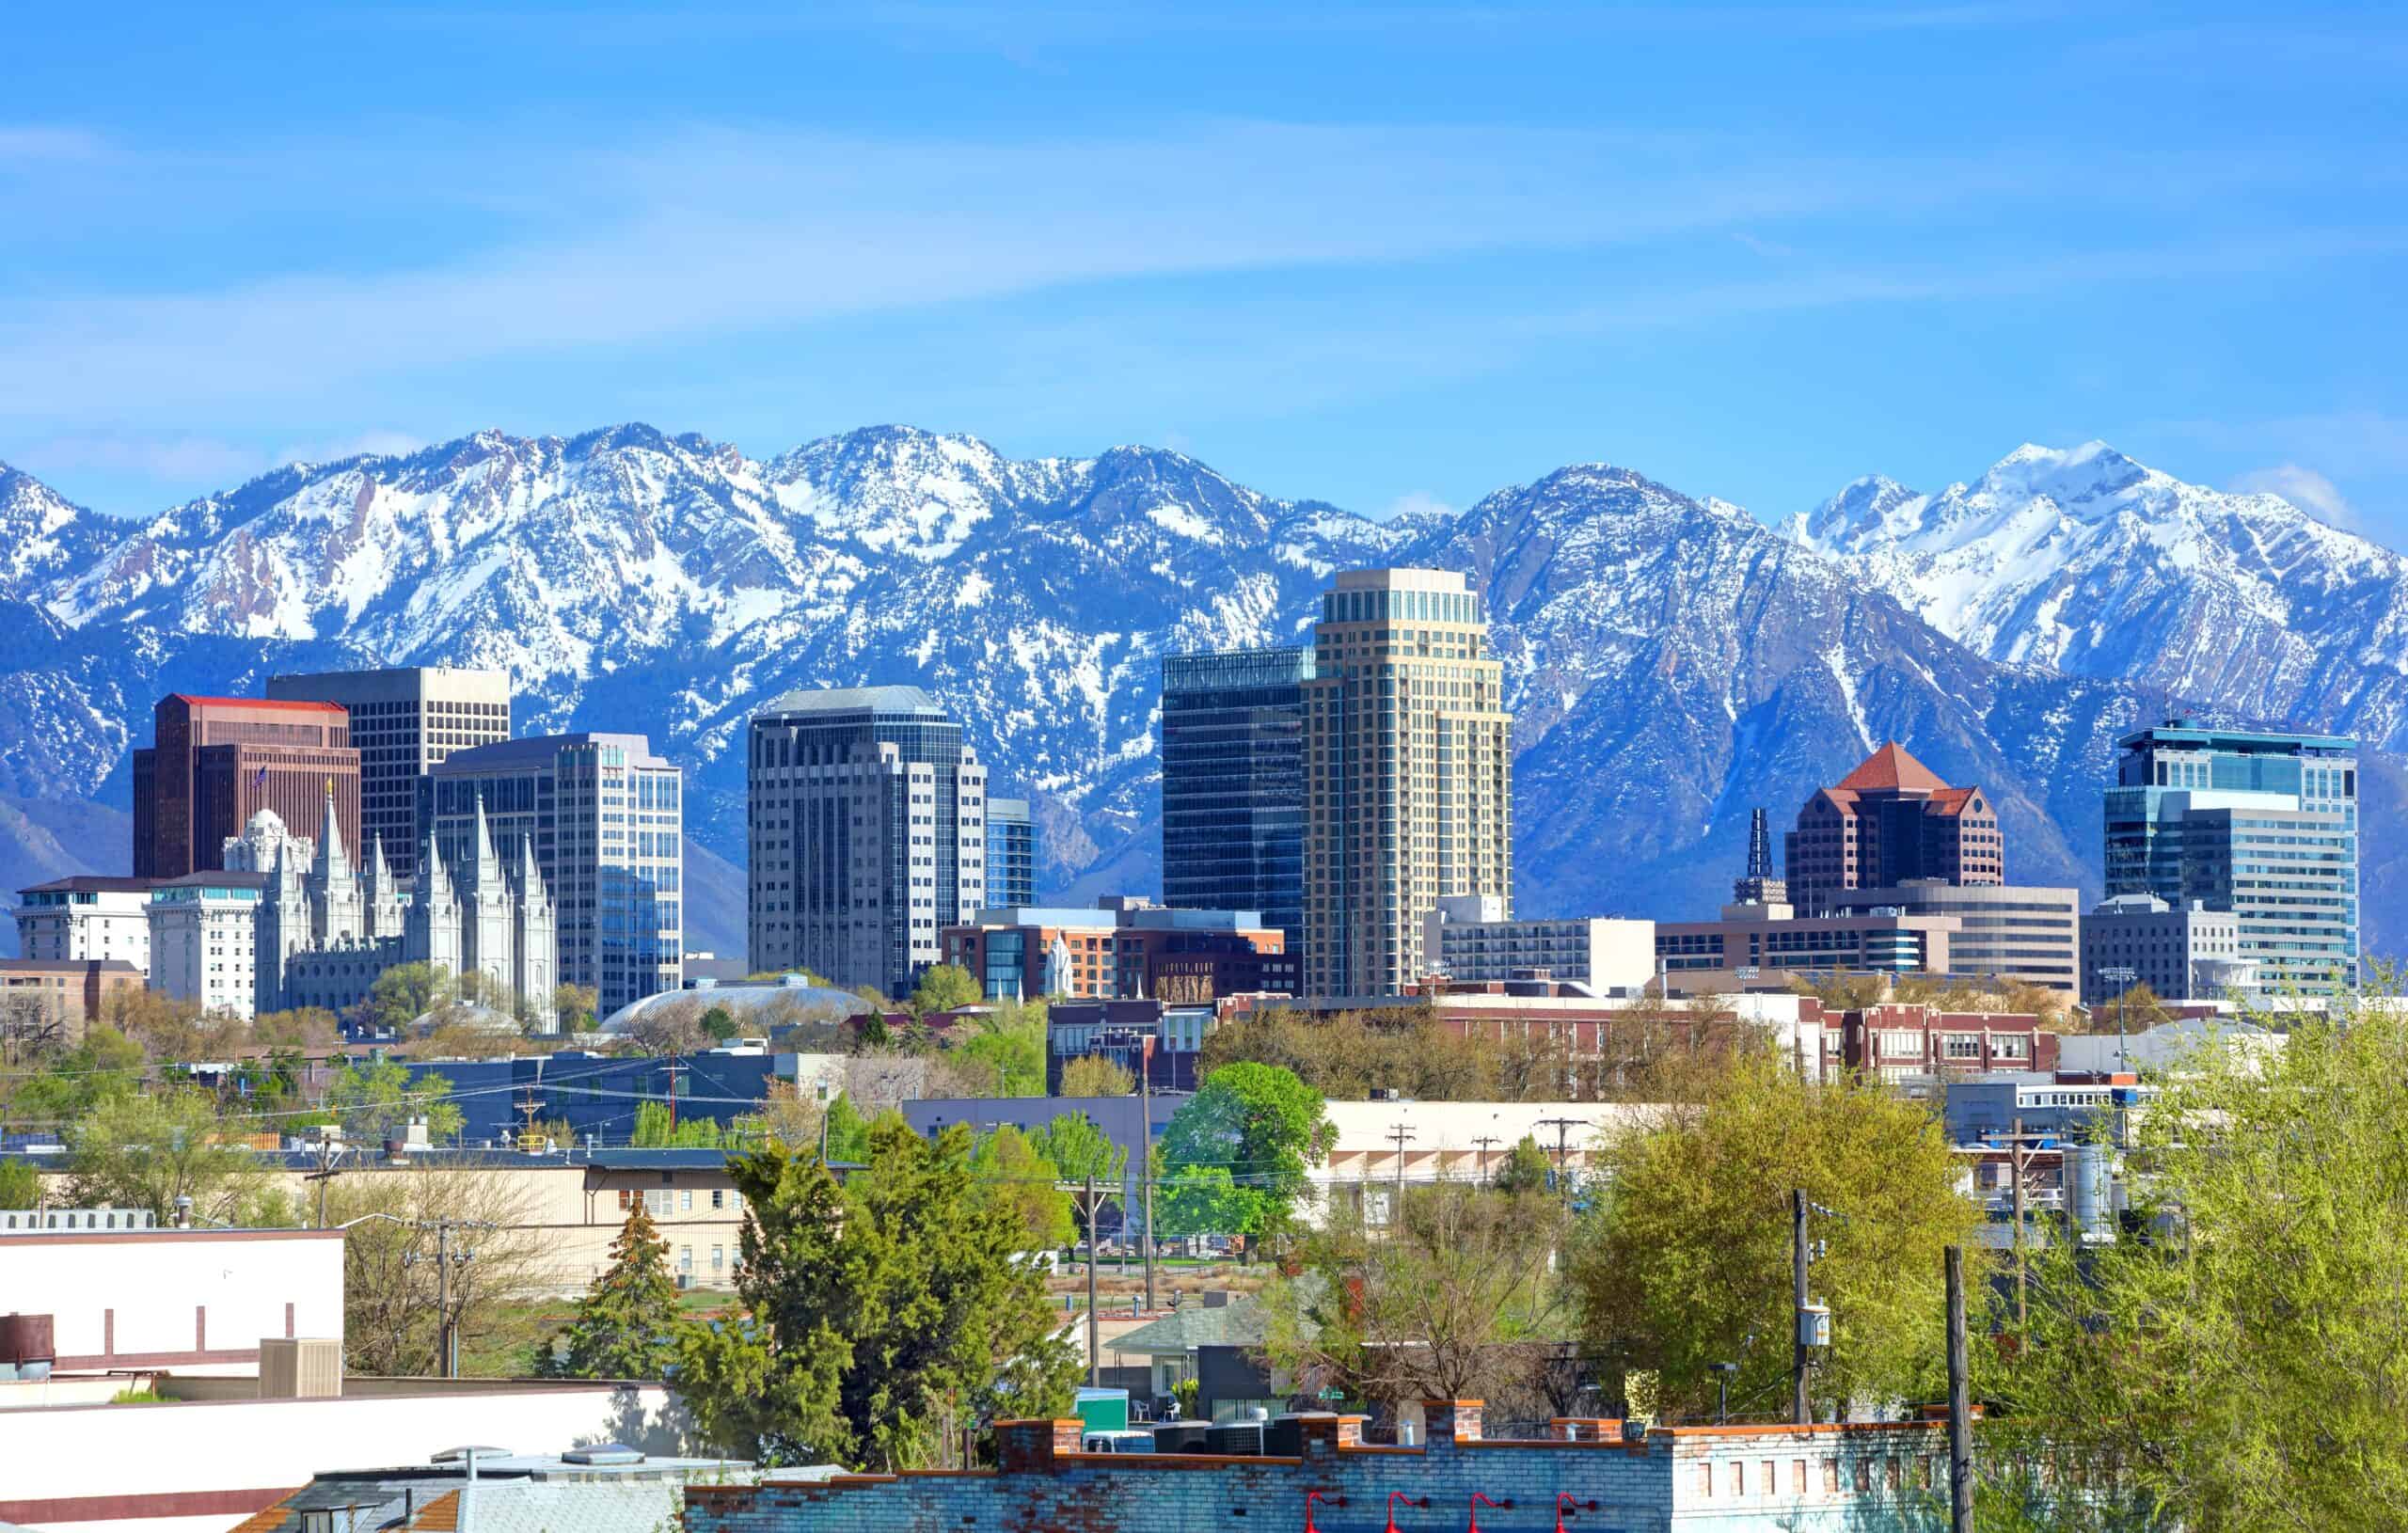
Salt Lake City is the capital and the most populous municipality of the U.S. state of Utah
- Avg. max temp., summer 2019-2023: 87.2°F (+3.2°F warmer than normal)
- Avg. max temp., summer 1901-2000: 84.0°F
- Total population: 1,254,675
18. Lewiston, ID-WA

- Avg. max temp., summer 2019-2023: 83.5°F (+3.2°F warmer than normal)
- Avg. max temp., summer 1901-2000: 80.3°F
- Total population: 64,570
17. Tucson, AZ
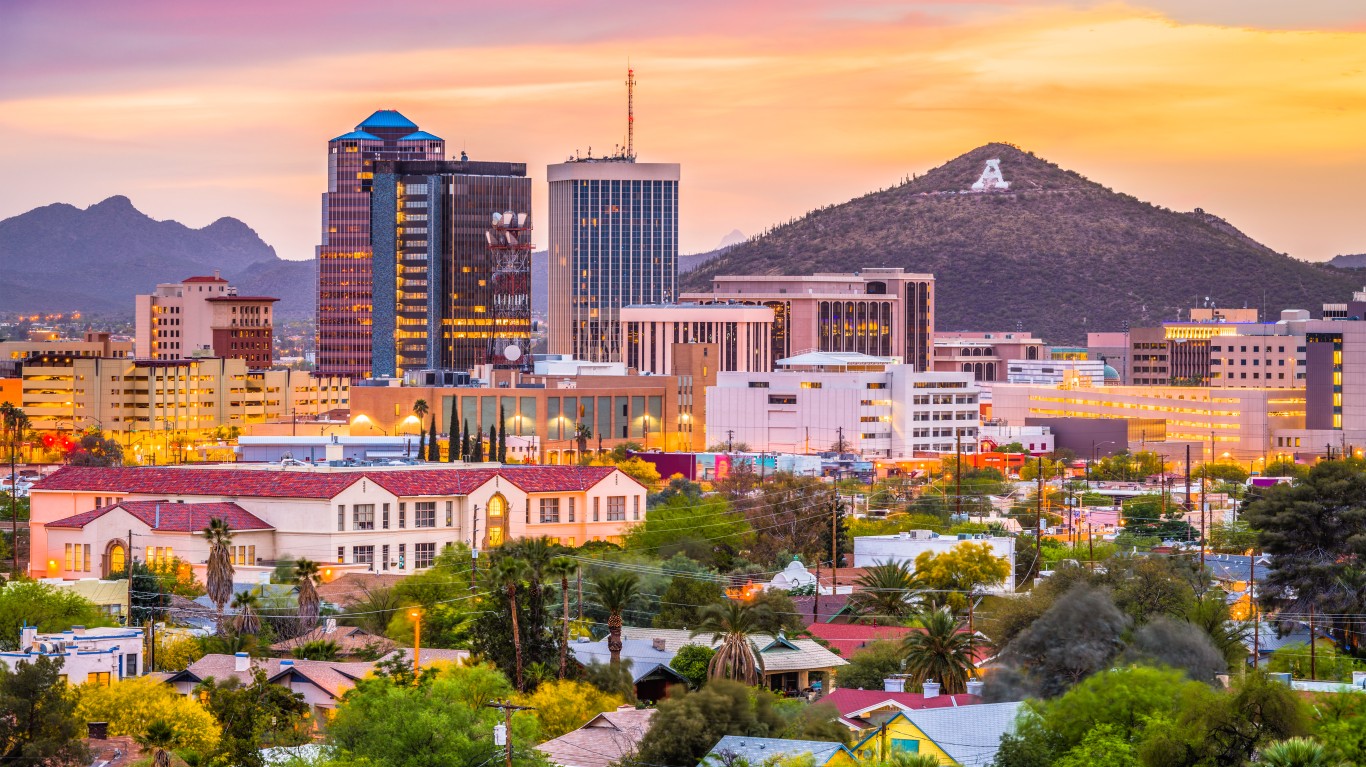
- Avg. max temp., summer 2019-2023: 100.7°F (+3.3°F warmer than normal)
- Avg. max temp., summer 1901-2000: 97.4°F
- Total population: 1,042,393
16. Las Cruces, NM
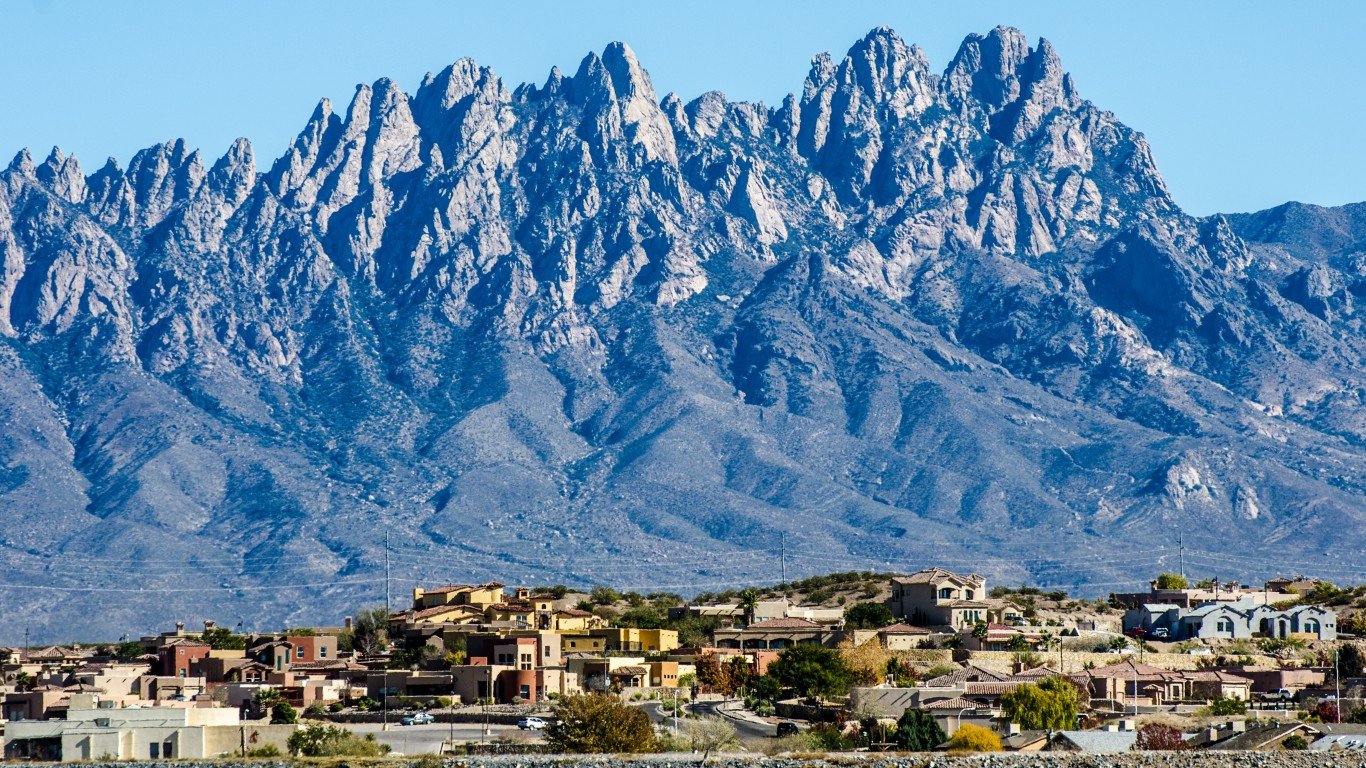
- Avg. max temp., summer 2019-2023: 95.4°F (+3.3°F warmer than normal)
- Avg. max temp., summer 1901-2000: 92.1°F
- Total population: 219,870
15. Albany, OR
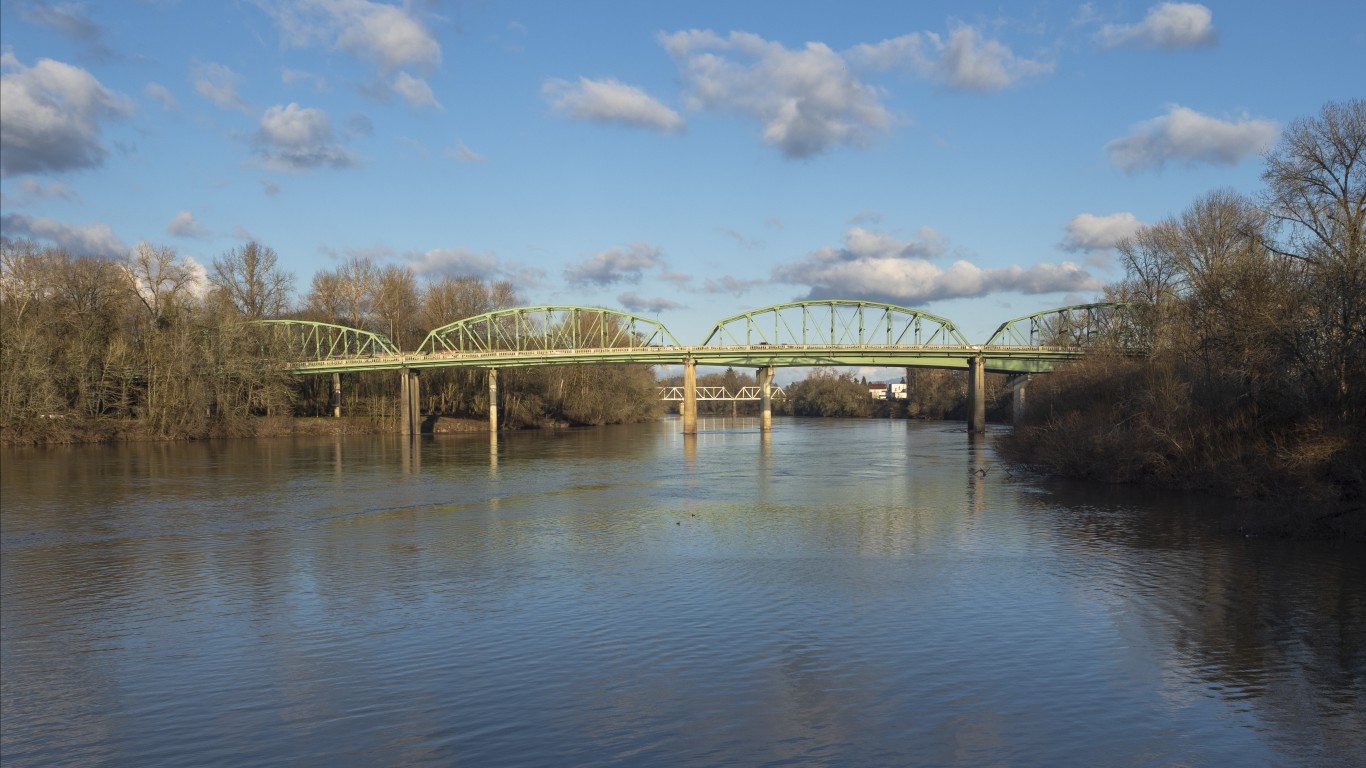
- Avg. max temp., summer 2019-2023: 77.2°F (+3.4°F warmer than normal)
- Avg. max temp., summer 1901-2000: 73.8°F
- Total population: 128,598
14. Farmington, NM
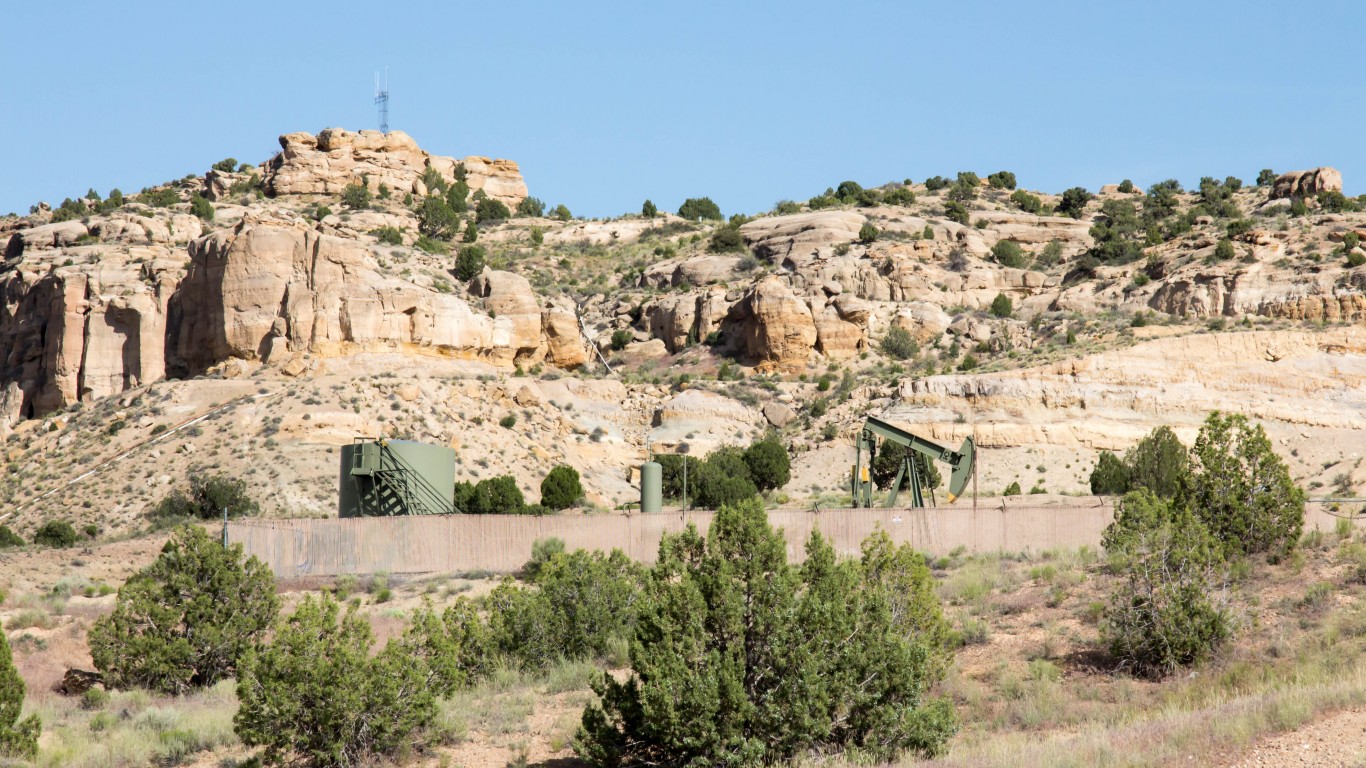
- Avg. max temp., summer 2019-2023: 90.0°F (+3.4°F warmer than normal)
- Avg. max temp., summer 1901-2000: 86.6°F
- Total population: 121,798
13. Prescott Valley-Prescott, AZ

- Avg. max temp., summer 2019-2023: 94.1°F (+3.5°F warmer than normal)
- Avg. max temp., summer 1901-2000: 90.6°F
- Total population: 237,830
12. Ogden, UT
- Avg. max temp., summer 2019-2023: 82.1°F (+3.6°F warmer than normal)
- Avg. max temp., summer 1901-2000: 78.6°F
- Total population: 696,650
11. Cheyenne, WY
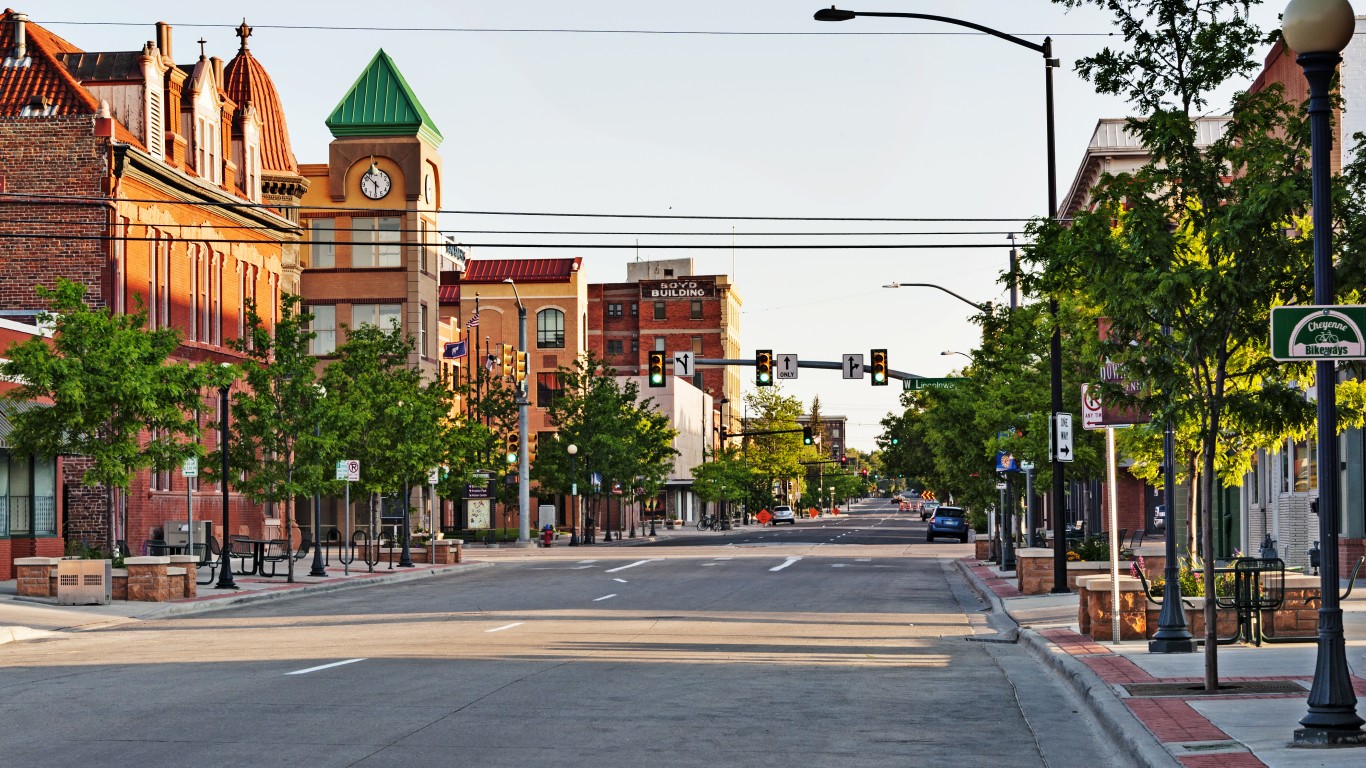
- Avg. max temp., summer 2019-2023: 83.3°F (+3.6°F warmer than normal)
- Avg. max temp., summer 1901-2000: 79.7°F
- Total population: 100,316
10. Stockton-Lodi, CA

- Avg. max temp., summer 2019-2023: 93.6°F (+3.6°F warmer than normal)
- Avg. max temp., summer 1901-2000: 90.0°F
- Total population: 779,445
9. Medford, OR

- Avg. max temp., summer 2019-2023: 82.2°F (+3.6°F warmer than normal)
- Avg. max temp., summer 1901-2000: 78.6°F
- Total population: 222,604
8. Eugene-Springfield, OR

- Avg. max temp., summer 2019-2023: 77.2°F (+3.7°F warmer than normal)
- Avg. max temp., summer 1901-2000: 73.5°F
- Total population: 382,218
7. Yuma, AZ

- Avg. max temp., summer 2019-2023: 106.6°F (+3.8°F warmer than normal)
- Avg. max temp., summer 1901-2000: 102.8°F
- Total population: 204,374
6. Salem, OR
- Avg. max temp., summer 2019-2023: 78.8°F (+4.0°F warmer than normal)
- Avg. max temp., summer 1901-2000: 74.8°F
- Total population: 433,415
5. Bend, OR

- Avg. max temp., summer 2019-2023: 80.7°F (+4.0°F warmer than normal)
- Avg. max temp., summer 1901-2000: 76.6°F
- Total population: 199,352
4. Grand Junction, CO

- Avg. max temp., summer 2019-2023: 84.2°F (+4.0°F warmer than normal)
- Avg. max temp., summer 1901-2000: 80.2°F
- Total population: 156,131
3. Redding, CA

- Avg. max temp., summer 2019-2023: 89.9°F (+4.1°F warmer than normal)
- Avg. max temp., summer 1901-2000: 85.8°F
- Total population: 181,852
2. Corvallis, OR

- Avg. max temp., summer 2019-2023: 81.2°F (+4.5°F warmer than normal)
- Avg. max temp., summer 1901-2000: 76.7°F
- Total population: 95,615
1. Grants Pass, OR

- Avg. max temp., summer 2019-2023: 81.5°F (+4.7°F warmer than normal)
- Avg. max temp., summer 1901-2000: 76.8°F
- Total population: 87,994