Image Source: Gus Andrade / Shutterstock.com

Image Source: Public domain / Wikimedia Commons
Image Source: Public domain / Wikimedia Commons

Image Source: Public domain / Wikimedia Commons

Image Source: Getty Images / Archive Photos via Getty Images

Image Source: Dorothea Lange / Keystone / Getty Images)
Image Source: Gus Andrade / Shutterstock.com
Image Source: David McNew / Hulton Archive via Getty Images
Source: Getty Images / Hulton Archive via Getty Images

Source: Getty Images / Archive Photos via Getty Images
Source: Getty Images / Archive Photos via Getty Images

Source: 2003 Getty Images / Getty Images News via Getty Images
Source: 2003 Getty Images / Getty Images News via Getty Images
Source: 2003 Getty Images / Getty Images News via Getty Images
Source: Getty Images / Getty Images News via Getty Images


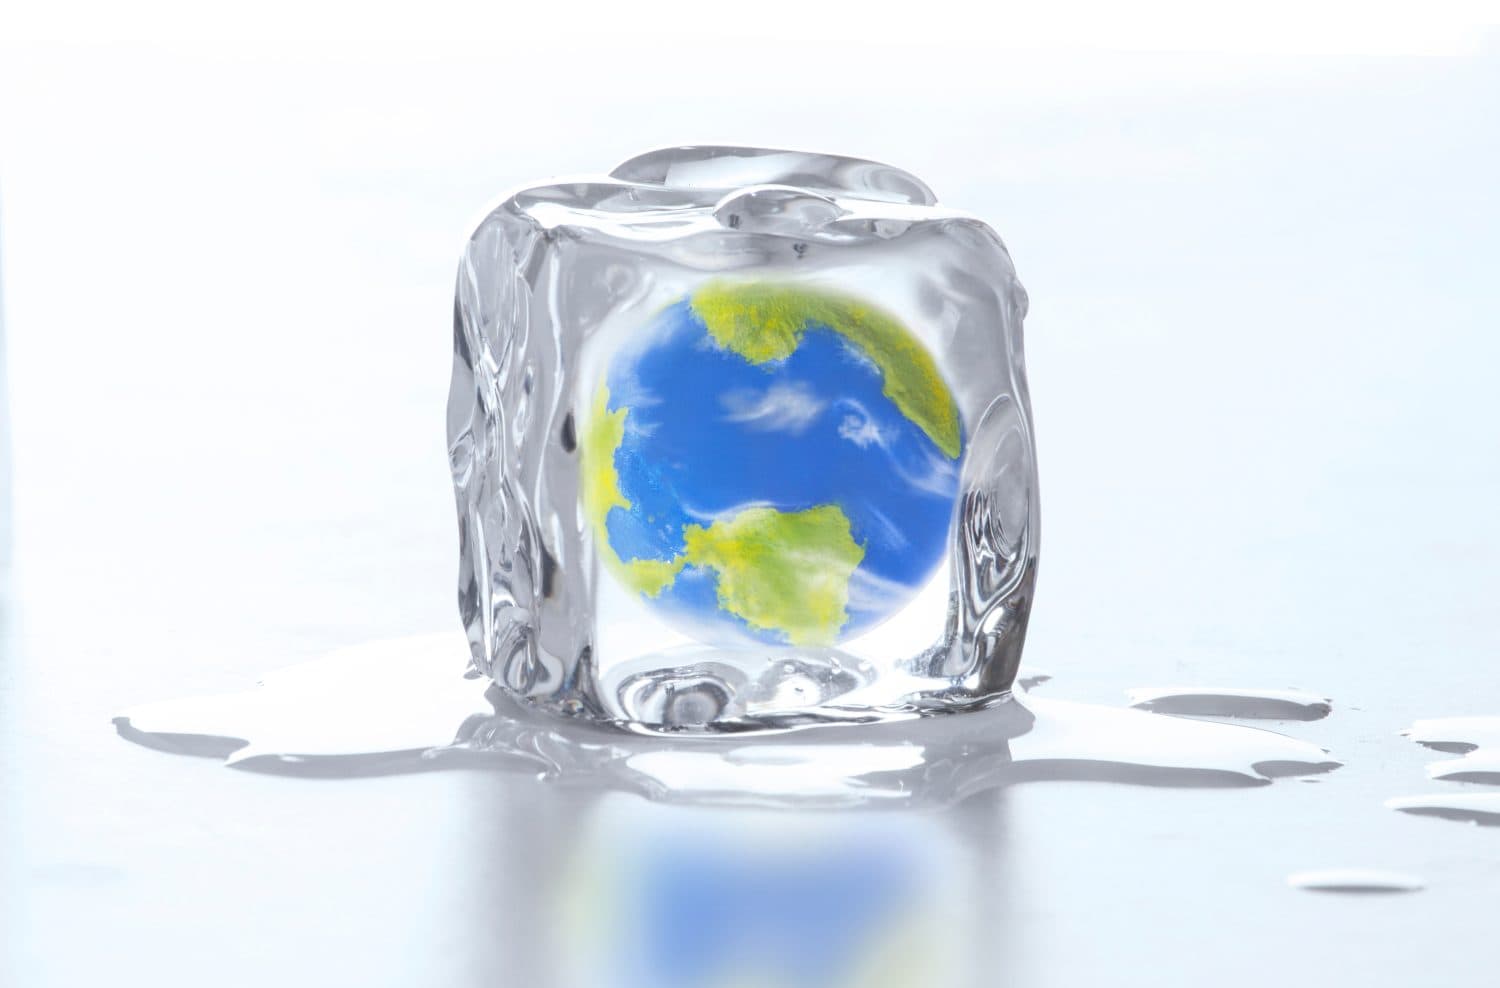
Global warming is a topic that doesn't come up in daily conversations, at least not often. Yet, since 1895, temperature mapping done by scientists has proven to be a valuable tool. Since June has arrived, now is the perfect time to look at the average summer temperature every decade since 1895.
Temperature mapping has allowed us to see the average rate at which land and ocean temperatures increase; this is around 0.11 degrees Fahrenheit every decade. While this number may seem like a slight increase, it still affects and changes habits by melting snow and sea ice, increasing temperature, and more. These changes, even slightly, can change the habitats that plants and animals need to survive.
To create a list of the average temperature every decade since 1895, 24/7 Tempo consulted the National Centers for Environmental Information. On this site, we viewed the data table, which provides the average temperature for the summer months of June to September every year since 1895. From there, we calculated the averages for every decade.
While the increase from the average temperature in the 1890s to the 2020s may seem slight, it is important to note that the temperature has risen over 2 degrees. The Climate Science Special Report from 2017 concluded that if this trend continues with carbon dioxide and greenhouse gases emitting into the air at a fast rate, the increase may reach 5 degrees by the end of this decade. (Read our list of popular travel destinations that may be gone in a decade.)
1895-1899
- Average Summer Temperature: 82.67 degrees Fahrenheit
Temperature mapping dates back to the year 1895. We took the average yearly temperature between June and September to find each decade's average. However, since the data did not begin collecting until 1895, we used the last half of the 1890s.
The highest summer in the 1890 decade was 1898, with a maximum average temperature of 83.07 degrees Fahrenheit.
1900-1909
- Average Summer Temperature: 81.97 degrees Fahrenheit
Between 1900 and 1909, the summer months averaged 81.97 degrees Fahrenheit. This was slightly cooler than the last half of the previous decade.
The highest average temperature of this decade occurred in the summer of 1901. Between June and September, the average temperature was 83.27 degrees Fahrenheit that year.
1910-1919
- Average Summer Temperature: 82.31 degrees Fahrenheit
1910 to 1919 saw a range of higher and lower temperatures. The highest average temperature was in 1919 at 83.47 degrees Fahrenheit. The lowest average temperature occurred in 1915 at 80.33 degrees Fahrenheit.
1920-1929
- Average Summer Temperature: 82.52 degrees Fahrenheit
The average summer temperature only moved slightly in the following decade. However, a new record of an average of 84.23 degrees Fahrenheit was seen in the summer of 1922.
1930-1939
- Average Summer Temperature: 84.37 degrees Fahrenheit
The following decade, 1930 to 1939, also saw a new average record of 85.73 degrees Fahrenheit in the summer of 1936.
Additionally, this decade had hotter summer months, bringing the average temperatures to between 83 and 85 degrees Fahrenheit. These higher-than-average temperatures meant a new average of 84.37 degrees Fahrenheit, up almost 2 degrees from the previous decade.
1940-1949
- Average Summer Temperature: 82.79 degrees Fahrenheit
Between the years 1940 to 1949, the summer months saw cooler temperatures than the previous decade. The lowest year was 1945, with an average summer temperature of 81.86 degrees Fahrenheit. With the lower temperatures, the average summer temperature decreased to 82.79 degrees Fahrenheit.
1950-1959
- Average Summer Temperature: 83.17 degrees Fahrenheit
The summer of 1950 was a little cooler, with the lowest temperature average at 80.94 degrees Fahrenheit. However, the following years averaged between 82 and 83 degrees Fahrenheit, bringing the average for the 1950s decade up slightly.
1960-1969
- Average Summer Temperature: 82.27 degrees Fahrenheit
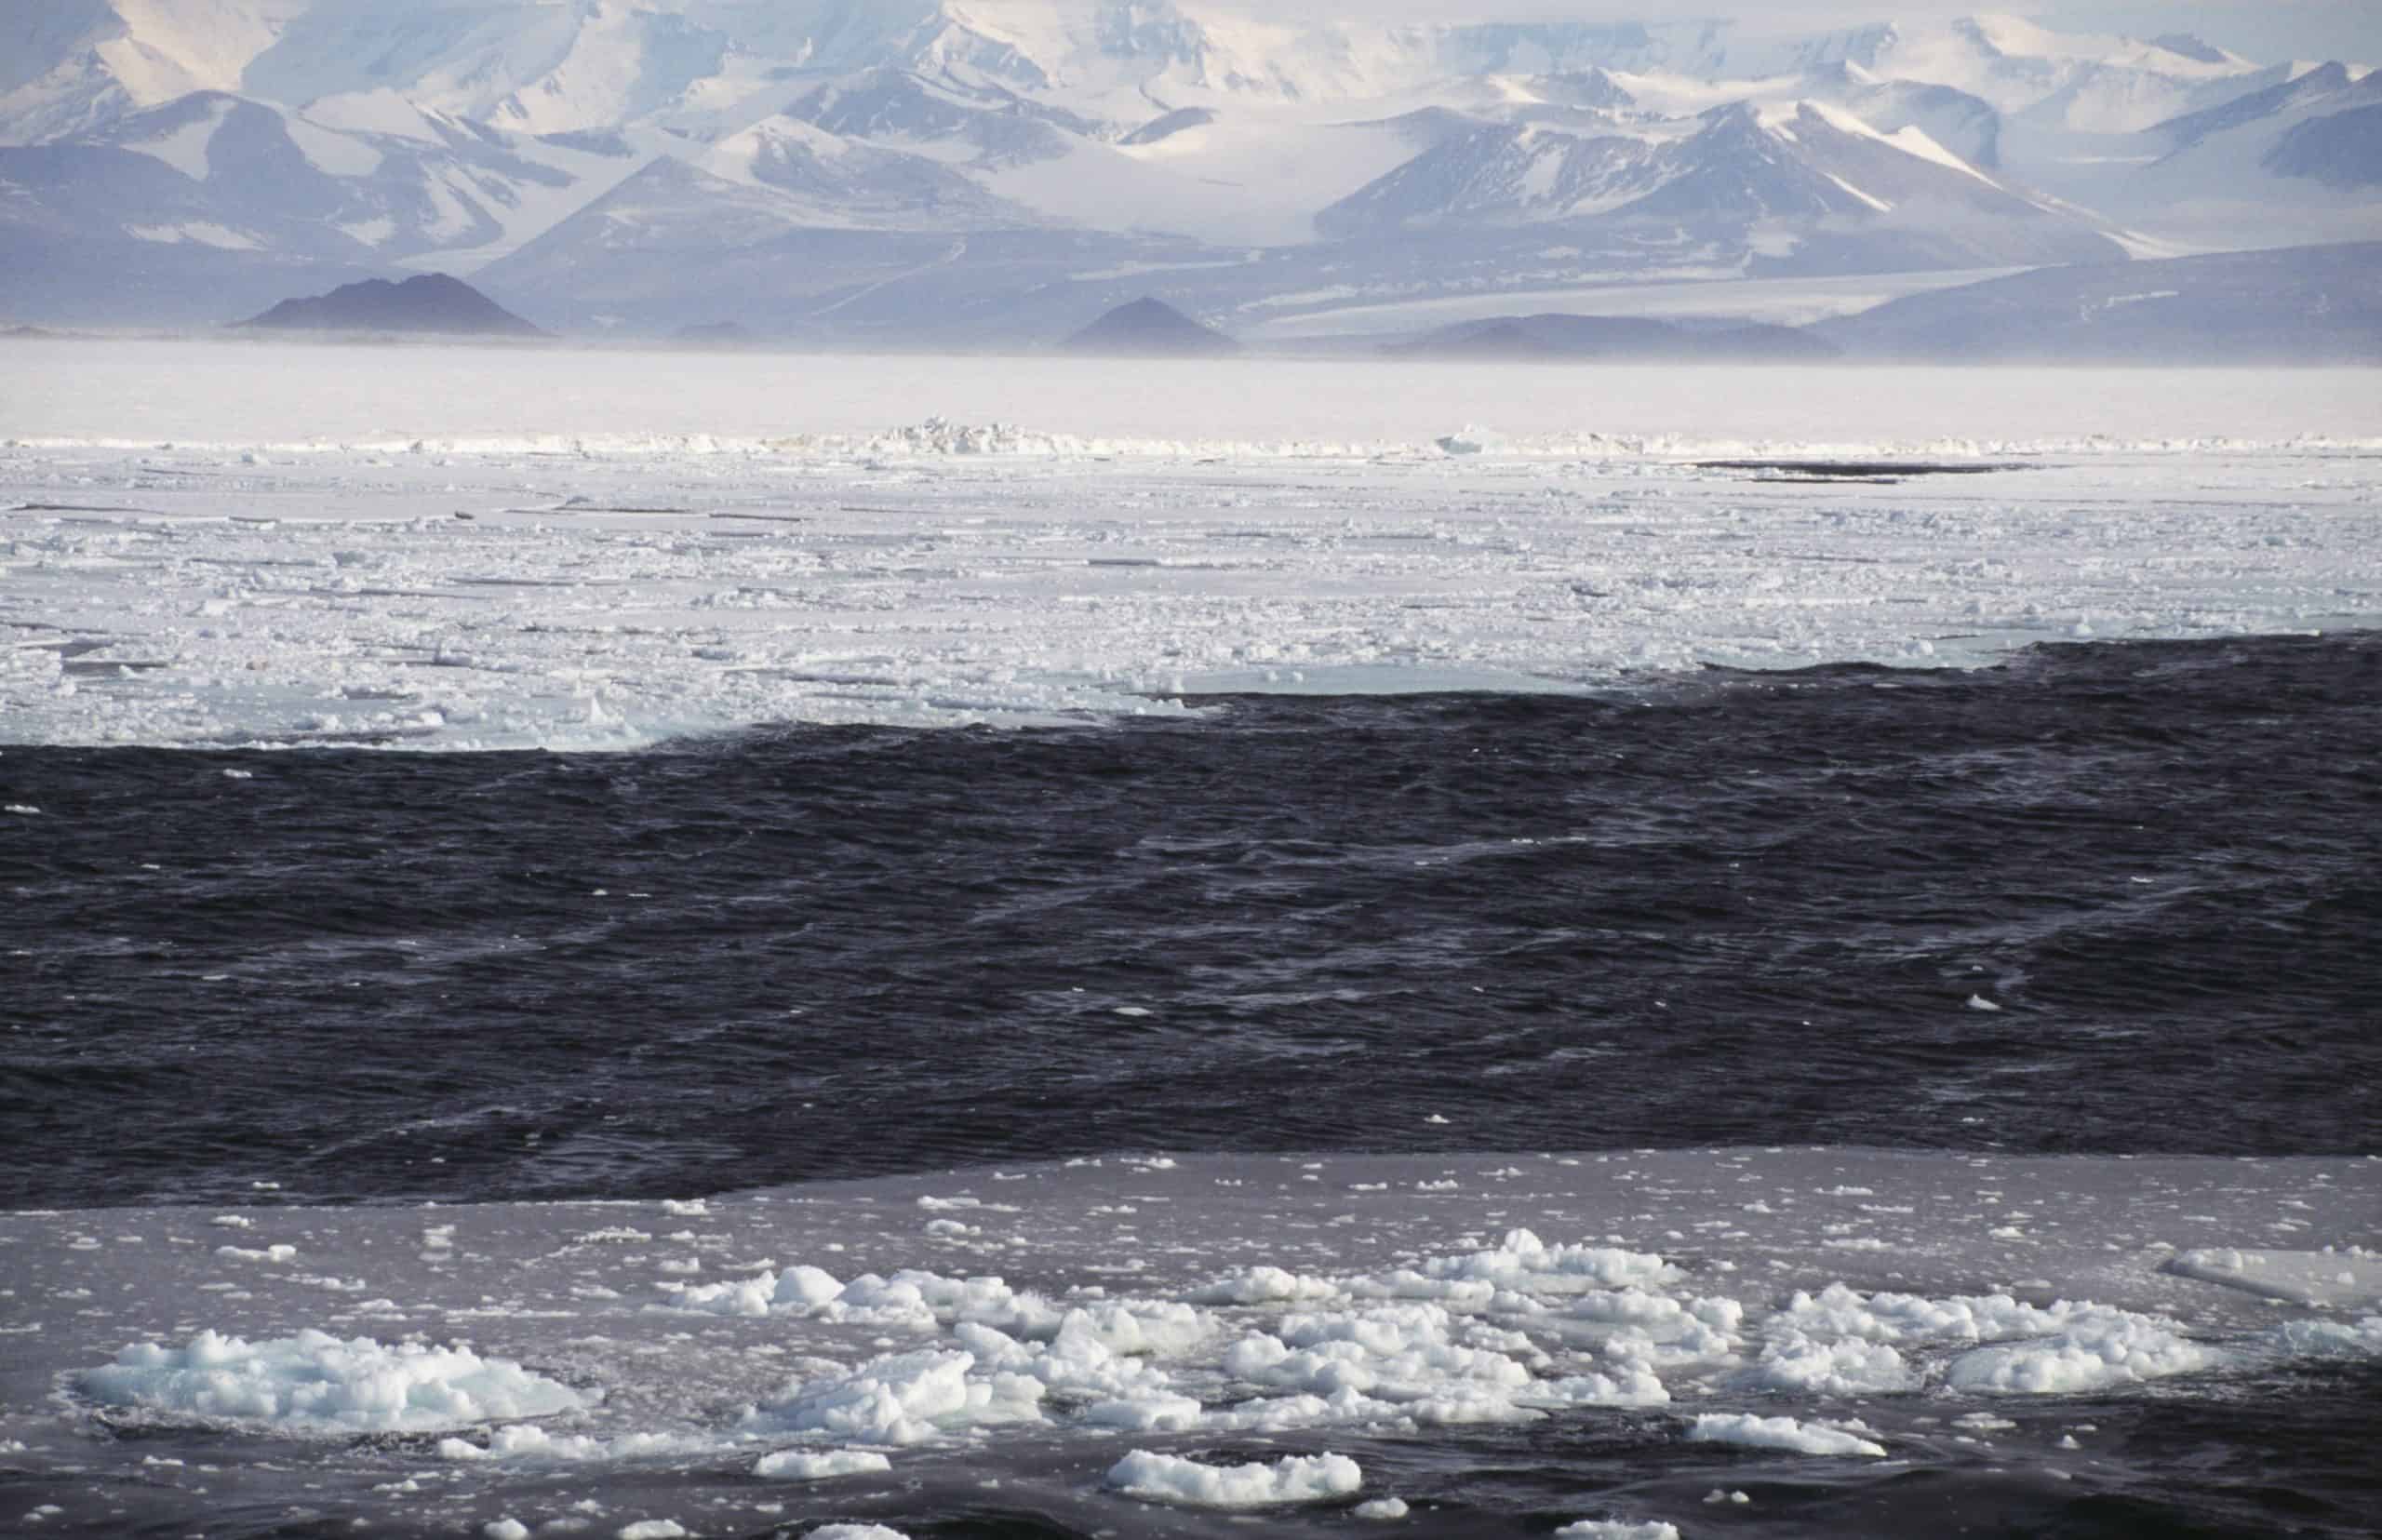
In the late 1960s, the first studies began to suggest the collapse of ice sheets in Antarctica.
Still fluctuating between 82 and 83 degrees Fahrenheit on average, the decade of the '60s saw a range of average temperatures. The lowest average occurred in the summer of 1965, with an average temperature of 80.37 degrees Fahrenheit. The highest average occurred in 1960, with an average temperature of 83.72 degrees Fahrenheit.
1970-1979
- Average Summer Temperature: 82.38 degrees Fahrenheit
Earth Day is introduced on April 22, 1970. Here, a banner is seen at the inaugural celebration in New York City.
The average temperatures through the '70s stayed between 81.48 and 83.19 degrees Fahrenheit.
1980-1989
- Average Summer Temperature: 82.69 degrees Fahrenheit
British Prime Minster Margaret Thatcher in 1988 became the first world leader to call for action on greenhouse gas emissions as the term
In the 1980s, the average temperature ticked up slightly, with the highest occurring in 1988 at 84.40 degrees Fahrenheit. However, the average summer temperature throughout this decade stayed relatively the same.
1990-1999
- Average Summer Temperature: 82.58 degrees Fahrenheit
Toyota introduced the environmentally-friendly Prius, the first mass-market electric hybrid car, in 1997. In the years since, more automakers have began making electric and hybrid vehicles to meet consumer demand.
Through the 1990s, the lowest average temperature happened in 1992 at 80.64 degrees Fahrenheit. The highest was in 1994 at 84.30 degrees Fahrenheit.
2000-2009
- Average Summer Temperature: 83.50 degrees Fahrenheit
In the 2000s, the average summer temperature was higher in the 84 degrees Fahrenheit range than in the previous decade. These averages brought the decade average up almost a degree at 83.50 degrees Fahrenheit.
2010-2019
- Average Summer Temperature: 84.06 degrees Fahrenheit
U.S. Secretary of State John Kerry speaks at the United Nations Signing Ceremony for the Paris Agreement climate change accord that came out of negotiations at the COP21 climate summit in Paris on April 22, 2016, in New York City. At least 155 countries were expected to sign the agreement with the goal of limiting warming to
In the 2010s, the summer average saw another tick upward, at 84.06 degrees Fahrenheit. The highest average temperature occurred in 2012, with 85.37 degrees Fahrenheit.
2020-2023
- Average Summer Temperature: 84.82 degrees Fahrenheit
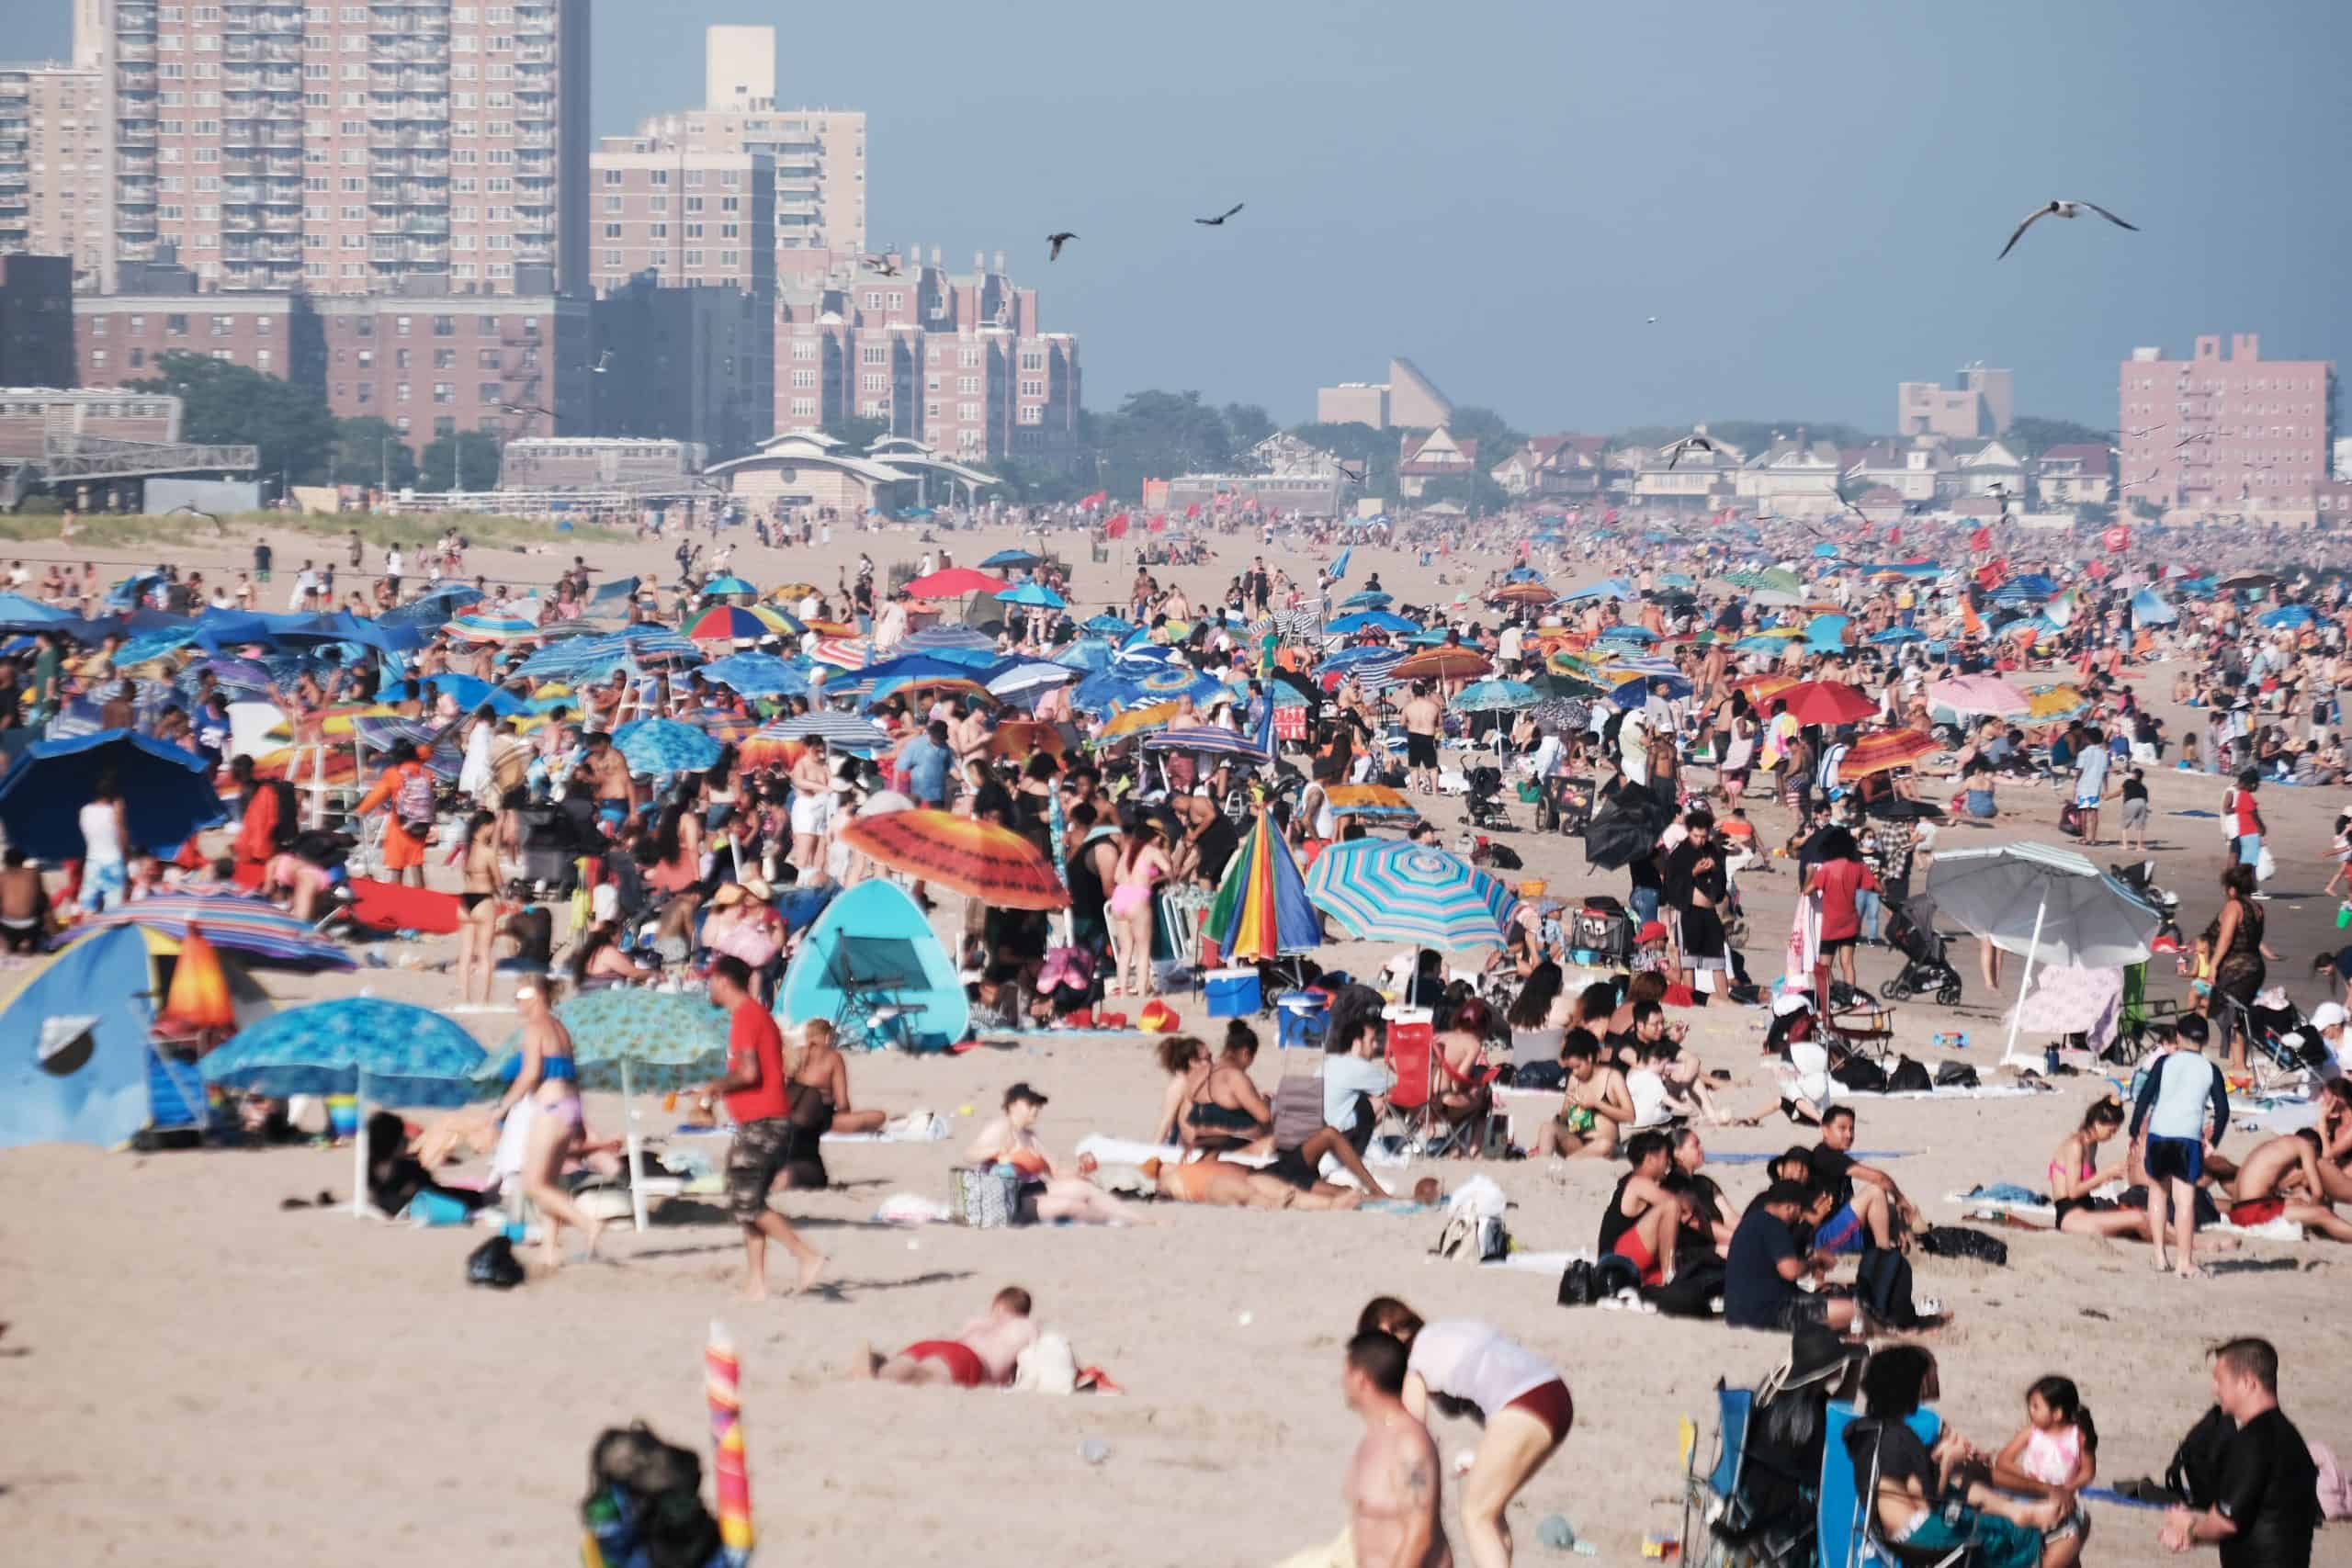
People cool off on the beach in Coney Island on July 6, 2023, in the Brooklyn borough of New York City. As global warming continues to raise temperatures around the world, heat records are being broken at an unprecedented rate.
The past three years have seen warmer summer months. In the summer of 2020, the average temperature was 84.51 degrees Fahrenheit; in 2021, 85.14 degrees Fahrenheit; in 2022, 85.27 degrees Fahrenheit; and in 2023, it was 84.37 degrees Fahrenheit. While the upward tick in average degrees may seem slight, as the Earth warms up, it can have numerous effects on the habitat. (Here's a look at 20 beloved foods that could disappear because of climate change.)