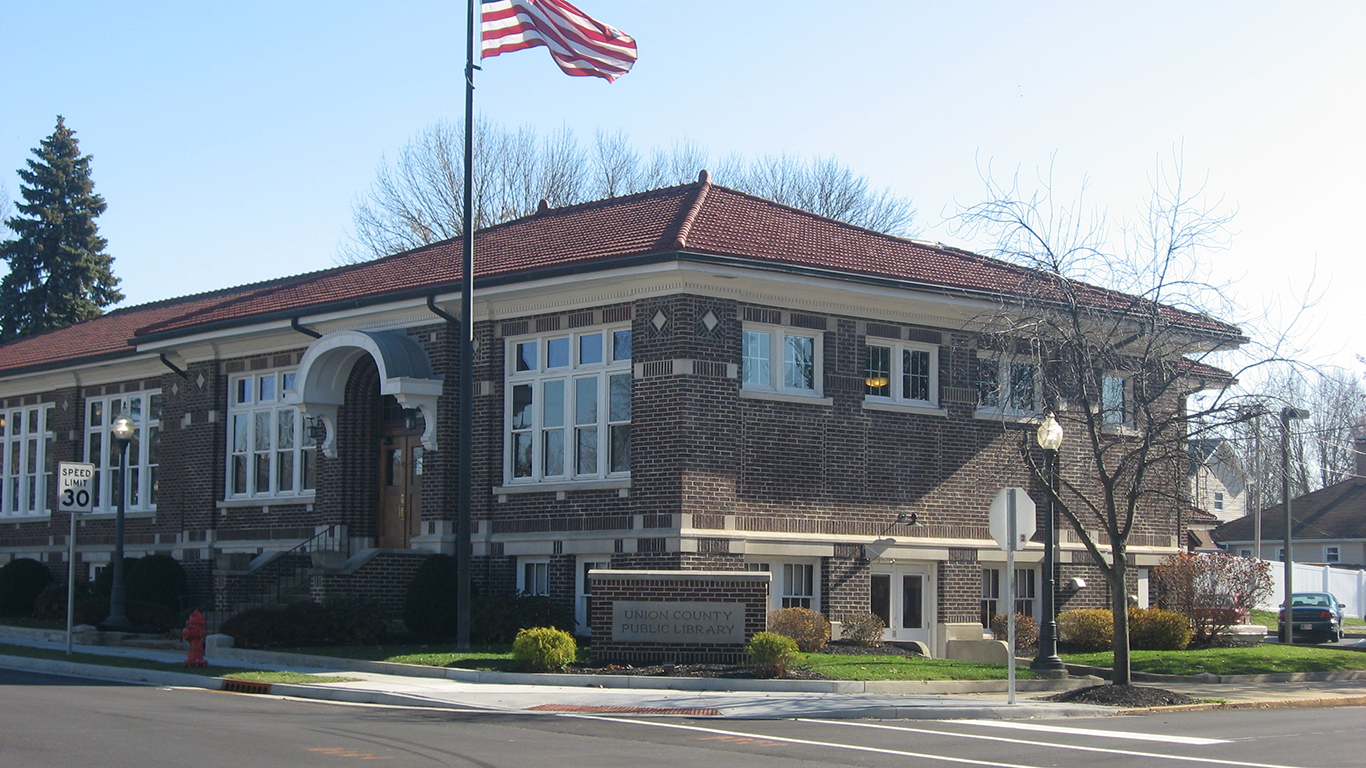
The two most common leisure time, cultural activities in America are going to the library and going to the movies. On average, American adults visit a library 10.5 times a year, nearly twice as often as their 5.3 trips to the movies. At an average ticket price of over $9 a ticket, those trips to the movies cost about $50 annually, while visiting a library is free. Maybe the price difference has something to do with it?
According to the latest report from Gallup on how Americans spend their leisure time, the cost is a factor. Among families with a household income of $100,000 or more, adults visit the library an average of 8.5 times a year and go to a movie 6.3 times. Among families with incomes of less than $40,000, adults visit the library an average of 12.2 times and go to the movies just 4.4 times a year.
High-income adults are also more than twice as likely to go to a live sporting event (7.5 times a year) compared to lower-income adults, who attend 3.6 sporting events a year. As of Thursday, the average price of a ticket to Super Bowl LIV on the secondary market is $8,904, steep even for high earners. (The NFL does not publish the face value of tickets to the big game.) The average cost of a ticket for an NBA regular-season game is now $89 on the secondary market. On average, an American adult goes to 4.7 live sports events a year, making it the third most popular leisure activity.
The Gallup survey gathered data on nine activities. In addition to libraries, movies and sports events, Americans attend an average of 3.8 live musical or theatrical events, make 3.7 visits to U.S. national parks, visit gambling casinos 2.5 times a year, go to a museum 2.5 times, visit an amusement park 1.5 times and go to the zoo 0.9 times a year. Each of these activities has a cost associated with it, while a library is still free.
Women visit a library nearly twice as often as men do, 13.4 trips a year compared to 7.5. By race, white Americans make 10.6 visits a year, compared to 10.4 for non-whites. College graduates go to a library an average of 14.4 times a year, compared to an average of 6.6 times for those who have a high school diploma or less.
Democrats make 15.0 trips to the library every year, compared to 7.2 visits by Republicans and 9.6 visits by independents. Conservatives visit a library 7.0 times a year, while liberals make more than twice as many visits, 14.3. Moderates take 12.1 trips to a library annually.
In its report on the survey, Gallup comments: “Despite the proliferation of digital-based activities over the past two decades — including digital books, podcasts, streaming entertainment services and advanced gaming — libraries have endured as a place Americans visit nearly monthly on average. Whether because they offer services like free Wi-Fi, movie rentals, or activities for children, libraries are most utilized by young adults, women and residents of low-income households.”
One final data point. In a similar Gallup survey completed in December 2001, American adults took 1.3 more trips to the movies than they did in December 2019. The 2007 introduction of Netflix’s video streaming service probably had a lot to do with the decline in movie attendance. An average movie ticket cost just under $7 in 2007. Last year, according to Leichtman Research Group, 74% of U.S. households subscribed to at least one streaming video service.
Moviegoers in the U.S. and Canada bought 1.3 billion movie tickets in 2018, according to the National Association of Theatre Owners. While this is higher than in 2017, it is still well below 2002, which was Hollywood’s best year: Here’s how much it cost to go to a movie in the year you were born.
