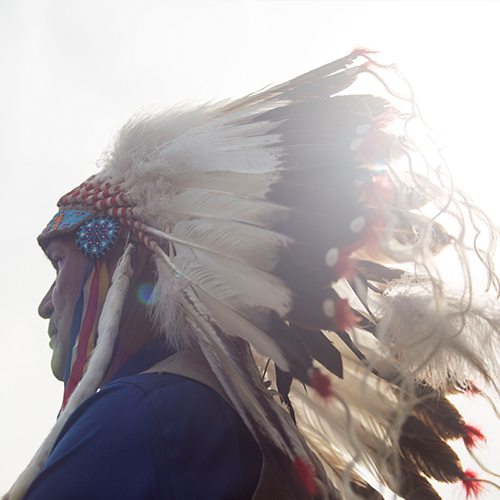
Prior to European contact in 1492, anywhere between 7 and 18 million people were living north of the Rio Grande on the continent that would come to be known as North America. As European invaders brought disease, war, displacement, and slavery to the new world, it is estimated that 90% of the indigenous population was killed by the turn of the 17th century.
The Native American population of the United States declined to its lowest point around 1900, when approximately 237,000 indigenous people were estimated to be living in the country. The Native population of the United States has been slowly recovering since then.
According to the U.S. Census Bureau, there are now about 6.79 million Native Americans living in the U.S. – about 2.9% of the U.S. population – and 574 federally recognized tribes. Here are the number of Native Americans in every state.
24/7 Tempo has reviewed the largest Native American population in each state by tribe, using data from the U.S. Census Bureau’s American Community Survey. Native Hawaiians are not represented in the data, and certain tribes including the Penobscot and Wampanoag were not counted separately in the Census.
People who identify as Cherokee are the largest native population in 22 states, according to the Census Bureau’s data.
The population of Alaska includes 15% of residents who identify as Native American or Alaskan Native – the highest percentage of all the states – with over 34,000 Yup’ik and over 23,000 Inupiat residents.
By sheer numbers, Arizona has the largest population of Native Americans – an estimated 317,414 people – with over 152,000 Navajo and over 29,000 Apache residents. Meanwhile, California is a close second, with 303,998 people identifying as Native American. Read about how California and every other state got its name.
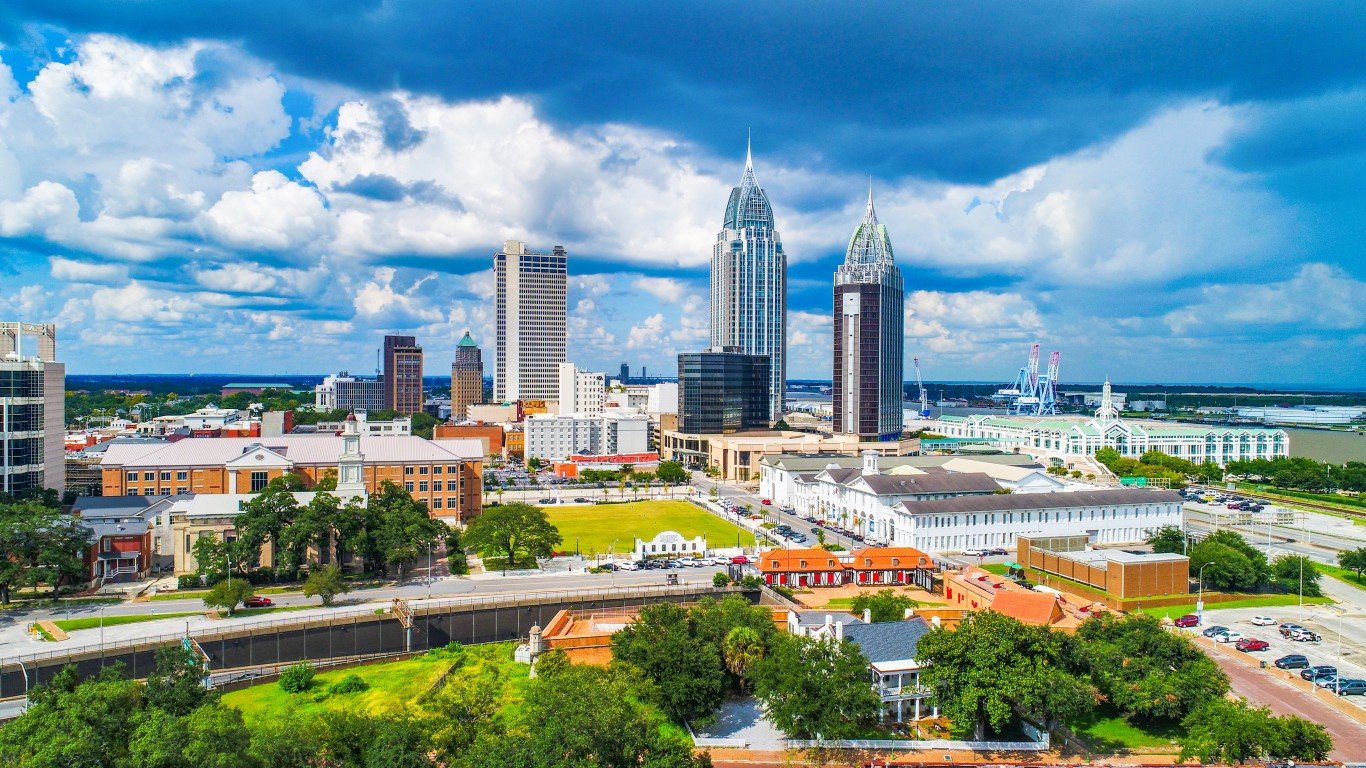
Alabama
> Largest native population: Cherokee (pop: 9,035)
> Second largest native population: Creek (pop: 3,952)
> State residents who self-identify as American Indian: 0.52% – 25th highest (total: 25,565)
> Median household income: Native: $50,114; State: $51,734
> Poverty rate: Native: 16.9%; State: 15.5%
> State population: 4,903,185 – 24th highest
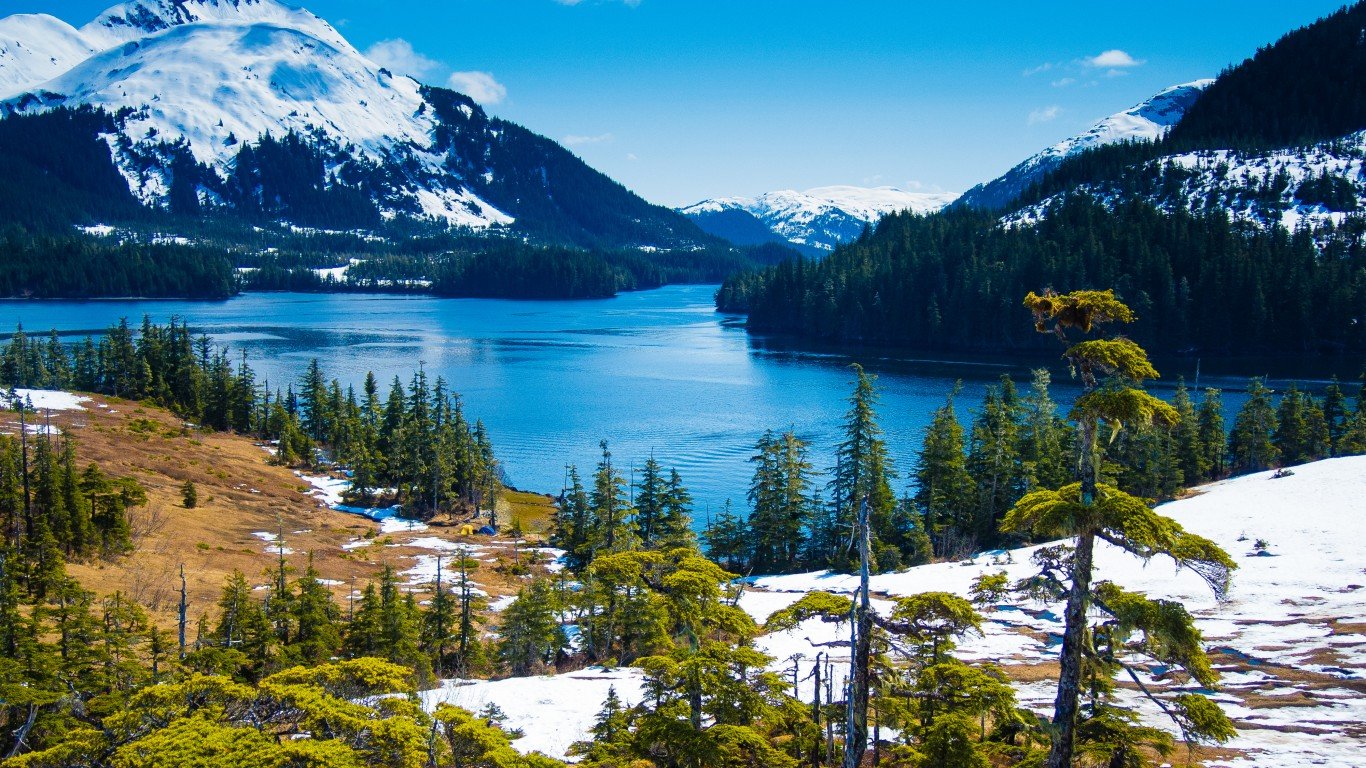
Alaska
> Largest native population: Yup’ik (pop: 34,675)
> Second largest native population: Inupiat (pop: 23,566)
> State residents who self-identify as American Indian: 15.00% – 7th highest (total: 109,751)
> Median household income: Native: $49,959; State: $75,463
> Poverty rate: Native: 24.0%; State: 10.1%
> State population: 731,545 – 3rd lowest
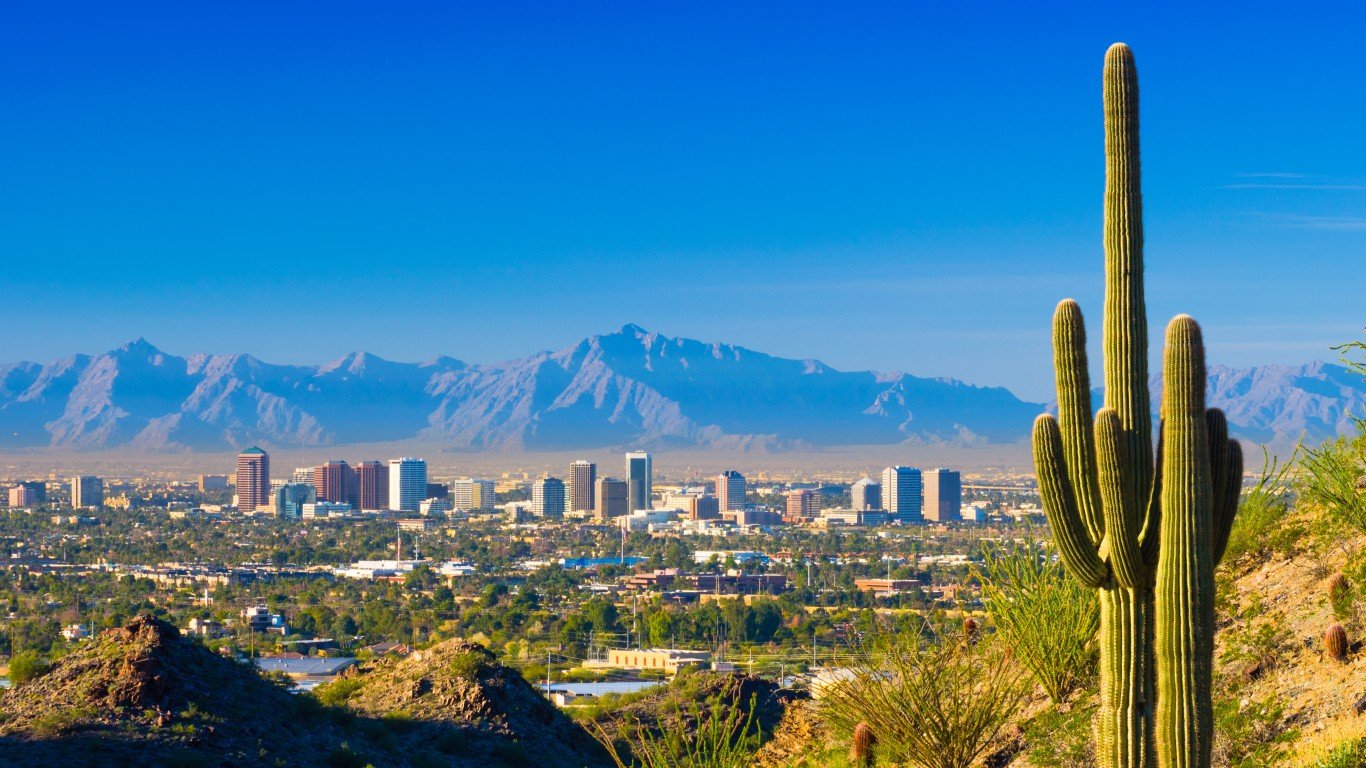
Arizona
> Largest native population: Navajo (pop: 152,261)
> Second largest native population: Apache (pop: 29,581)
> State residents who self-identify as American Indian: 4.36% – the highest (total: 317,414)
> Median household income: Native: $37,974; State: $62,055
> Poverty rate: Native: 32.9%; State: 13.5%
> State population: 7,278,717 – 14th highest
Arkansas
> Largest native population: Cherokee (pop: 8,449)
> Second largest native population: Choctaw (pop: 3,387)
> State residents who self-identify as American Indian: 0.68% – 20th lowest (total: 20,434)
> Median household income: Native: $40,625; State: $48,952
> Poverty rate: Native: 22.6%; State: 16.2%
> State population: 3,017,804 – 18th lowest
California
> Largest native population: Mexican American Indian (pop: 50,853)
> Second largest native population: Cherokee (pop: 18,526)
> State residents who self-identify as American Indian: 0.77% – 2nd highest (total: 303,998)
> Median household income: Native: $55,362; State: $80,440
> Poverty rate: Native: 19.5%; State: 11.8%
> State population: 39,512,223 – the highest
Colorado
> Largest native population: Navajo (pop: 8,320)
> Second largest native population: Cherokee (pop: 4,348)
> State residents who self-identify as American Indian: 0.95% – 14th highest (total: 54,847)
> Median household income: Native: $47,097; State: $77,127
> Poverty rate: Native: 19.5%; State: 9.3%
> State population: 5,758,736 – 21st highest
Connecticut
> Largest native population: South American Indian (pop: 783)
> Second largest native population: Cherokee (pop: 683)
> State residents who self-identify as American Indian: 0.28% – 9th lowest (total: 9,955)
> Median household income: Native: $43,350; State: $78,833
> Poverty rate: Native: 17.0%; State: 10.0%
> State population: 3,565,287 – 22nd lowest
Delaware
> Largest native population: Cherokee (pop: 688)
> Second largest native population: South American Indian (pop: 273)
> State residents who self-identify as American Indian: 0.38% – 5th lowest (total: 3,729)
> Median household income: Native: $51,891; State: $70,176
> Poverty rate: Native: 18.5%; State: 11.3%
> State population: 973,764 – 6th lowest
Florida
> Largest native population: Cherokee (pop: 8,824)
> Second largest native population: Mexican American Indian (pop: 5,356)
> State residents who self-identify as American Indian: 0.28% – 12th highest (total: 59,320)
> Median household income: Native: $48,608; State: $59,227
> Poverty rate: Native: 16.6%; State: 12.7%
> State population: 21,477,737 – 3rd highest
Georgia
> Largest native population: Mexican American Indian (pop: 11,345)
> Second largest native population: Cherokee (pop: 6,712)
> State residents who self-identify as American Indian: 0.35% – 20th highest (total: 37,440)
> Median household income: Native: $38,720; State: $61,980
> Poverty rate: Native: 24.7%; State: 13.3%
> State population: 10,617,423 – 8th highest
Hawaii
> Largest native population: Cherokee (pop: 680)
> Second largest native population: Mexican American Indian (pop: 493)
> State residents who self-identify as American Indian: 0.26% – 4th lowest (total: 3,710)
> Median household income: Native: $49,208; State: $83,102
> Poverty rate: Native: 22.9%; State: 9.3%
> State population: 1,415,872 – 11th lowest
Idaho
> Largest native population: Navajo (pop: 1,111)
> Second largest native population: Cherokee (pop: 1,041)
> State residents who self-identify as American Indian: 1.29% – 22nd lowest (total: 23,136)
> Median household income: Native: $39,697; State: $60,999
> Poverty rate: Native: 24.9%; State: 11.2%
> State population: 1,787,065 – 12th lowest
Illinois
> Largest native population: Mexican American Indian (pop: 5,820)
> Second largest native population: Cherokee (pop: 3,189)
> State residents who self-identify as American Indian: 0.26% – 22nd highest (total: 33,460)
> Median household income: Native: $49,634; State: $69,187
> Poverty rate: Native: 16.4%; State: 11.5%
> State population: 12,671,821 – 6th highest
Indiana
> Largest native population: Cherokee (pop: 3,310)
> Second largest native population: Mexican American Indian (pop: 933)
> State residents who self-identify as American Indian: 0.23% – 14th lowest (total: 15,782)
> Median household income: Native: $48,360; State: $57,603
> Poverty rate: Native: 17.0%; State: 11.9%
> State population: 6,732,219 – 17th highest
Iowa
> Largest native population: Sioux (pop: 1,658)
> Second largest native population: Cherokee (pop: 698)
> State residents who self-identify as American Indian: 0.38% – 10th lowest (total: 11,976)
> Median household income: Native: $36,794; State: $61,691
> Poverty rate: Native: 24.5%; State: 11.2%
> State population: 3,155,070 – 20th lowest
Kansas
> Largest native population: Cherokee (pop: 4,589)
> Second largest native population: Potawatomi (pop: 2,441)
> State residents who self-identify as American Indian: 0.82% – 24th lowest (total: 24,010)
> Median household income: Native: $41,691; State: $62,087
> Poverty rate: Native: 19.7%; State: 11.4%
> State population: 2,913,314 – 16th lowest
Kentucky
> Largest native population: Cherokee (pop: 2,974)
> Second largest native population: Sioux (pop: 472)
> State residents who self-identify as American Indian: 0.21% – 8th lowest (total: 9,386)
> Median household income: Native: $34,250; State: $52,295
> Poverty rate: Native: 25.4%; State: 16.3%
> State population: 4,467,673 – 25th lowest
Louisiana
> Largest native population: Houma (pop: 8,489)
> Second largest native population: Cherokee (pop: 2,452)
> State residents who self-identify as American Indian: 0.57% – 24th highest (total: 26,361)
> Median household income: Native: $43,875; State: $51,073
> Poverty rate: Native: 22.8%; State: 19.0%
> State population: 4,648,794 – 25th highest
Maine
> Largest native population: Cherokee (pop: 207)
> Second largest native population: Chickasaw (pop: 180)
> State residents who self-identify as American Indian: 0.64% – 7th lowest (total: 8,660)
> Median household income: Native: $33,767; State: $58,924
> Poverty rate: Native: 29.1%; State: 10.9%
> State population: 1,344,212 – 9th lowest
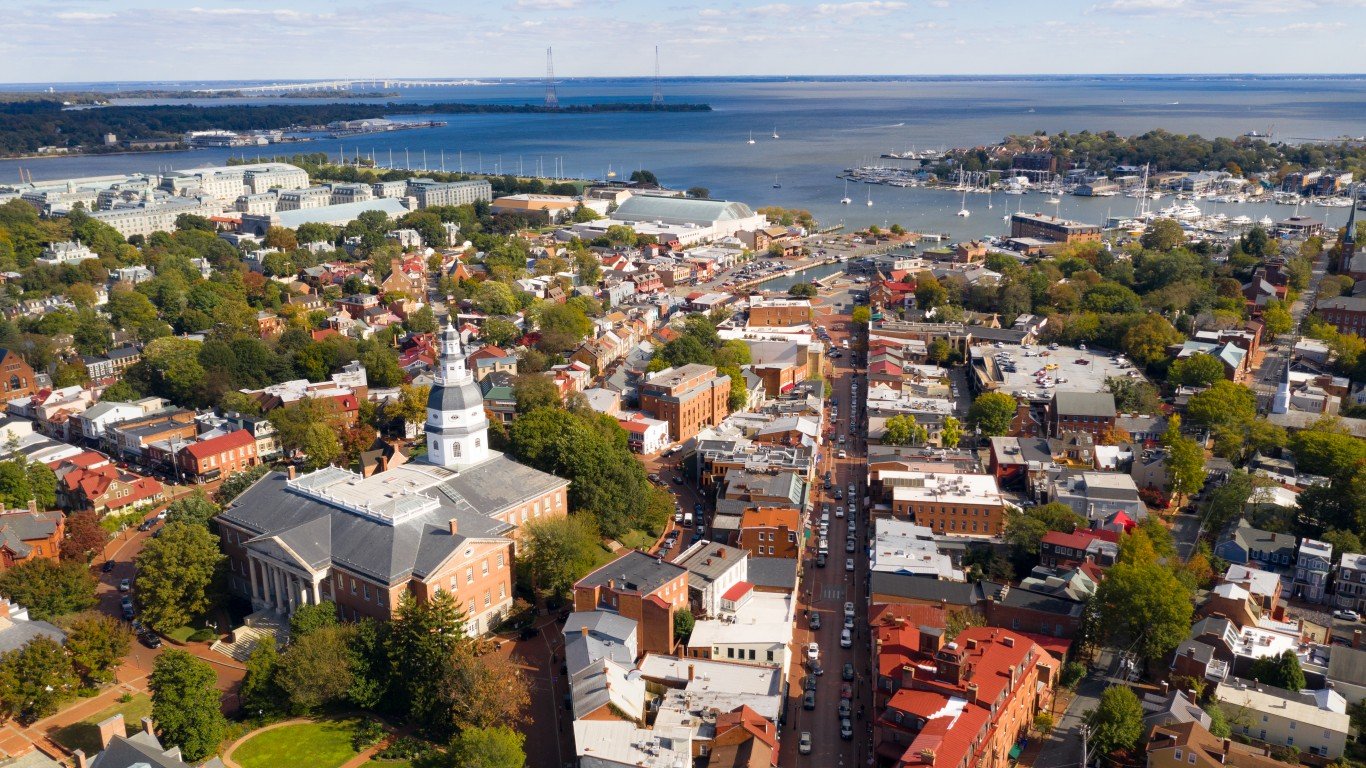
Maryland
> Largest native population: Cherokee (pop: 1,817)
> Second largest native population: Mexican American Indian (pop: 1,292)
> State residents who self-identify as American Indian: 0.28% – 15th lowest (total: 16,762)
> Median household income: Native: $71,803; State: $86,738
> Poverty rate: Native: 15.1%; State: 9.0%
> State population: 6,045,680 – 19th highest
Massachusetts
> Largest native population: South American Indian (pop: 1,724)
> Second largest native population: Cherokee (pop: 695)
> State residents who self-identify as American Indian: 0.21% – 13th lowest (total: 14,764)
> Median household income: Native: $37,587; State: $85,843
> Poverty rate: Native: 22.3%; State: 9.4%
> State population: 6,892,503 – 15th highest
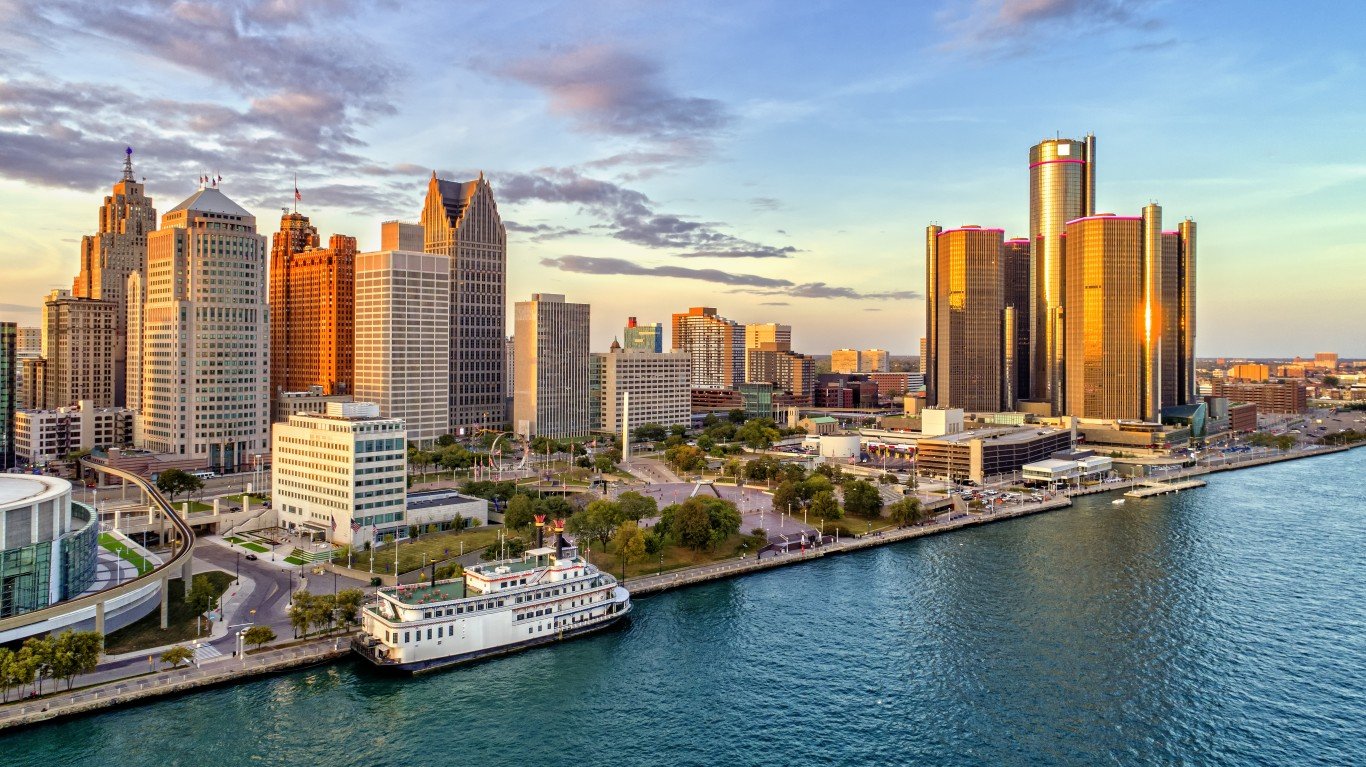
Michigan
> Largest native population: Chippewa (pop: 23,170)
> Second largest native population: Ottawa (pop: 3,579)
> State residents who self-identify as American Indian: 0.53% – 15th highest (total: 53,316)
> Median household income: Native: $43,453; State: $59,584
> Poverty rate: Native: 22.4%; State: 13.0%
> State population: 9,986,857 – 10th highest
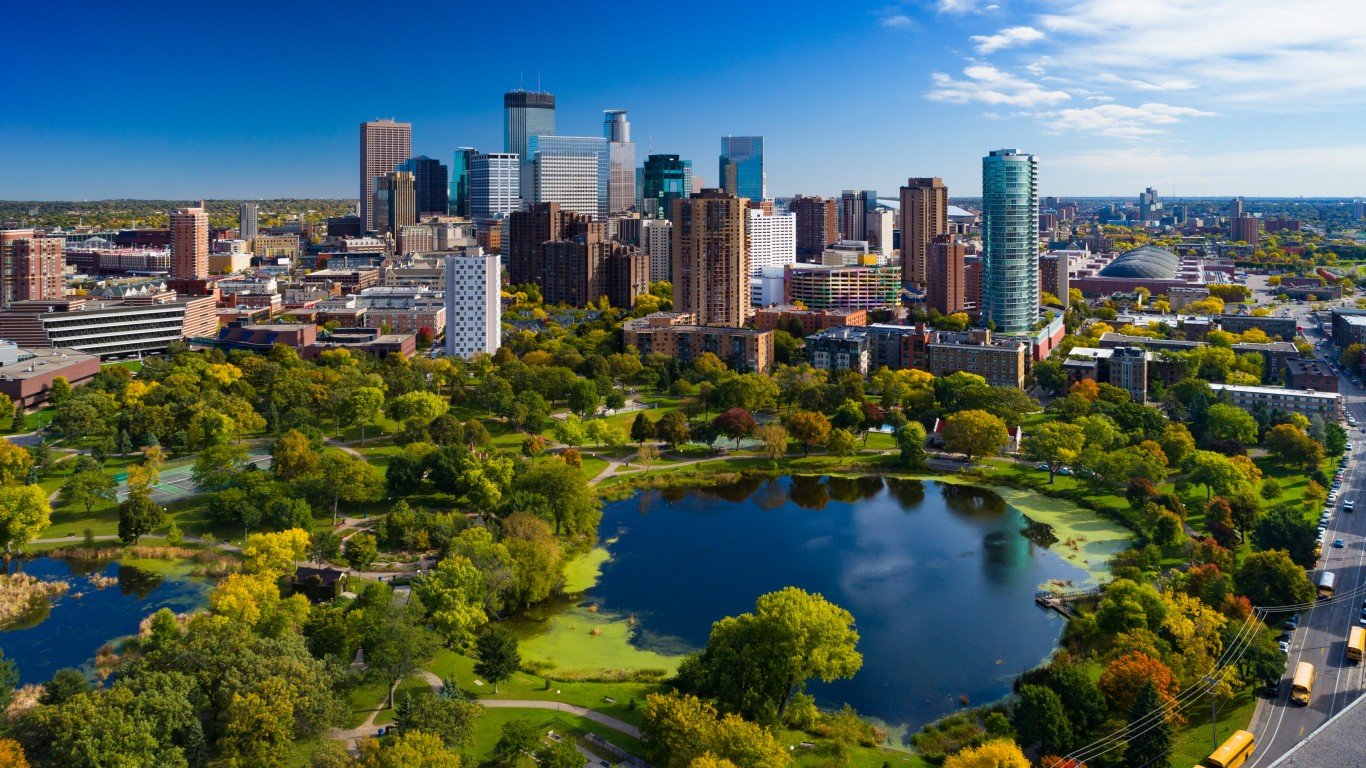
Minnesota
> Largest native population: Chippewa (pop: 36,906)
> Second largest native population: Sioux (pop: 5,860)
> State residents who self-identify as American Indian: 1.03% – 13th highest (total: 58,011)
> Median household income: Native: $37,973; State: $74,593
> Poverty rate: Native: 31.3%; State: 9.0%
> State population: 5,639,632 – 22nd highest
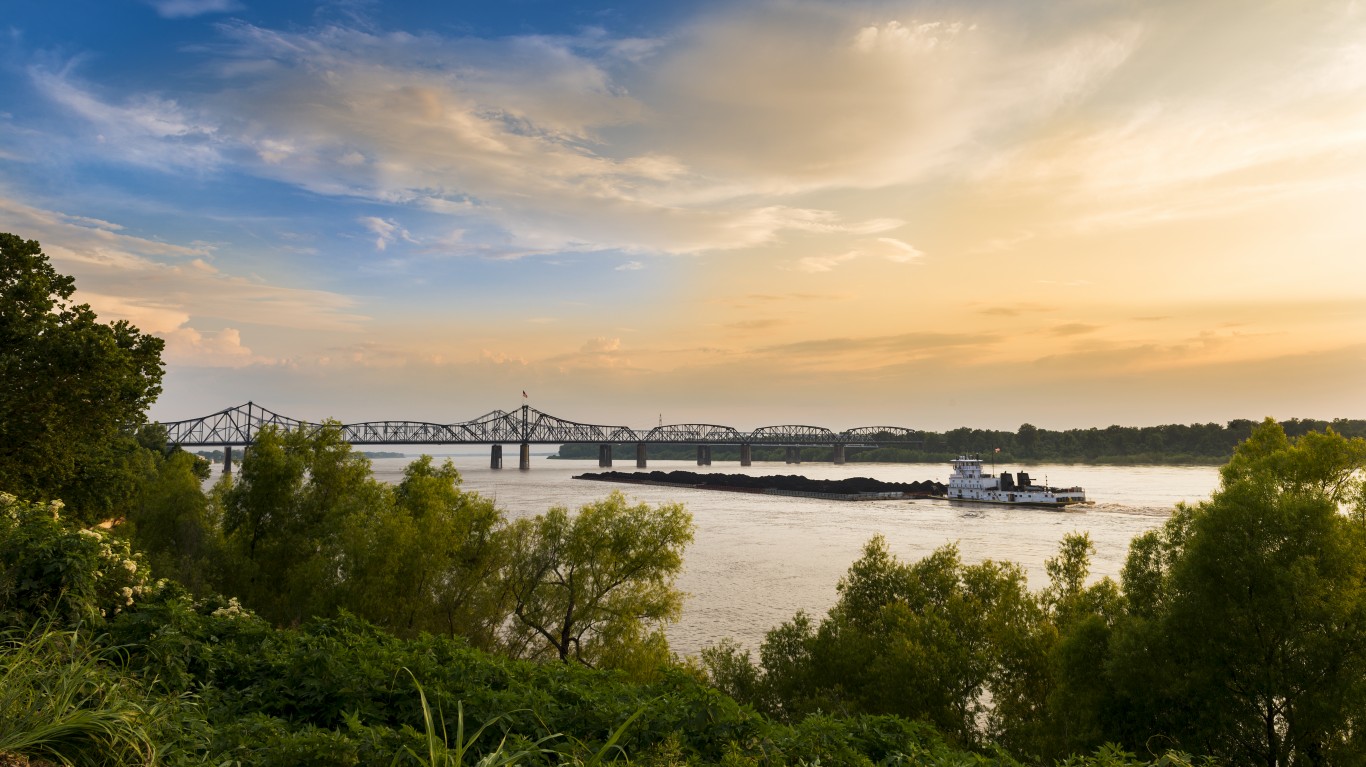
Mississippi
> Largest native population: Choctaw (pop: 9,771)
> Second largest native population: Cherokee (pop: 855)
> State residents who self-identify as American Indian: 0.48% – 12th lowest (total: 14,269)
> Median household income: Native: $32,510; State: $45,792
> Poverty rate: Native: 33.5%; State: 19.6%
> State population: 2,976,149 – 17th lowest
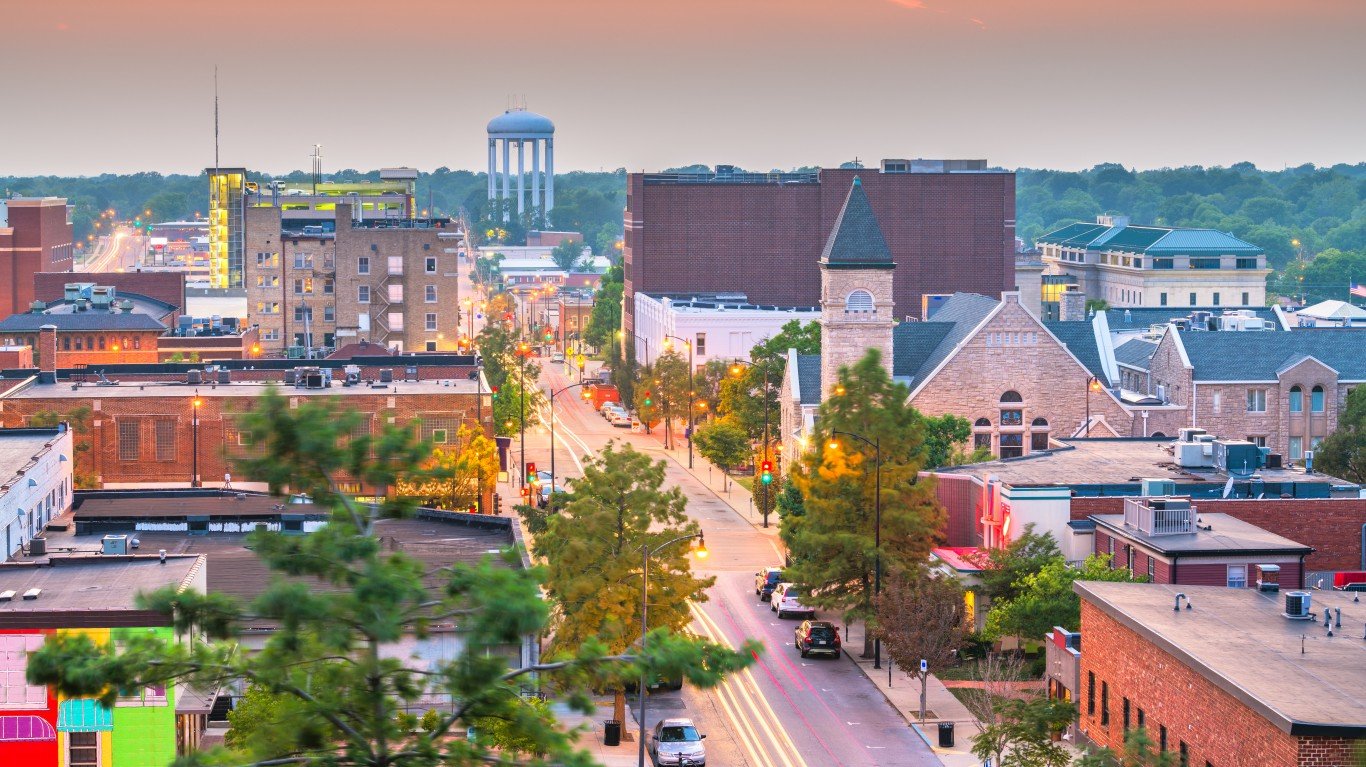
Missouri
> Largest native population: Cherokee (pop: 9,046)
> Second largest native population: Choctaw (pop: 1,119)
> State residents who self-identify as American Indian: 0.44% – 23rd highest (total: 27,084)
> Median household income: Native: $38,999; State: $57,409
> Poverty rate: Native: 22.2%; State: 12.9%
> State population: 6,137,428 – 18th highest
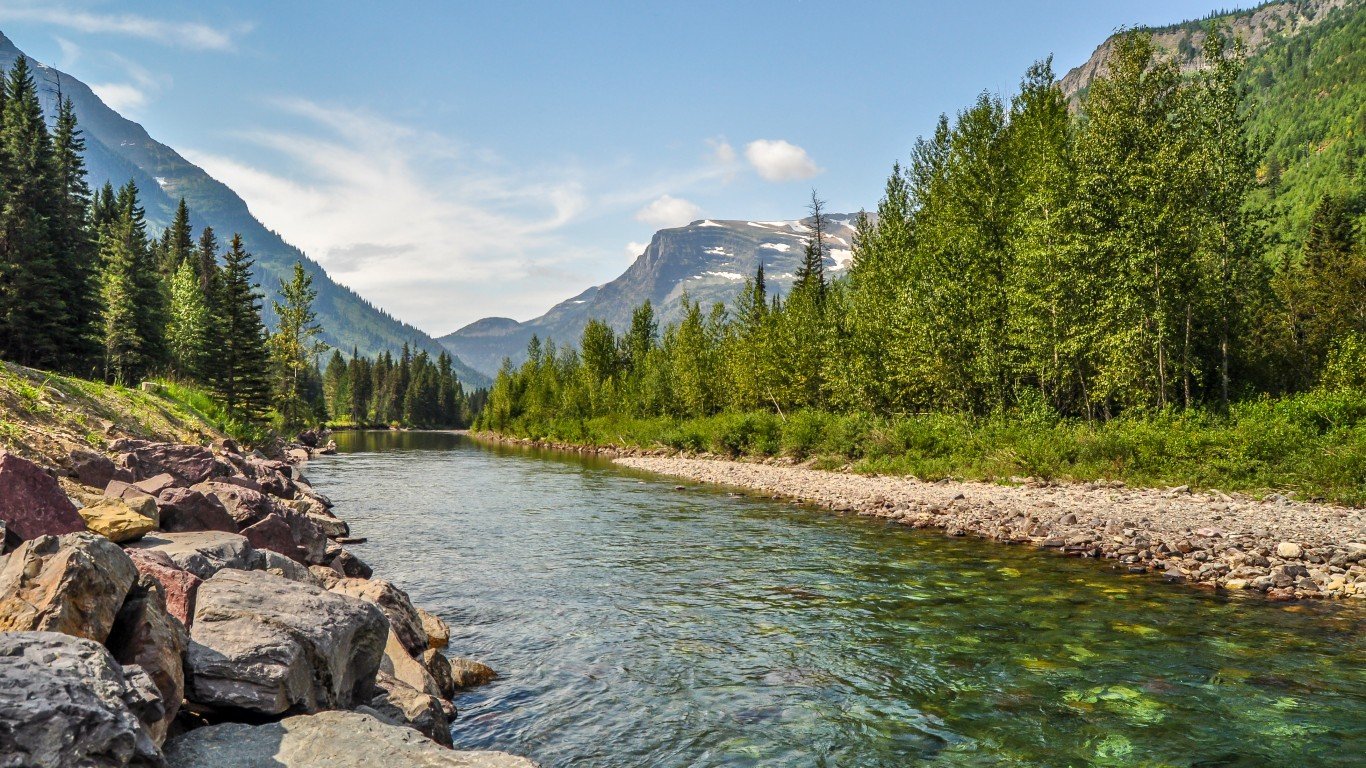
Montana
> Largest native population: Blackfeet (pop: 12,637)
> Second largest native population: Crow (pop: 9,724)
> State residents who self-identify as American Indian: 6.25% – 11th highest (total: 66,839)
> Median household income: Native: $33,535; State: $57,153
> Poverty rate: Native: 32.2%; State: 12.6%
> State population: 1,068,778 – 8th lowest
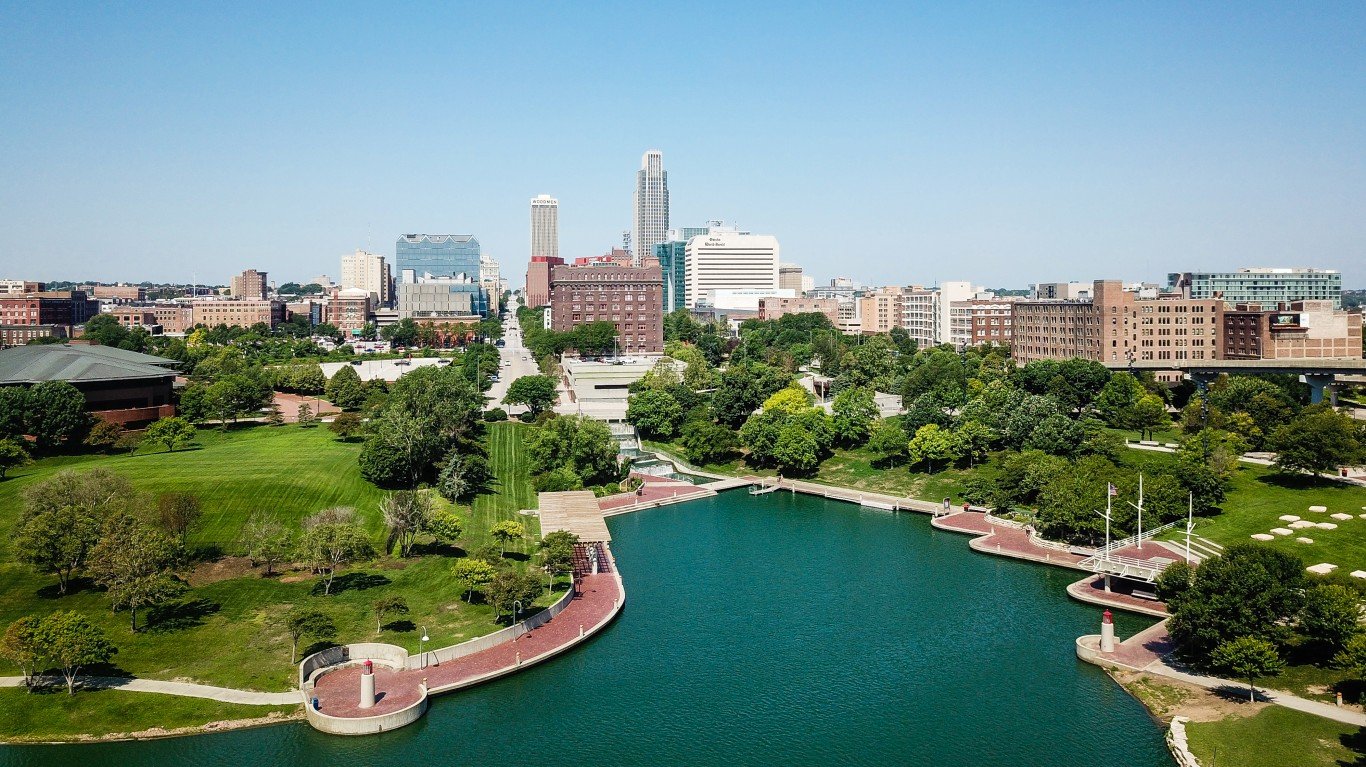
Nebraska
> Largest native population: Sioux (pop: 4,645)
> Second largest native population: Cherokee (pop: 779)
> State residents who self-identify as American Indian: 0.91% – 17th lowest (total: 17,673)
> Median household income: Native: $40,910; State: $63,229
> Poverty rate: Native: 27.7%; State: 9.9%
> State population: 1,934,408 – 14th lowest
Nevada
> Largest native population: Paiute (pop: 6,311)
> Second largest native population: Mexican American Indian (pop: 4,167)
> State residents who self-identify as American Indian: 1.23% – 19th highest (total: 38,026)
> Median household income: Native: $44,324; State: $63,276
> Poverty rate: Native: 23.6%; State: 12.5%
> State population: 3,080,156 – 19th lowest
New Hampshire
> Largest native population: Cherokee (pop: 208)
> Second largest native population: Iroquois (pop: 118)
> State residents who self-identify as American Indian: 0.15% – the lowest (total: 2,036)
> Median household income: Native: $57,250; State: $77,933
> Poverty rate: Native: 11.1%; State: 7.3%
> State population: 1,359,711 – 10th lowest
New Jersey
> Largest native population: South American Indian (pop: 2,706)
> Second largest native population: Mexican American Indian (pop: 2,260)
> State residents who self-identify as American Indian: 0.22% – 19th lowest (total: 19,711)
> Median household income: Native: $61,204; State: $85,751
> Poverty rate: Native: 17.1%; State: 9.2%
> State population: 8,882,190 – 11th highest
New Mexico
> Largest native population: Navajo (pop: 122,067)
> Second largest native population: Pueblo (pop: 48,468)
> State residents who self-identify as American Indian: 9.53% – 4th highest (total: 199,845)
> Median household income: Native: $35,349; State: $51,945
> Poverty rate: Native: 32.5%; State: 18.2%
> State population: 2,096,829 – 15th lowest
New York
> Largest native population: Iroquois (pop: 20,932)
> Second largest native population: South American Indian (pop: 8,793)
> State residents who self-identify as American Indian: 0.41% – 9th highest (total: 79,512)
> Median household income: Native: $41,509; State: $72,108
> Poverty rate: Native: 23.2%; State: 13.0%
> State population: 19,453,561 – 4th highest
North Carolina
> Largest native population: Lumbee (pop: 66,255)
> Second largest native population: Cherokee (pop: 17,268)
> State residents who self-identify as American Indian: 1.18% – 6th highest (total: 123,952)
> Median household income: Native: $40,272; State: $57,341
> Poverty rate: Native: 24.9%; State: 13.6%
> State population: 10,488,084 – 9th highest
North Dakota
> Largest native population: Chippewa (pop: 16,498)
> Second largest native population: Sioux (pop: 11,328)
> State residents who self-identify as American Indian: 5.25% – 18th highest (total: 40,006)
> Median household income: Native: $37,746; State: $64,577
> Poverty rate: Native: 32.2%; State: 10.6%
> State population: 762,062 – 4th lowest
Ohio
> Largest native population: Cherokee (pop: 5,379)
> Second largest native population: South American Indian (pop: 1,599)
> State residents who self-identify as American Indian: 0.20% – 21st lowest (total: 22,816)
> Median household income: Native: $34,943; State: $58,642
> Poverty rate: Native: 25.3%; State: 13.1%
> State population: 11,689,100 – 7th highest
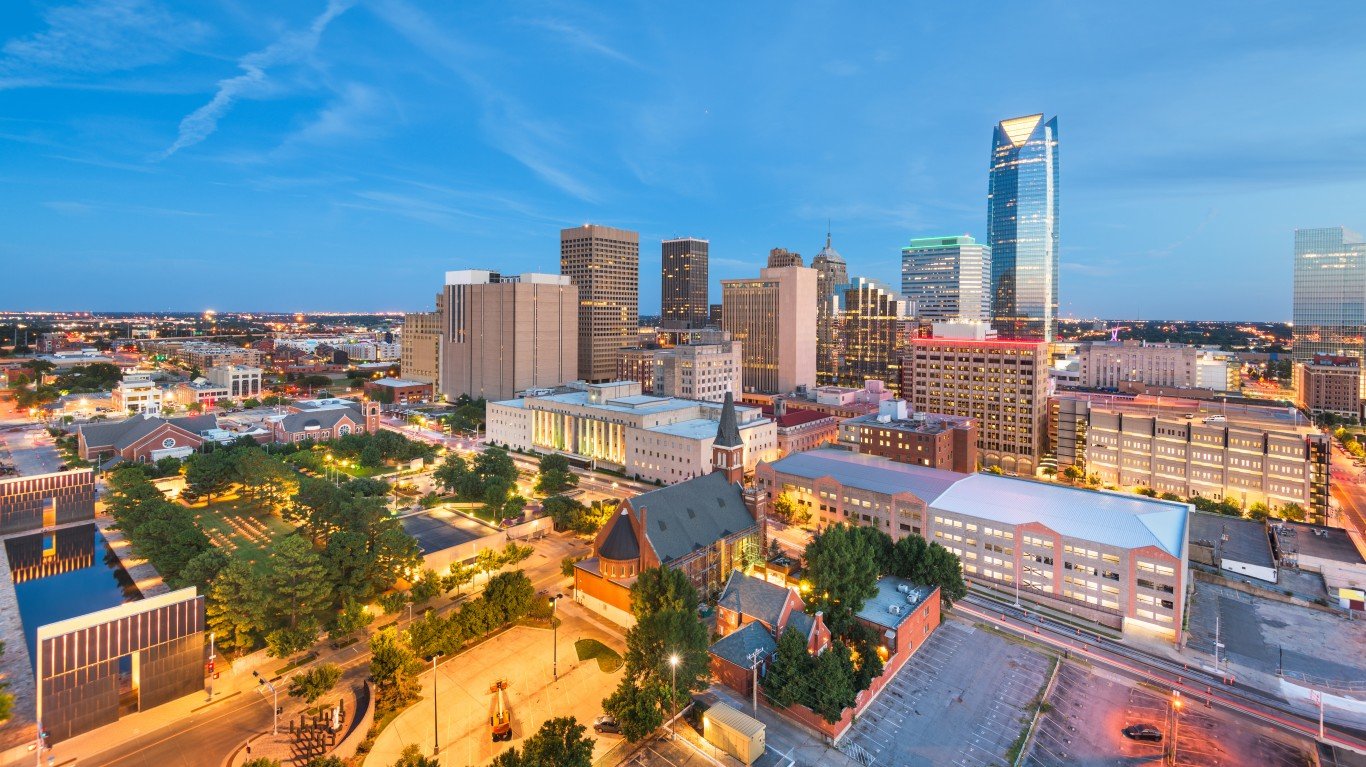
Oklahoma
> Largest native population: Cherokee (pop: 119,235)
> Second largest native population: Choctaw (pop: 46,838)
> State residents who self-identify as American Indian: 7.57% – 3rd highest (total: 299,621)
> Median household income: Native: $44,745; State: $54,449
> Poverty rate: Native: 20.7%; State: 15.2%
> State population: 3,956,971 – 23rd lowest
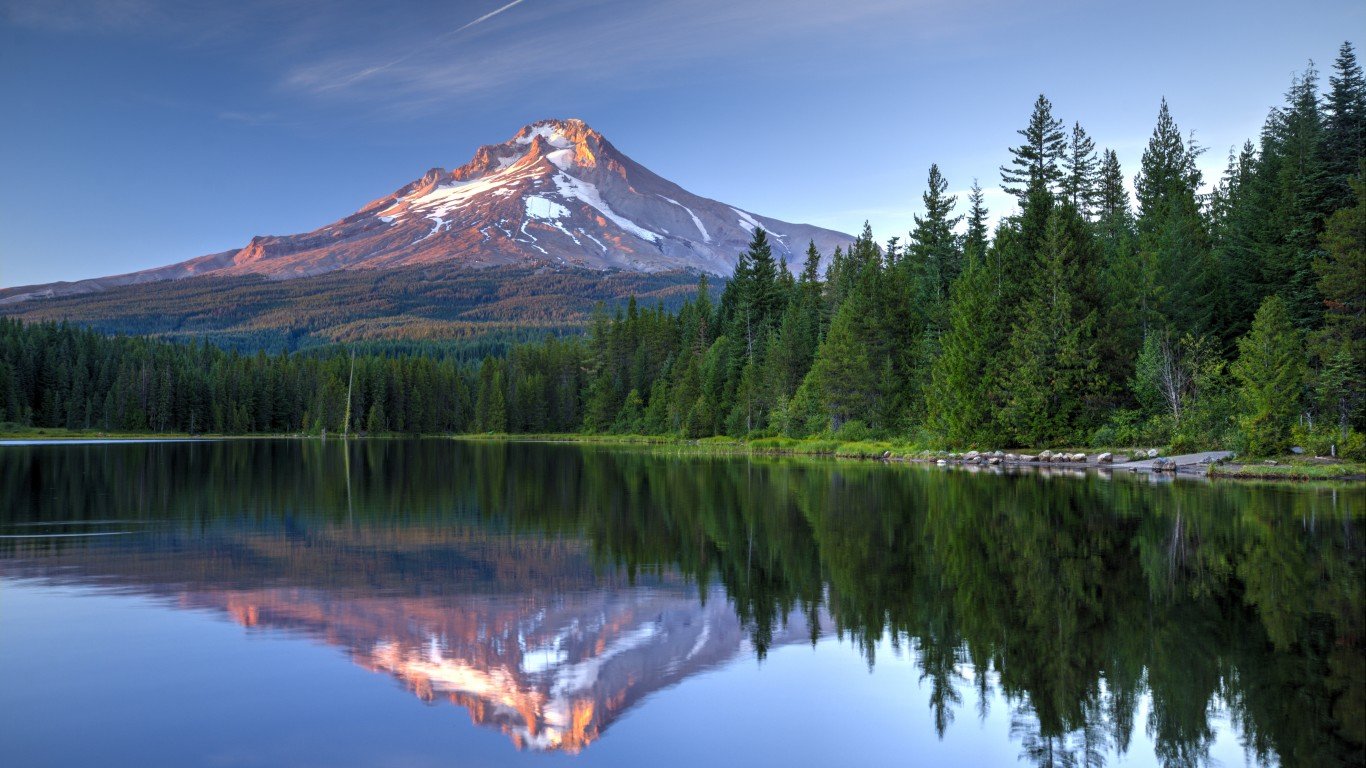
Oregon
> Largest native population: Cherokee (pop: 3,500)
> Second largest native population: Mexican American Indian (pop: 2,568)
> State residents who self-identify as American Indian: 1.14% – 17th highest (total: 48,060)
> Median household income: Native: $44,324; State: $67,058
> Poverty rate: Native: 22.4%; State: 11.4%
> State population: 4,217,737 – 24th lowest
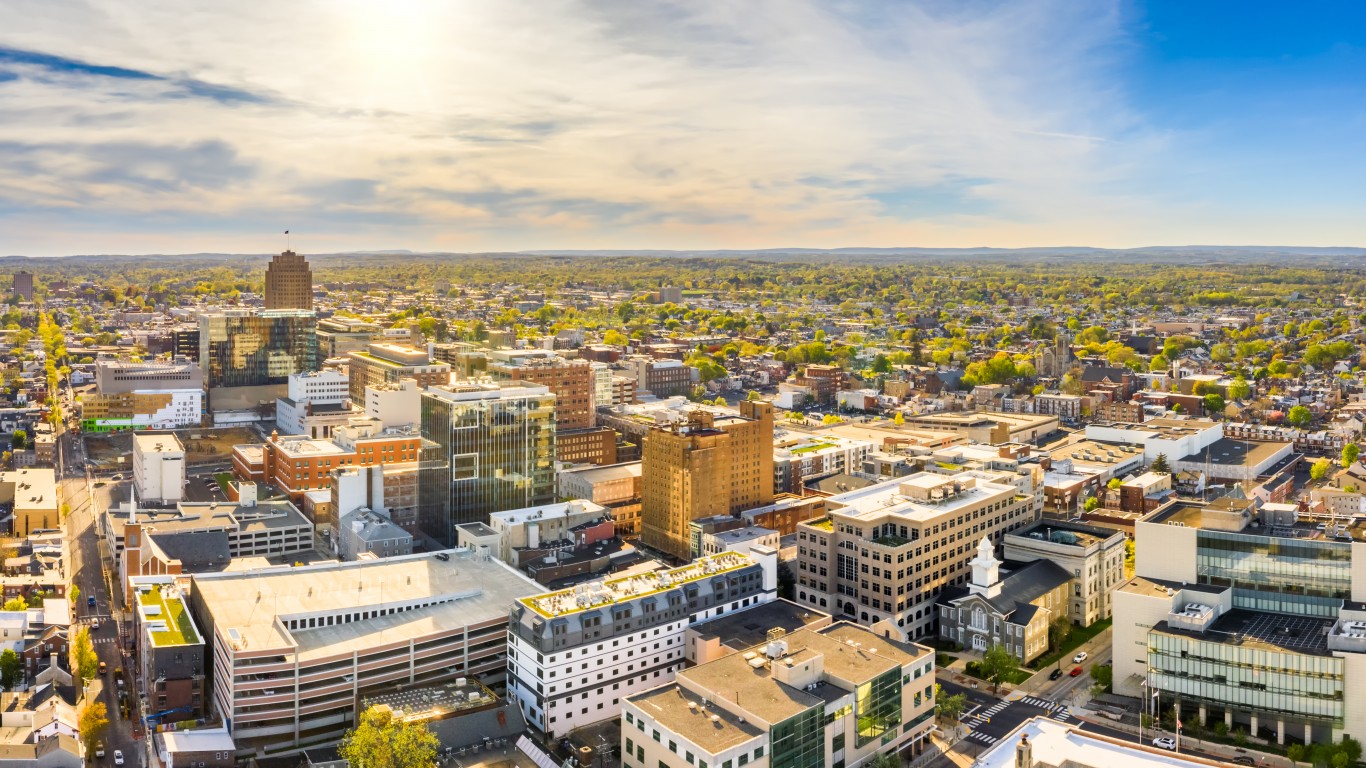
Pennsylvania
> Largest native population: Cherokee (pop: 2,841)
> Second largest native population: Mexican American Indian (pop: 2,482)
> State residents who self-identify as American Indian: 0.19% – 25th lowest (total: 24,691)
> Median household income: Native: $40,622; State: $63,463
> Poverty rate: Native: 24.6%; State: 12.0%
> State population: 12,801,989 – 5th highest
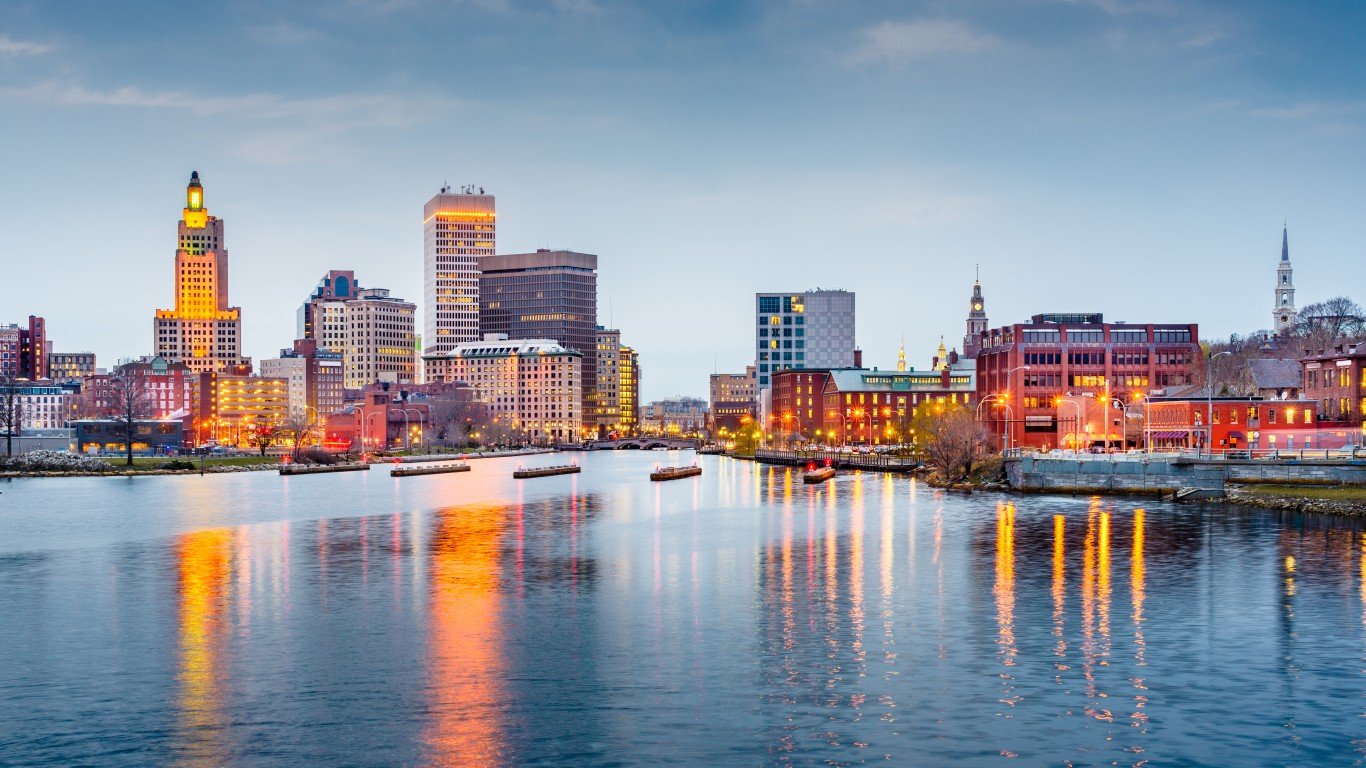
Rhode Island
> Largest native population: South American Indian (pop: 567)
> Second largest native population: Cherokee (pop: 181)
> State residents who self-identify as American Indian: 0.50% – 6th lowest (total: 5,277)
> Median household income: Native: $37,621; State: $71,169
> Poverty rate: Native: 24.6%; State: 10.8%
> State population: 1,059,361 – 7th lowest
South Carolina
> Largest native population: Cherokee (pop: 3,470)
> Second largest native population: Lumbee (pop: 1,893)
> State residents who self-identify as American Indian: 0.34% – 16th lowest (total: 17,645)
> Median household income: Native: $43,861; State: $56,227
> Poverty rate: Native: 22.4%; State: 13.8%
> State population: 5,148,714 – 23rd highest
South Dakota
> Largest native population: Sioux (pop: 59,835)
> Second largest native population: Cheyenne (pop: 398)
> State residents who self-identify as American Indian: 8.61% – 10th highest (total: 76,190)
> Median household income: Native: $27,902; State: $59,533
> Poverty rate: Native: 49.1%; State: 11.9%
> State population: 884,659 – 5th lowest
Tennessee
> Largest native population: Cherokee (pop: 5,642)
> Second largest native population: Choctaw (pop: 893)
> State residents who self-identify as American Indian: 0.27% – 18th lowest (total: 18,189)
> Median household income: Native: $44,764; State: $56,071
> Poverty rate: Native: 20.8%; State: 13.9%
> State population: 6,829,174 – 16th highest
Texas
> Largest native population: Cherokee (pop: 18,670)
> Second largest native population: Mexican American Indian (pop: 13,721)
> State residents who self-identify as American Indian: 0.49% – 5th highest (total: 141,425)
> Median household income: Native: $56,394; State: $64,034
> Poverty rate: Native: 17.1%; State: 13.6%
> State population: 28,995,881 – 2nd highest
Utah
> Largest native population: Navajo (pop: 15,816)
> Second largest native population: Ute (pop: 4,091)
> State residents who self-identify as American Indian: 1.05% – 21st highest (total: 33,721)
> Median household income: Native: $45,957; State: $75,780
> Poverty rate: Native: 27.1%; State: 8.9%
> State population: 3,205,958 – 21st lowest
Vermont
> Largest native population: Cherokee (pop: 154)
> Second largest native population: Canadian and French American Indian (pop: 87)
> State residents who self-identify as American Indian: 0.34% – 2nd lowest (total: 2,132)
> Median household income: Native: $41,959; State: $63,001
> Poverty rate: Native: 17.7%; State: 10.2%
> State population: 623,989 – 2nd lowest
Virginia
> Largest native population: Cherokee (pop: 3,696)
> Second largest native population: Mexican American Indian (pop: 1,492)
> State residents who self-identify as American Indian: 0.28% – 23rd lowest (total: 23,873)
> Median household income: Native: $62,186; State: $76,456
> Poverty rate: Native: 13.0%; State: 9.9%
> State population: 8,535,519 – 12th highest
Washington
> Largest native population: Puget Sound Salish (pop: 12,977)
> Second largest native population: Yakama (pop: 7,322)
> State residents who self-identify as American Indian: 1.24% – 8th highest (total: 94,449)
> Median household income: Native: $48,699; State: $78,687
> Poverty rate: Native: 22.3%; State: 9.8%
> State population: 7,614,893 – 13th highest
West Virginia
> Largest native population: Cherokee (pop: 1,630)
> Second largest native population: Blackfeet (pop: 202)
> State residents who self-identify as American Indian: 0.20% – 3rd lowest (total: 3,667)
> Median household income: Native: $30,406; State: $48,850
> Poverty rate: Native: 16.2%; State: 16.0%
> State population: 1,792,147 – 13th lowest
Wisconsin
> Largest native population: Chippewa (pop: 16,828)
> Second largest native population: Menominee (pop: 8,212)
> State residents who self-identify as American Indian: 0.88% – 16th highest (total: 51,392)
> Median household income: Native: $42,439; State: $64,168
> Poverty rate: Native: 26.1%; State: 10.4%
> State population: 5,822,434 – 20th highest
Wyoming
> Largest native population: Arapaho (pop: 5,171)
> Second largest native population: Shoshone (pop: 2,716)
> State residents who self-identify as American Indian: 2.45% – 11th lowest (total: 14,164)
> Median household income: Native: $51,277; State: $65,003
> Poverty rate: Native: 23.8%; State: 10.1%
> State population: 578,759 – the lowest
Methodology
To identify the largest and second largest Native American population in each state, 24/7 Wall St. reviewed the population figures for Native American and Alaska Native for each state from the U.S. Census Bureau’s American Community Survey 2019 5-year Estimates. Residents who self-identify as American Indian or Alaska Native alone are also from the ACS 5-year estimates, as well as median household income and poverty rate for both the Native population and the total population.
According to the ACS Subject Definitions tribes are represented as tribal groups consisting of specific tribes. For example, the Fort Sill Apache, Mescalero Apache, and San Carlos Apache tribes are all grouped into the tribal grouping, Apache. Tribes that were not shown separately, such as the Abenaki, Penobscot, Mattaponi, Wampanoag, and Shawnee, were categorized by the Census under “All Other American Indian Tribes.”
ACS 5-year population estimates were available for the following American Indian and Alaska Native tribes:
American Indian: Apache, Arapaho, Blackfeet, Canadian and French American Indian, Central American Indian, Cherokee, Cheyenne, Chickasaw, Chippewa, Choctaw, Colville, Comanche, Cree, Creek, Crow, Delaware, Hopi, Houma, Iroquois, Kiowa, Lumbee, Menominee, Mexican American Indian, Navajo, Osage, Ottawa, Paiute, Pima, Potawatomi, Pueblo, Puget Sound Salish, Seminole, Shoshone, Sioux, South American Indian, Spanish American Indian, Tohono O’Odham, Ute, Yakama, Yaqui, Yuman
Alaska Native: Alaskan Athabascan, Aleut, Inupiat, Tlingit-Haida, Tsimshian, Yup’ik