As autumn starts, data gathered by the Centers for Disease Control and Prevention indicates that indicators of COVID-19 for the week ending Sept. 23 are either flatlining or trending lower nationally. However, the pandemic appears to be hitting some states harder than others.
To determine how bad COVID is right now in every state, 24/7 Tempo reviewed data on recent COVID-19 hospital admissions from the Centers for Disease Control and Prevention. States were ranked based on the number of new hospital admissions due to COVID-19 per 100,000 state residents for the week of Sept. 17-23, 2023.
Six of the 10 states with the highest rate of new weekly COVID-19 hospital admissions for the week of Sept. 17-23 – New York, West Virginia, Montana, Missouri, Florida, and Arkansas – were among the 10 states with the highest rate of COVID-19-related hospital admissions the previous week.
This week, Montana, West Virginia, Hawaii, Connecticut, and New York, the states with the highest admission rates, all saw increases compared to the previous week. Montana’s rate rose from 7.7 to 10.2 per 100,000 residents, and West Virginia’s surged from 8.1 to 9.6 per 100,000 people. (For more granular data, here’s a look at counties where the COVID-19 increase is the worst in every state.)
The good news is that the seven-day moving average of hospital admissions was just over 19,000 for the week ending Sept. 23, a decline of 3.1% from the prior weekly period, according to CDC data.
The rate of positive test results nationally has decreased from 12.5% to 11.6% – but 16 states still have positivity rates above the national average. Five states share the lowest positivity rates, and three of them – Delaware, Maryland, and Virginia – are from the same region. (These are the states with the most health-conscious residents.)
Methodology
To determine how bad COVID is right now in every state, 24/7 Tempo reviewed data on recent COVID-19 hospital admissions from the Centers for Disease Control and Prevention. States were ranked based on the number of new hospital admissions due to COVID-19 per 100,000 state residents for the week of Sept. 17-23, 2023. Supplemental data on the total number of recorded COVID-19 hospital admissions since Aug. 1, 2020; the total number of deaths due to COVID-19 since January 2020; and the COVID-19 test positivity rate for the week of Sept. 17-23, 2023 also came from the CDC. Population data used to adjust hospital admission and death counts per capita came from the U.S. Census Bureau’s Population and Housing Unit Estimates program and is for July 1, 2022.

50. New Mexico
> New weekly COVID-19 hospital admissions, Sept. 17-23, 2023: 2.7 per 100,000 (57 total)
> COVID-19 hospital admissions since Aug. 1, 2020: 1,815.3 per 100,000 (22nd lowest)
> COVID-19 deaths since Jan. 2020: 442.8 per 100,000 (5th highest)
> Current COVID-19 test positivity rate: 10.4% (24th lowest)
49. Mississippi
> New weekly COVID-19 hospital admissions, Sept. 17-23, 2023: 3.1 per 100,000 (91 total)
> COVID-19 hospital admissions since Aug. 1, 2020: 1,907.7 per 100,000 (24th highest)
> COVID-19 deaths since Jan. 2020: 506.2 per 100,000 (the highest)
> Current COVID-19 test positivity rate: 9.0% (13th lowest)

48. Maine
> New weekly COVID-19 hospital admissions, Sept. 17-23, 2023: 3.2 per 100,000 (44 total)
> COVID-19 hospital admissions since Aug. 1, 2020: 1,098.8 per 100,000 (3rd lowest)
> COVID-19 deaths since Jan. 2020: 238.1 per 100,000 (8th lowest)
> Current COVID-19 test positivity rate: 9.7% (19th lowest)

47. Alaska
> New weekly COVID-19 hospital admissions, Sept. 17-23, 2023: 3.3 per 100,000 (24 total)
> COVID-19 hospital admissions since Aug. 1, 2020: 1,336.2 per 100,000 (7th lowest)
> COVID-19 deaths since Jan. 2020: 207.3 per 100,000 (5th lowest)
> Current COVID-19 test positivity rate: 13.0% (7th highest)

46. Arizona
> New weekly COVID-19 hospital admissions, Sept. 17-23, 2023: 3.4 per 100,000 (248 total)
> COVID-19 hospital admissions since Aug. 1, 2020: 2,093.8 per 100,000 (14th highest)
> COVID-19 deaths since Jan. 2020: 404.3 per 100,000 (13th highest)
> Current COVID-19 test positivity rate: 11.1% (17th highest)
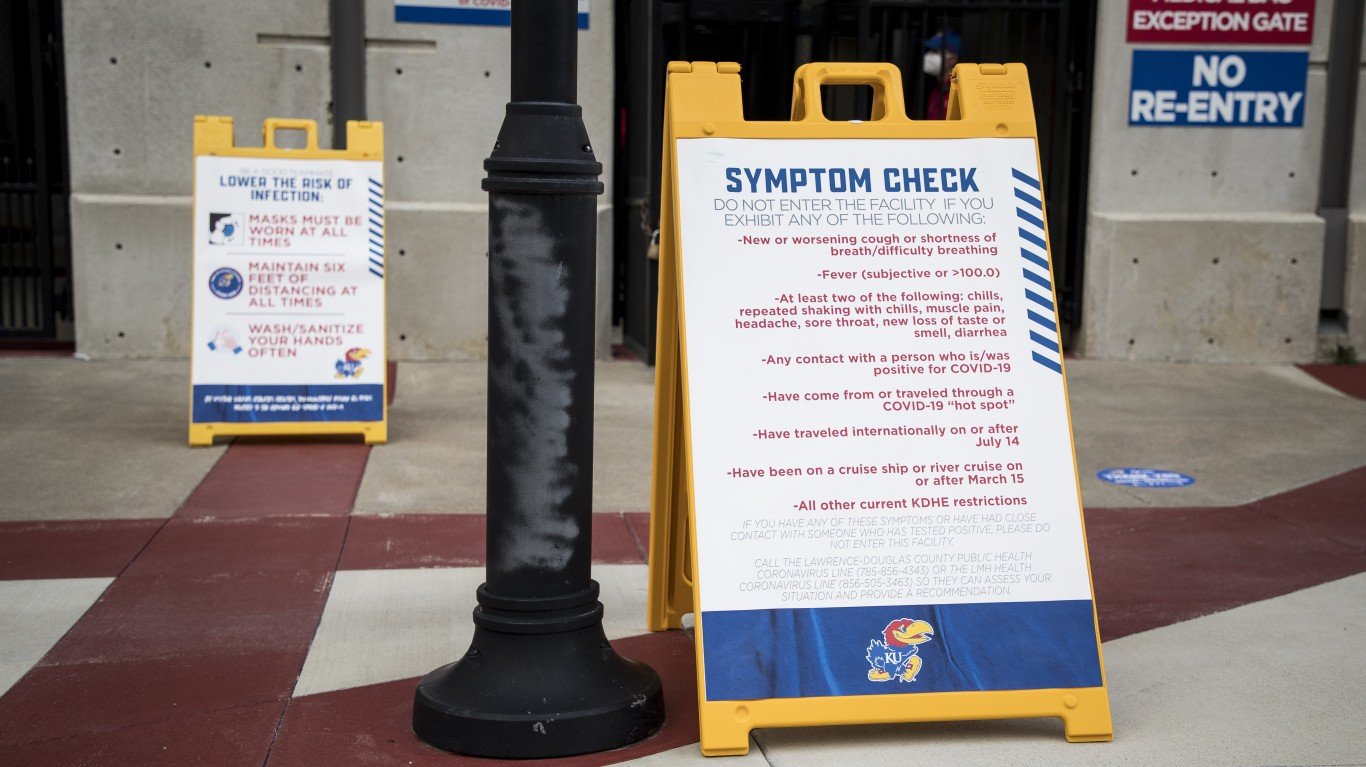
45. Kansas
> New weekly COVID-19 hospital admissions, Sept. 17-23, 2023: 3.8 per 100,000 (113 total)
> COVID-19 hospital admissions since Aug. 1, 2020: 1,949.8 per 100,000 (20th highest)
> COVID-19 deaths since Jan. 2020: 361.3 per 100,000 (23rd highest)
> Current COVID-19 test positivity rate: 15.0% (the highest)
44. Nebraska
> New weekly COVID-19 hospital admissions, Sept. 17-23, 2023: 3.9 per 100,000 (77 total)
> COVID-19 hospital admissions since Aug. 1, 2020: 1,610.4 per 100,000 (17th lowest)
> COVID-19 deaths since Jan. 2020: 293.8 per 100,000 (15th lowest)
> Current COVID-19 test positivity rate: 15.0% (the highest)

43. Wyoming
> New weekly COVID-19 hospital admissions, Sept. 17-23, 2023: 4.0 per 100,000 (23 total)
> COVID-19 hospital admissions since Aug. 1, 2020: 1,969.3 per 100,000 (19th highest)
> COVID-19 deaths since Jan. 2020: 369.8 per 100,000 (19th highest)
> Current COVID-19 test positivity rate: 10.9% (21st highest)

42. Utah
> New weekly COVID-19 hospital admissions, Sept. 17-23, 2023: 4.0 per 100,000 (135 total)
> COVID-19 hospital admissions since Aug. 1, 2020: 1,396.3 per 100,000 (10th lowest)
> COVID-19 deaths since Jan. 2020: 163.8 per 100,000 (3rd lowest)
> Current COVID-19 test positivity rate: 10.9% (21st highest)

41. Indiana
> New weekly COVID-19 hospital admissions, Sept. 17-23, 2023: 4.1 per 100,000 (277 total)
> COVID-19 hospital admissions since Aug. 1, 2020: 2,048.2 per 100,000 (15th highest)
> COVID-19 deaths since Jan. 2020: 380.7 per 100,000 (16th highest)
> Current COVID-19 test positivity rate: 12.8% (11th highest)

40. Washington
> New weekly COVID-19 hospital admissions, Sept. 17-23, 2023: 4.3 per 100,000 (335 total)
> COVID-19 hospital admissions since Aug. 1, 2020: 995.0 per 100,000 (2nd lowest)
> COVID-19 deaths since Jan. 2020: 194.4 per 100,000 (4th lowest)
> Current COVID-19 test positivity rate: 13.0% (7th highest)

39. Minnesota
> New weekly COVID-19 hospital admissions, Sept. 17-23, 2023: 4.4 per 100,000 (254 total)
> COVID-19 hospital admissions since Aug. 1, 2020: 1,386.9 per 100,000 (9th lowest)
> COVID-19 deaths since Jan. 2020: 272.6 per 100,000 (10th lowest)
> Current COVID-19 test positivity rate: 12.8% (11th highest)

38. Georgia
> New weekly COVID-19 hospital admissions, Sept. 17-23, 2023: 4.4 per 100,000 (485 total)
> COVID-19 hospital admissions since Aug. 1, 2020: 2,204.7 per 100,000 (9th highest)
> COVID-19 deaths since Jan. 2020: 332.6 per 100,000 (20th lowest)
> Current COVID-19 test positivity rate: 9.0% (13th lowest)
37. North Dakota
> New weekly COVID-19 hospital admissions, Sept. 17-23, 2023: 4.5 per 100,000 (35 total)
> COVID-19 hospital admissions since Aug. 1, 2020: 1,938.8 per 100,000 (21st highest)
> COVID-19 deaths since Jan. 2020: 339.4 per 100,000 (21st lowest)
> Current COVID-19 test positivity rate: 10.9% (21st highest)
36. Iowa
> New weekly COVID-19 hospital admissions, Sept. 17-23, 2023: 4.5 per 100,000 (144 total)
> COVID-19 hospital admissions since Aug. 1, 2020: 1,706.6 per 100,000 (19th lowest)
> COVID-19 deaths since Jan. 2020: 348.3 per 100,000 (25th highest)
> Current COVID-19 test positivity rate: 15.0% (the highest)

35. Tennessee
> New weekly COVID-19 hospital admissions, Sept. 17-23, 2023: 4.5 per 100,000 (320 total)
> COVID-19 hospital admissions since Aug. 1, 2020: 1,863.5 per 100,000 (24th lowest)
> COVID-19 deaths since Jan. 2020: 408.6 per 100,000 (10th highest)
> Current COVID-19 test positivity rate: 9.0% (13th lowest)

34. Vermont
> New weekly COVID-19 hospital admissions, Sept. 17-23, 2023: 4.8 per 100,000 (31 total)
> COVID-19 hospital admissions since Aug. 1, 2020: 982.4 per 100,000 (the lowest)
> COVID-19 deaths since Jan. 2020: 159.5 per 100,000 (2nd lowest)
> Current COVID-19 test positivity rate: 9.7% (19th lowest)
33. Colorado
> New weekly COVID-19 hospital admissions, Sept. 17-23, 2023: 4.8 per 100,000 (280 total)
> COVID-19 hospital admissions since Aug. 1, 2020: 1,668.0 per 100,000 (18th lowest)
> COVID-19 deaths since Jan. 2020: 256.9 per 100,000 (9th lowest)
> Current COVID-19 test positivity rate: 10.9% (21st highest)

32. Rhode Island
> New weekly COVID-19 hospital admissions, Sept. 17-23, 2023: 4.8 per 100,000 (53 total)
> COVID-19 hospital admissions since Aug. 1, 2020: 1,210.1 per 100,000 (5th lowest)
> COVID-19 deaths since Jan. 2020: 365.4 per 100,000 (20th highest)
> Current COVID-19 test positivity rate: 9.7% (19th lowest)

31. Louisiana
> New weekly COVID-19 hospital admissions, Sept. 17-23, 2023: 4.9 per 100,000 (223 total)
> COVID-19 hospital admissions since Aug. 1, 2020: 2,101.6 per 100,000 (13th highest)
> COVID-19 deaths since Jan. 2020: 386.1 per 100,000 (14th highest)
> Current COVID-19 test positivity rate: 10.4% (24th lowest)

30. Illinois
> New weekly COVID-19 hospital admissions, Sept. 17-23, 2023: 5.0 per 100,000 (632 total)
> COVID-19 hospital admissions since Aug. 1, 2020: 1,832.7 per 100,000 (23rd lowest)
> COVID-19 deaths since Jan. 2020: 321.5 per 100,000 (19th lowest)
> Current COVID-19 test positivity rate: 12.8% (11th highest)

29. Idaho
> New weekly COVID-19 hospital admissions, Sept. 17-23, 2023: 5.1 per 100,000 (99 total)
> COVID-19 hospital admissions since Aug. 1, 2020: 1,435.8 per 100,000 (12th lowest)
> COVID-19 deaths since Jan. 2020: 285.0 per 100,000 (13th lowest)
> Current COVID-19 test positivity rate: 13.0% (7th highest)
28. Oklahoma
> New weekly COVID-19 hospital admissions, Sept. 17-23, 2023: 5.1 per 100,000 (206 total)
> COVID-19 hospital admissions since Aug. 1, 2020: 2,745.8 per 100,000 (2nd highest)
> COVID-19 deaths since Jan. 2020: 487.3 per 100,000 (3rd highest)
> Current COVID-19 test positivity rate: 10.4% (24th lowest)

27. Virginia
> New weekly COVID-19 hospital admissions, Sept. 17-23, 2023: 5.3 per 100,000 (459 total)
> COVID-19 hospital admissions since Aug. 1, 2020: 1,408.9 per 100,000 (11th lowest)
> COVID-19 deaths since Jan. 2020: 272.7 per 100,000 (11th lowest)
> Current COVID-19 test positivity rate: 7.6% (5th lowest)

26. Ohio
> New weekly COVID-19 hospital admissions, Sept. 17-23, 2023: 5.4 per 100,000 (631 total)
> COVID-19 hospital admissions since Aug. 1, 2020: 2,228.3 per 100,000 (8th highest)
> COVID-19 deaths since Jan. 2020: 423.9 per 100,000 (7th highest)
> Current COVID-19 test positivity rate: 12.8% (11th highest)

25. Nevada
> New weekly COVID-19 hospital admissions, Sept. 17-23, 2023: 5.4 per 100,000 (171 total)
> COVID-19 hospital admissions since Aug. 1, 2020: 2,039.5 per 100,000 (17th highest)
> COVID-19 deaths since Jan. 2020: 375.9 per 100,000 (18th highest)
> Current COVID-19 test positivity rate: 11.1% (17th highest)
24. Pennsylvania
> New weekly COVID-19 hospital admissions, Sept. 17-23, 2023: 5.5 per 100,000 (707 total)
> COVID-19 hospital admissions since Aug. 1, 2020: 1,900.5 per 100,000 (25th highest)
> COVID-19 deaths since Jan. 2020: 407.4 per 100,000 (11th highest)
> Current COVID-19 test positivity rate: 7.6% (5th lowest)
23. Michigan
> New weekly COVID-19 hospital admissions, Sept. 17-23, 2023: 5.5 per 100,000 (549 total)
> COVID-19 hospital admissions since Aug. 1, 2020: 1,930.4 per 100,000 (22nd highest)
> COVID-19 deaths since Jan. 2020: 376.9 per 100,000 (17th highest)
> Current COVID-19 test positivity rate: 12.8% (11th highest)

22. Maryland
> New weekly COVID-19 hospital admissions, Sept. 17-23, 2023: 5.5 per 100,000 (339 total)
> COVID-19 hospital admissions since Aug. 1, 2020: 1,566.0 per 100,000 (14th lowest)
> COVID-19 deaths since Jan. 2020: 295.1 per 100,000 (16th lowest)
> Current COVID-19 test positivity rate: 7.6% (5th lowest)

21. Wisconsin
> New weekly COVID-19 hospital admissions, Sept. 17-23, 2023: 5.6 per 100,000 (329 total)
> COVID-19 hospital admissions since Aug. 1, 2020: 2,155.1 per 100,000 (10th highest)
> COVID-19 deaths since Jan. 2020: 291.6 per 100,000 (14th lowest)
> Current COVID-19 test positivity rate: 12.8% (11th highest)
20. North Carolina
> New weekly COVID-19 hospital admissions, Sept. 17-23, 2023: 5.6 per 100,000 (598 total)
> COVID-19 hospital admissions since Aug. 1, 2020: 1,583.6 per 100,000 (16th lowest)
> COVID-19 deaths since Jan. 2020: 318.2 per 100,000 (18th lowest)
> Current COVID-19 test positivity rate: 9.0% (13th lowest)

19. Texas
> New weekly COVID-19 hospital admissions, Sept. 17-23, 2023: 5.6 per 100,000 (1687 total)
> COVID-19 hospital admissions since Aug. 1, 2020: 2,040.2 per 100,000 (16th highest)
> COVID-19 deaths since Jan. 2020: 341.4 per 100,000 (24th lowest)
> Current COVID-19 test positivity rate: 10.4% (24th lowest)

18. New Jersey
> New weekly COVID-19 hospital admissions, Sept. 17-23, 2023: 5.7 per 100,000 (525 total)
> COVID-19 hospital admissions since Aug. 1, 2020: 1,873.2 per 100,000 (25th lowest)
> COVID-19 deaths since Jan. 2020: 382.4 per 100,000 (15th highest)
> Current COVID-19 test positivity rate: 13.2% (5th highest)
17. Delaware
> New weekly COVID-19 hospital admissions, Sept. 17-23, 2023: 5.7 per 100,000 (58 total)
> COVID-19 hospital admissions since Aug. 1, 2020: 1,985.2 per 100,000 (18th highest)
> COVID-19 deaths since Jan. 2020: 340.8 per 100,000 (23rd lowest)
> Current COVID-19 test positivity rate: 7.6% (5th lowest)
16. Alabama
> New weekly COVID-19 hospital admissions, Sept. 17-23, 2023: 5.7 per 100,000 (289 total)
> COVID-19 hospital admissions since Aug. 1, 2020: 2,319.3 per 100,000 (6th highest)
> COVID-19 deaths since Jan. 2020: 442.3 per 100,000 (6th highest)
> Current COVID-19 test positivity rate: 9.0% (13th lowest)

15. South Carolina
> New weekly COVID-19 hospital admissions, Sept. 17-23, 2023: 5.9 per 100,000 (311 total)
> COVID-19 hospital admissions since Aug. 1, 2020: 1,810.6 per 100,000 (21st lowest)
> COVID-19 deaths since Jan. 2020: 404.6 per 100,000 (12th highest)
> Current COVID-19 test positivity rate: 9.0% (13th lowest)

14. Oregon
> New weekly COVID-19 hospital admissions, Sept. 17-23, 2023: 6.0 per 100,000 (255 total)
> COVID-19 hospital admissions since Aug. 1, 2020: 1,103.6 per 100,000 (4th lowest)
> COVID-19 deaths since Jan. 2020: 220.0 per 100,000 (6th lowest)
> Current COVID-19 test positivity rate: 13.0% (7th highest)

13. Kentucky
> New weekly COVID-19 hospital admissions, Sept. 17-23, 2023: 6.1 per 100,000 (276 total)
> COVID-19 hospital admissions since Aug. 1, 2020: 3,465.5 per 100,000 (the highest)
> COVID-19 deaths since Jan. 2020: 444.4 per 100,000 (4th highest)
> Current COVID-19 test positivity rate: 9.0% (13th lowest)

12. California
> New weekly COVID-19 hospital admissions, Sept. 17-23, 2023: 6.3 per 100,000 (2457 total)
> COVID-19 hospital admissions since Aug. 1, 2020: 1,574.4 per 100,000 (15th lowest)
> COVID-19 deaths since Jan. 2020: 279.9 per 100,000 (12th lowest)
> Current COVID-19 test positivity rate: 11.1% (17th highest)

11. South Dakota
> New weekly COVID-19 hospital admissions, Sept. 17-23, 2023: 6.4 per 100,000 (58 total)
> COVID-19 hospital admissions since Aug. 1, 2020: 2,124.3 per 100,000 (12th highest)
> COVID-19 deaths since Jan. 2020: 361.3 per 100,000 (24th highest)
> Current COVID-19 test positivity rate: 10.9% (21st highest)

10. Massachusetts
> New weekly COVID-19 hospital admissions, Sept. 17-23, 2023: 6.6 per 100,000 (463 total)
> COVID-19 hospital admissions since Aug. 1, 2020: 1,503.2 per 100,000 (13th lowest)
> COVID-19 deaths since Jan. 2020: 301.3 per 100,000 (17th lowest)
> Current COVID-19 test positivity rate: 9.7% (19th lowest)

9. Missouri
> New weekly COVID-19 hospital admissions, Sept. 17-23, 2023: 6.7 per 100,000 (414 total)
> COVID-19 hospital admissions since Aug. 1, 2020: 2,126.4 per 100,000 (11th highest)
> COVID-19 deaths since Jan. 2020: 364.9 per 100,000 (21st highest)
> Current COVID-19 test positivity rate: 15.0% (the highest)

8. New Hampshire
> New weekly COVID-19 hospital admissions, Sept. 17-23, 2023: 7.0 per 100,000 (97 total)
> COVID-19 hospital admissions since Aug. 1, 2020: 1,313.6 per 100,000 (6th lowest)
> COVID-19 deaths since Jan. 2020: 237.0 per 100,000 (7th lowest)
> Current COVID-19 test positivity rate: 9.7% (19th lowest)

7. Florida
> New weekly COVID-19 hospital admissions, Sept. 17-23, 2023: 7.1 per 100,000 (1588 total)
> COVID-19 hospital admissions since Aug. 1, 2020: 2,581.7 per 100,000 (4th highest)
> COVID-19 deaths since Jan. 2020: 361.4 per 100,000 (22nd highest)
> Current COVID-19 test positivity rate: 9.0% (13th lowest)

6. Arkansas
> New weekly COVID-19 hospital admissions, Sept. 17-23, 2023: 7.6 per 100,000 (231 total)
> COVID-19 hospital admissions since Aug. 1, 2020: 2,228.5 per 100,000 (7th highest)
> COVID-19 deaths since Jan. 2020: 413.5 per 100,000 (9th highest)
> Current COVID-19 test positivity rate: 10.4% (24th lowest)

5. New York
> New weekly COVID-19 hospital admissions, Sept. 17-23, 2023: 7.8 per 100,000 (1544 total)
> COVID-19 hospital admissions since Aug. 1, 2020: 1,927.4 per 100,000 (23rd highest)
> COVID-19 deaths since Jan. 2020: 413.6 per 100,000 (8th highest)
> Current COVID-19 test positivity rate: 13.2% (5th highest)

4. Connecticut
> New weekly COVID-19 hospital admissions, Sept. 17-23, 2023: 7.9 per 100,000 (287 total)
> COVID-19 hospital admissions since Aug. 1, 2020: 1,798.5 per 100,000 (20th lowest)
> COVID-19 deaths since Jan. 2020: 340.3 per 100,000 (22nd lowest)
> Current COVID-19 test positivity rate: 9.7% (19th lowest)

3. Hawaii
> New weekly COVID-19 hospital admissions, Sept. 17-23, 2023: 8.3 per 100,000 (120 total)
> COVID-19 hospital admissions since Aug. 1, 2020: 1,371.8 per 100,000 (8th lowest)
> COVID-19 deaths since Jan. 2020: 136.9 per 100,000 (the lowest)
> Current COVID-19 test positivity rate: 11.1% (17th highest)
2. West Virginia
> New weekly COVID-19 hospital admissions, Sept. 17-23, 2023: 9.6 per 100,000 (171 total)
> COVID-19 hospital admissions since Aug. 1, 2020: 2,405.4 per 100,000 (5th highest)
> COVID-19 deaths since Jan. 2020: 489.1 per 100,000 (2nd highest)
> Current COVID-19 test positivity rate: 7.6% (5th lowest)

1. Montana
> New weekly COVID-19 hospital admissions, Sept. 17-23, 2023: 10.2 per 100,000 (115 total)
> COVID-19 hospital admissions since Aug. 1, 2020: 2,696.7 per 100,000 (3rd highest)
> COVID-19 deaths since Jan. 2020: 345.2 per 100,000 (25th lowest)
> Current COVID-19 test positivity rate: 10.9% (21st highest)
