
Each day, at dinner tables and social functions across the country, millions of adults enjoy alcohol responsibly. Moderate drinking — defined as two standard drinks per day for men and one standard drink for women — carries relatively little risk, and may even have some health benefits. However, beyond this threshold, alcohol can only be detrimental.
Excessive drinking — along with tobacco use, inadequate exercise, and poor nutrition — is one of four main risk factors for preventable disease identified by the CDC. In addition to short-term consequences, such as impaired judgement and motor skills, excessive alcohol consumption is associated with liver disease, certain cancers, increased risk of a heart attack or stroke, and poor mental health. Here is a look at 23 ways a drinking habit can harm you.
Each year, alcohol abuse is directly linked to diseases and accidents that kill an estimated 95,000 Americans. Excessive drinking also costs the economy hundreds of billions of dollars annually, mostly in lost productivity.
Using data from County Health Rankings & Roadmaps, a joint program between the Robert Wood Johnson Foundation and the University of Wisconsin Population Health Institute, 24/7 Wall St. identified the U.S. metropolitan areas with the highest excessive drinking rates. In every metro area on this list, more than 22% of adults drink excessively, while nationwide, the excessive drinking rate is 19.2%
Metro areas are ranked on the share of adults who either binge drink or drink heavily. CHR defines binge drinking as consumption of more than four drinks in a single occasion for women and more than five drinks for men, while heavy drinking is defined as more than one drink a day on average for women and more than two drinks a day for men.
The majority of metro areas on this list are located in the Midwest — including 12 in Wisconsin alone.
It is important to note that alcohol affects everyone differently, and as a general rule, drinking less is better than drinking more. Additionally, the vast majority of Americans who drink excessively — about 90% of them — do not have a severe alcohol use disorder, a chronic disease commonly referred to as alcoholism.

50. Reno, NV
> Adults binge or heavy drinking: 22.3%
> Driving deaths involving alcohol: 38.9% — 23rd highest of 384 metros
> Median household income: $72,132 — 58th highest of 384 metros
> Adults reporting poor or fair health: 18.1% — 171st lowest of 384 metros
49. Buffalo-Cheektowaga, NY
> Adults binge or heavy drinking: 22.4%
> Driving deaths involving alcohol: 17.5% — 30th lowest of 384 metros
> Median household income: $60,105 — 187th highest of 384 metros
> Adults reporting poor or fair health: 16.8% — 125th lowest of 384 metros

48. Scranton–Wilkes-Barre, PA
> Adults binge or heavy drinking: 22.4%
> Driving deaths involving alcohol: 27.2% — 170th lowest of 384 metros
> Median household income: $54,304 — 115th lowest of 384 metros
> Adults reporting poor or fair health: 19.3% — 161st highest of 384 metros
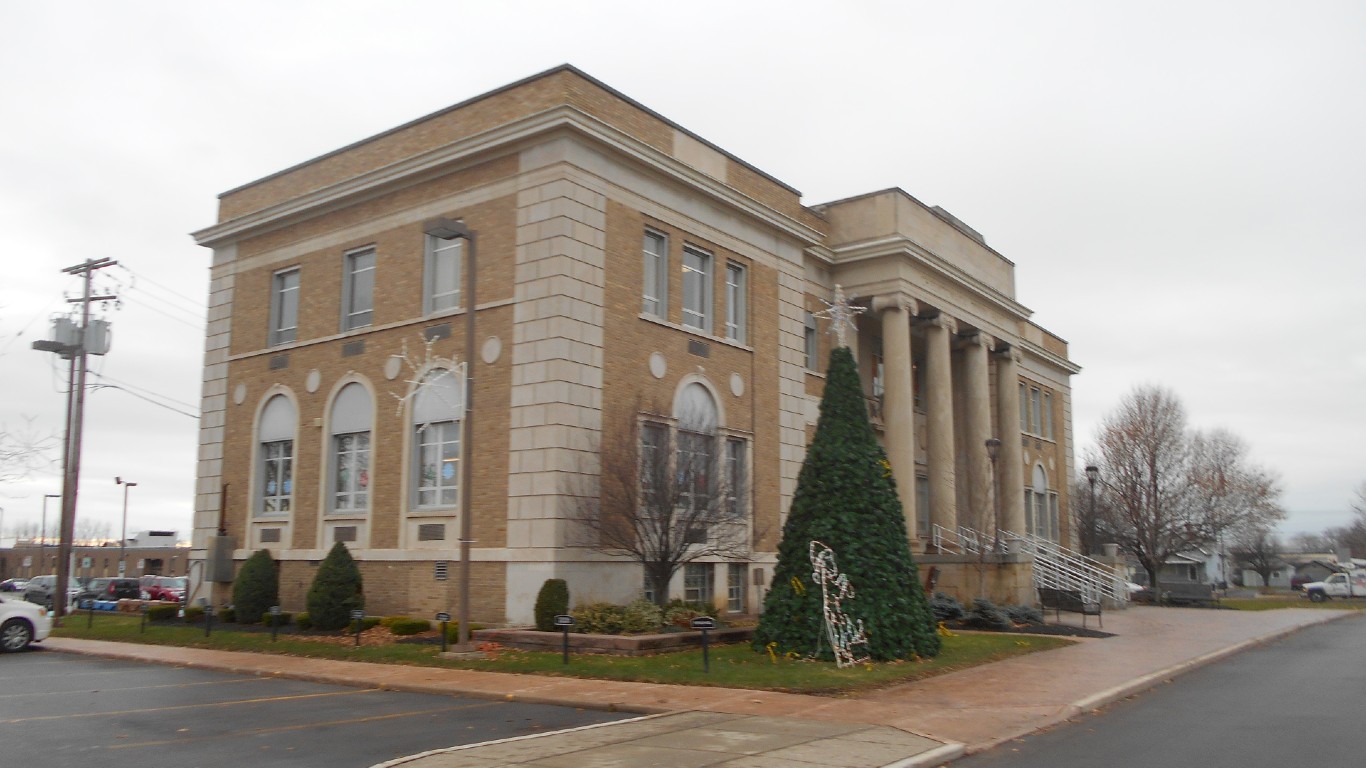
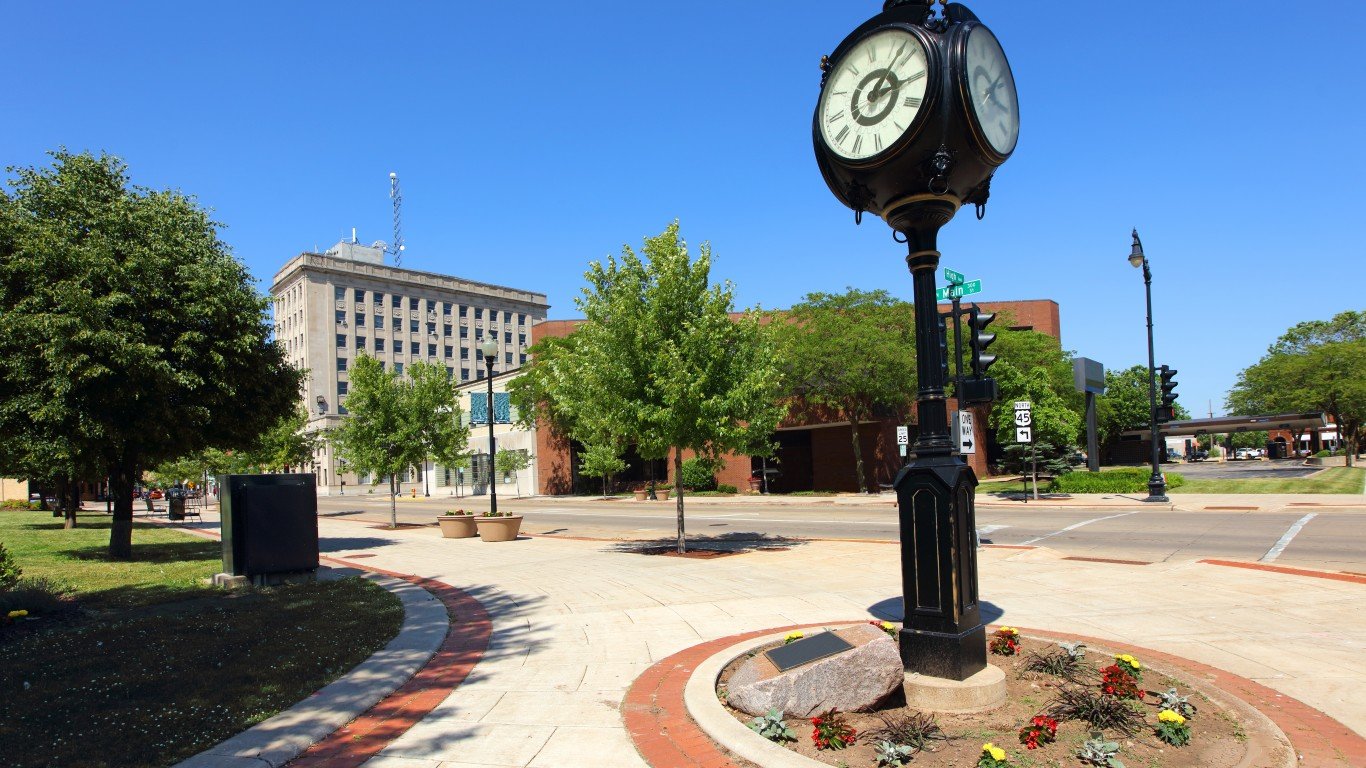
47. Bay City, MI
> Adults binge or heavy drinking: 22.4%
> Driving deaths involving alcohol: 34.0% — 74th highest of 384 metros
> Median household income: $49,610 — 53rd lowest of 384 metros
> Adults reporting poor or fair health: 19.2% — 168th highest of 384 metros
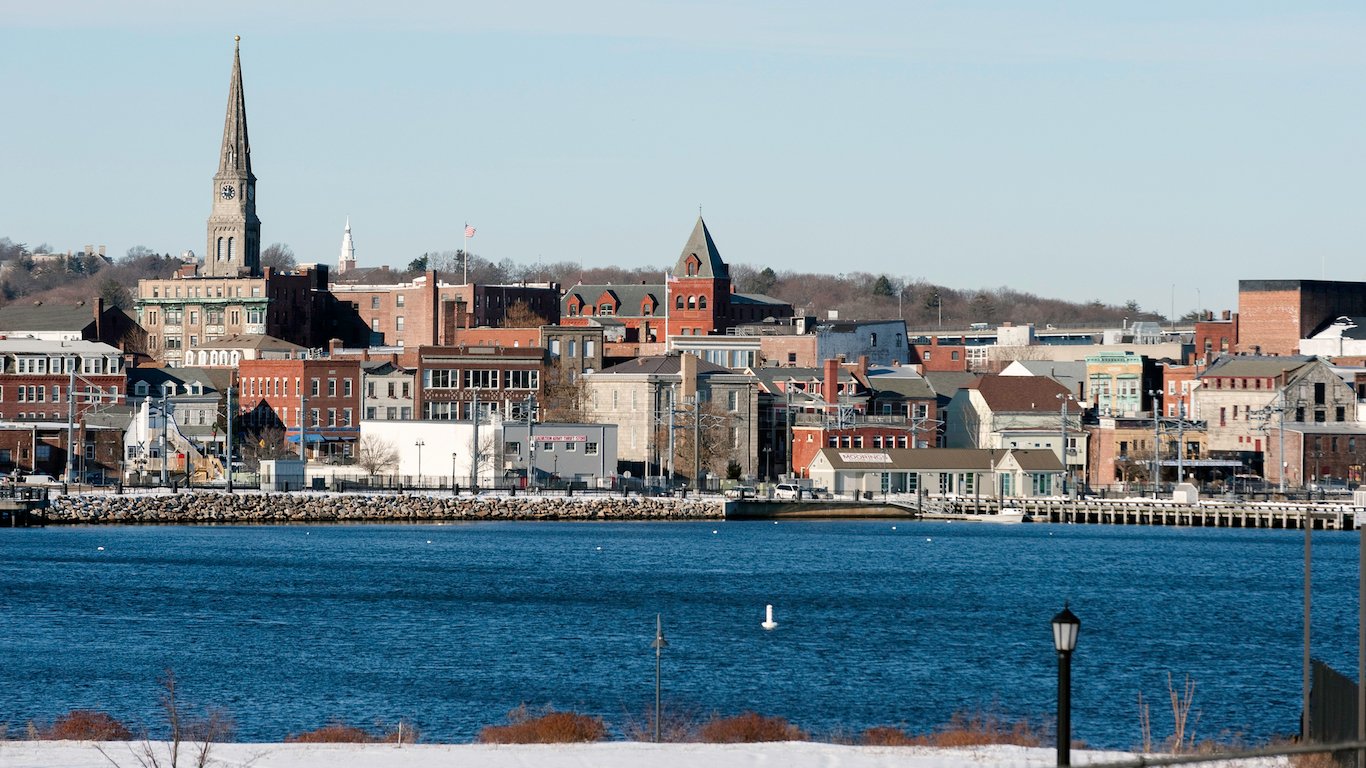
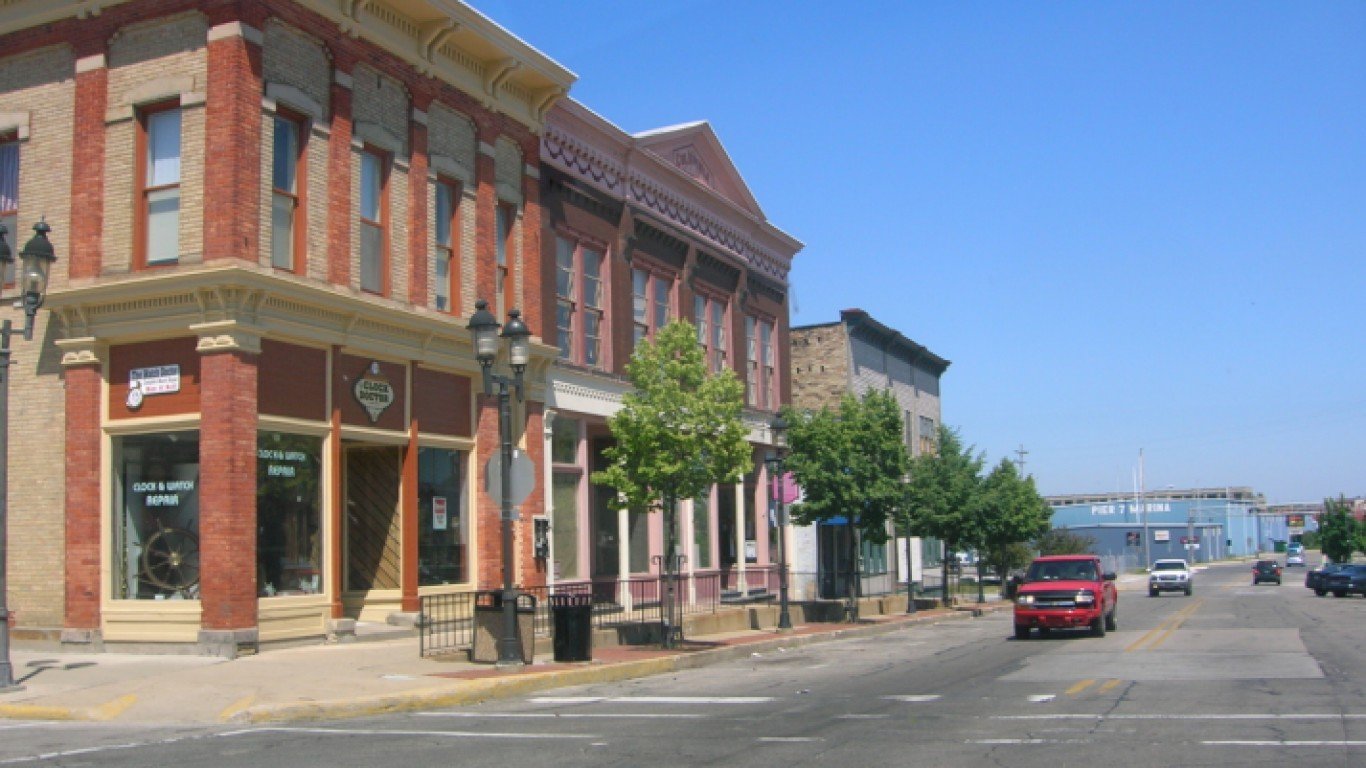
46. Norwich-New London, CT
> Adults binge or heavy drinking: 22.4%
> Driving deaths involving alcohol: 35.2% — 54th highest of 384 metros
> Median household income: $75,633 — 48th highest of 384 metros
> Adults reporting poor or fair health: 13.6% — 27th lowest of 384 metros
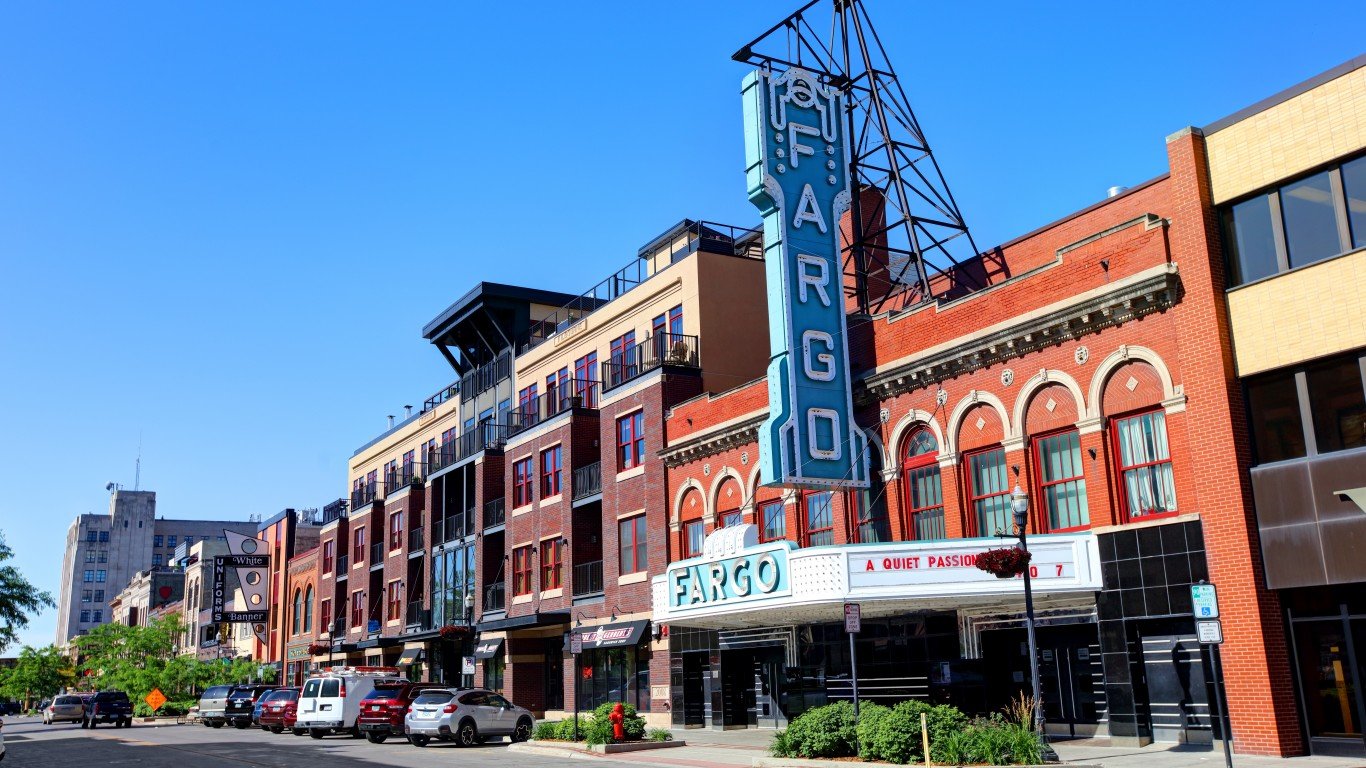
45. Fargo, ND-MN
> Adults binge or heavy drinking: 22.5%
> Driving deaths involving alcohol: 36.5% — 40th highest of 384 metros (tied)
> Median household income: $62,820 — 130th highest of 384 metros
> Adults reporting poor or fair health: 12.6% — 11th lowest of 384 metros
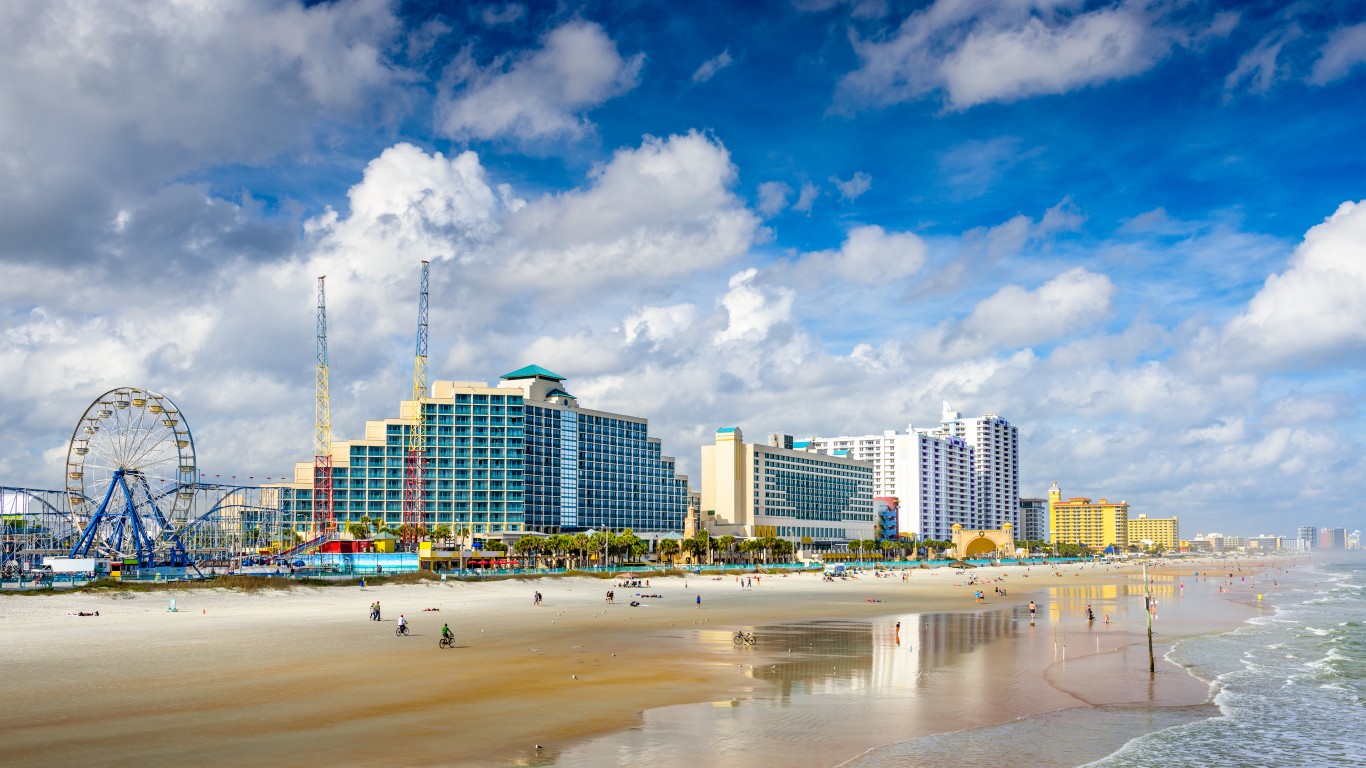
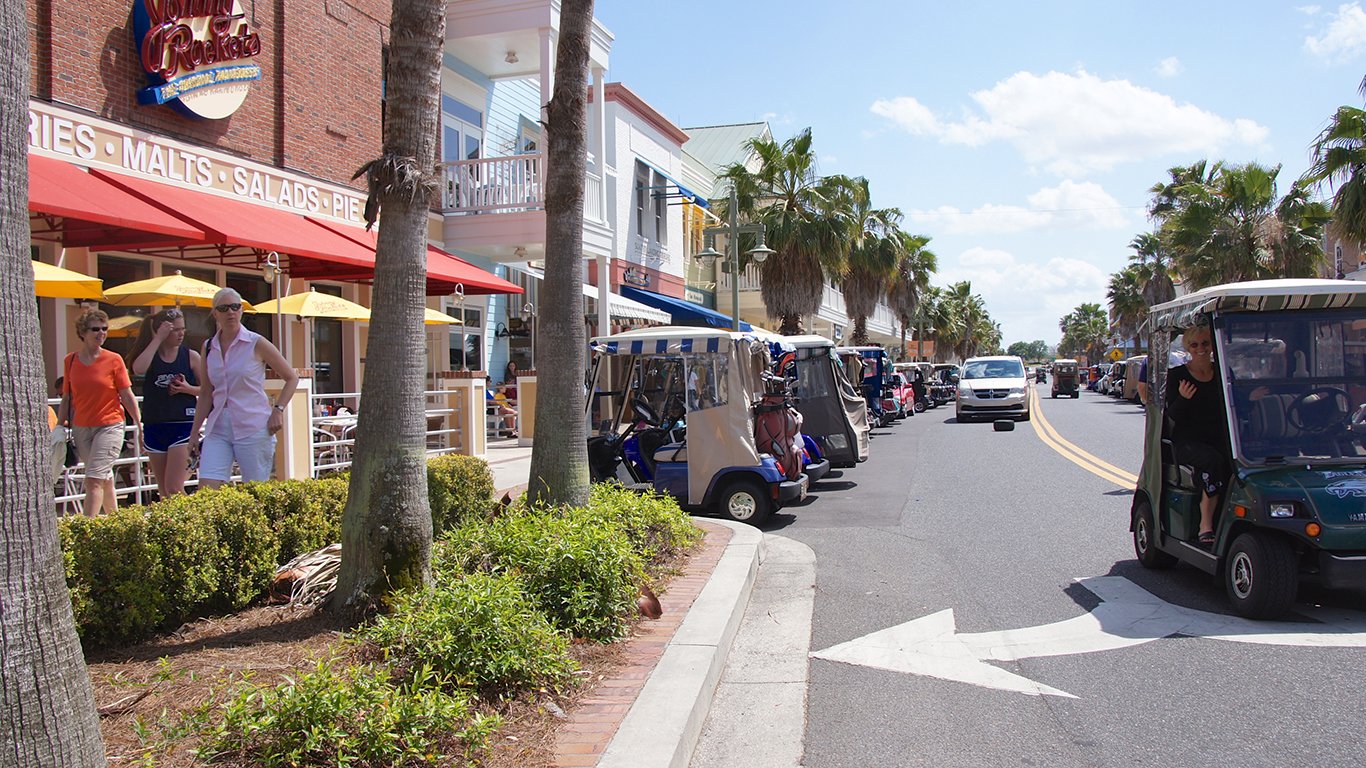
44. Deltona-Daytona Beach-Ormond Beach, FL
> Adults binge or heavy drinking: 22.5%
> Driving deaths involving alcohol: 22.2% — 74th lowest of 384 metros
> Median household income: $54,533 — 118th lowest of 384 metros
> Adults reporting poor or fair health: 19.1% — 172nd highest of 384 metros

43. Napa, CA
> Adults binge or heavy drinking: 22.6%
> Driving deaths involving alcohol: 39.7% — 20th highest of 384 metros
> Median household income: $92,769 — 7th highest of 384 metros
> Adults reporting poor or fair health: 15.9% — 85th lowest of 384 metros

42. Billings, MT
> Adults binge or heavy drinking: 22.7%
> Driving deaths involving alcohol: 37.0% — 35th highest of 384 metros
> Median household income: $60,962 — 166th highest of 384 metros
> Adults reporting poor or fair health: 14.5% — 47th lowest of 384 metros

41. Albany-Schenectady-Troy, NY
> Adults binge or heavy drinking: 22.7%
> Driving deaths involving alcohol: 24.1% — 103rd lowest of 384 metros
> Median household income: $73,398 — 54th highest of 384 metros
> Adults reporting poor or fair health: 14.2% — 39th lowest of 384 metros

40. Monroe, MI
> Adults binge or heavy drinking: 22.8%
> Driving deaths involving alcohol: 40.6% — 14th highest of 384 metros
> Median household income: $62,839 — 129th highest of 384 metros
> Adults reporting poor or fair health: 17.4% — 149th lowest of 384 metros

39. Springfield, MA
> Adults binge or heavy drinking: 22.8%
> Driving deaths involving alcohol: 31.1% — 124th highest of 384 metros (tied)
> Median household income: $62,346 — 140th highest of 384 metros
> Adults reporting poor or fair health: 17.6% — 152nd lowest of 384 metros

38. Minneapolis-St. Paul-Bloomington, MN-WI
> Adults binge or heavy drinking: 22.9%
> Driving deaths involving alcohol: 31.4% — 118th highest of 384 metros
> Median household income: $83,698 — 19th highest of 384 metros
> Adults reporting poor or fair health: 12.0% — 6th lowest of 384 metros

37. Rapid City, SD
> Adults binge or heavy drinking: 23.0%
> Driving deaths involving alcohol: 34.3% — 70th highest of 384 metros
> Median household income: $58,361 — 179th lowest of 384 metros
> Adults reporting poor or fair health: 14.2% — 40th lowest of 384 metros

36. Kahului-Wailuku-Lahaina, HI
> Adults binge or heavy drinking: 23.0%
> Driving deaths involving alcohol: 49.0% — 3rd highest of 384 metros
> Median household income: $80,754 — 25th highest of 384 metros
> Adults reporting poor or fair health: 14.7% — 49th lowest of 384 metros

35. Sioux Falls, SD
> Adults binge or heavy drinking: 23.1%
> Driving deaths involving alcohol: 27.4% — 172nd lowest of 384 metros
> Median household income: $65,566 — 106th highest of 384 metros
> Adults reporting poor or fair health: 12.3% — 8th lowest of 384 metros
34. The Villages, FL
> Adults binge or heavy drinking: 23.1%
> Driving deaths involving alcohol: 13.1% — 10th lowest of 384 metros
> Median household income: $60,287 — 184th highest of 384 metros
> Adults reporting poor or fair health: 16.6% — 108th lowest of 384 metros

33. Fort Collins, CO
> Adults binge or heavy drinking: 23.2%
> Driving deaths involving alcohol: 32.6% — 92nd highest of 384 metros
> Median household income: $75,186 — 51st highest of 384 metros
> Adults reporting poor or fair health: 11.2% — 2nd lowest of 384 metros

32. Cape Coral-Fort Myers, FL
> Adults binge or heavy drinking: 23.2%
> Driving deaths involving alcohol: 24.4% — 106th lowest of 384 metros
> Median household income: $62,240 — 141st highest of 384 metros
> Adults reporting poor or fair health: 19.5% — 149th highest of 384 metros
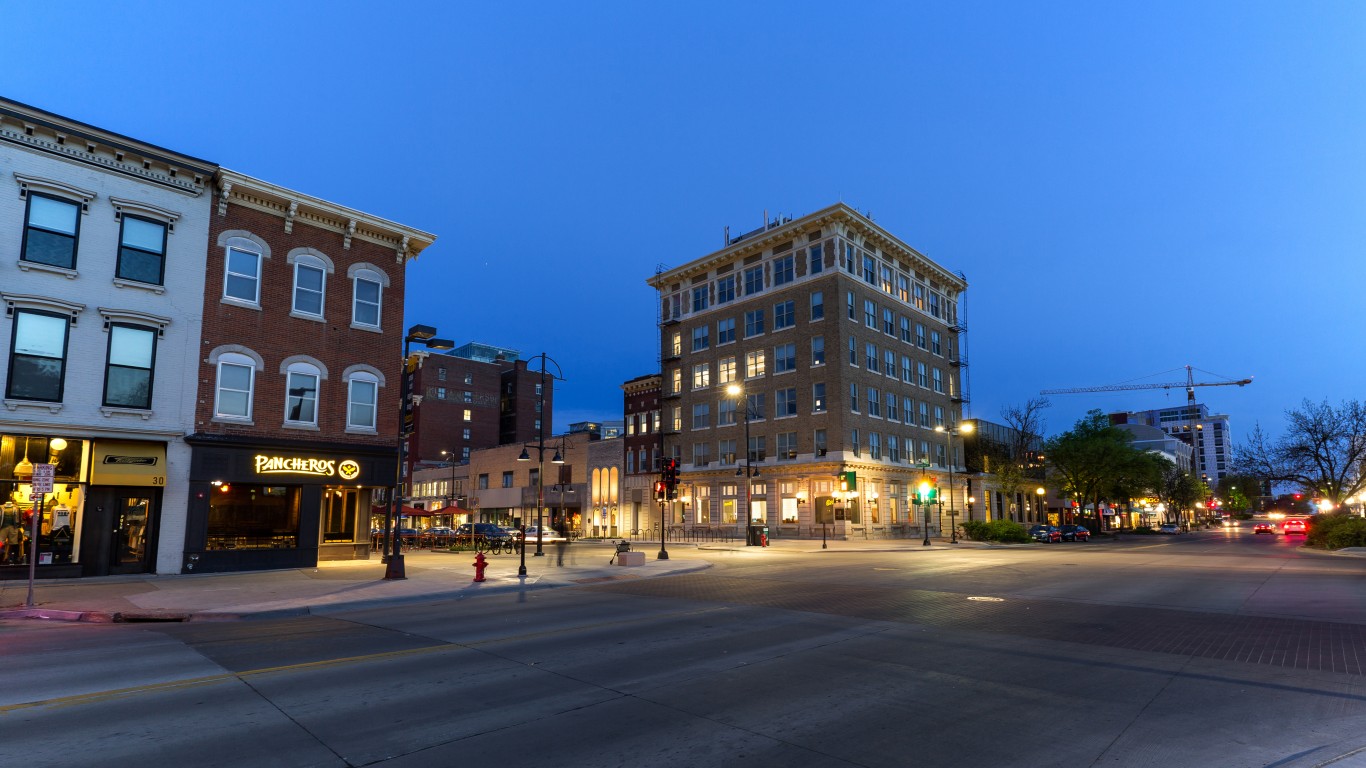
31. Iowa City, IA
> Adults binge or heavy drinking: 23.3%
> Driving deaths involving alcohol: 25.9% — 136th lowest of 384 metros
> Median household income: $63,761 — 119th highest of 384 metros
> Adults reporting poor or fair health: 12.9% — 14th lowest of 384 metros

30. Boston-Cambridge-Newton, MA-NH
> Adults binge or heavy drinking: 23.3%
> Driving deaths involving alcohol: 29.7% — 161st highest of 384 metros
> Median household income: $94,430 — 5th highest of 384 metros
> Adults reporting poor or fair health: 13.3% — 22nd lowest of 384 metros

29. Cedar Rapids, IA
> Adults binge or heavy drinking: 23.4%
> Driving deaths involving alcohol: 18.3% — 38th lowest of 384 metros
> Median household income: $64,088 — 116th highest of 384 metros
> Adults reporting poor or fair health: 13.2% — 18th lowest of 384 metros

28. Missoula, MT
> Adults binge or heavy drinking: 23.5%
> Driving deaths involving alcohol: 36.2% — 44th highest of 384 metros
> Median household income: $57,347 — 162nd lowest of 384 metros
> Adults reporting poor or fair health: 13.2% — 20th lowest of 384 metros
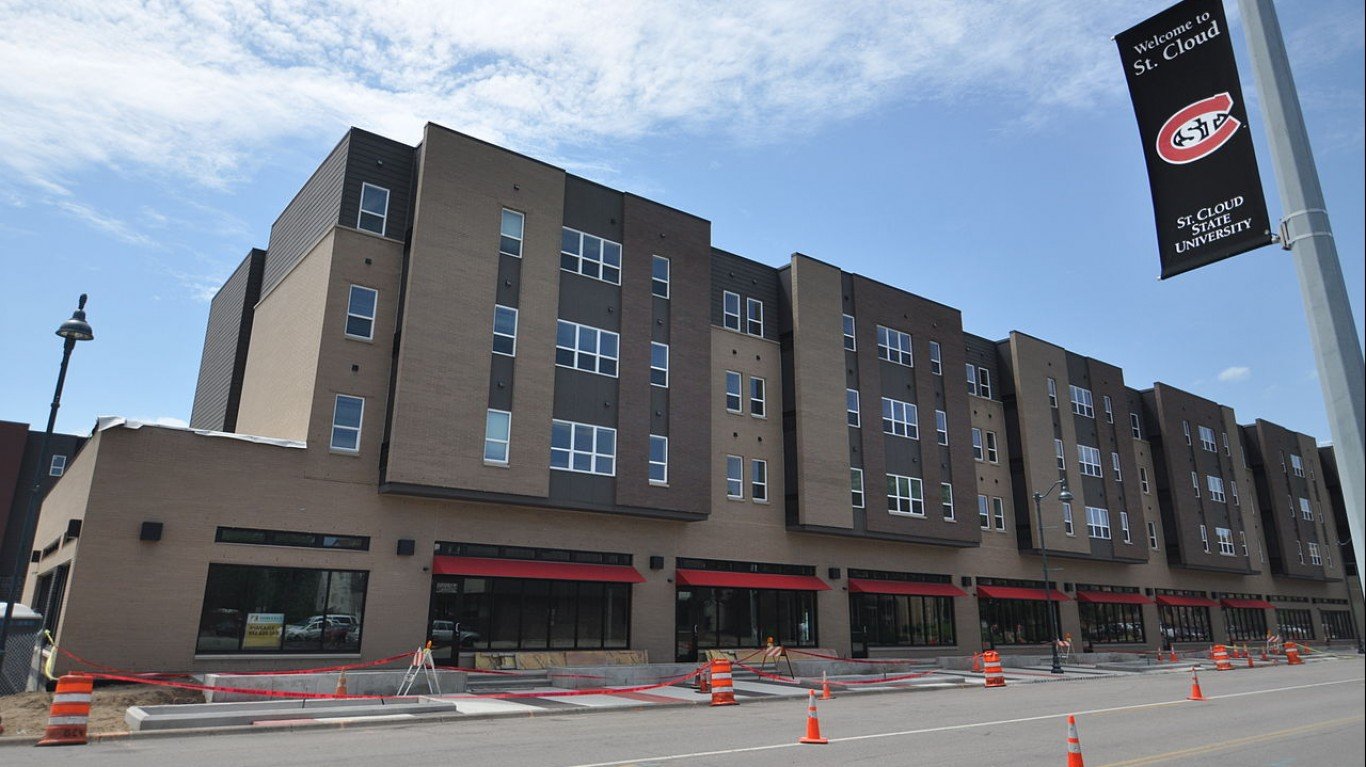
27. St. Cloud, MN
> Adults binge or heavy drinking: 23.5%
> Driving deaths involving alcohol: 28.6% — 185th highest of 384 metros (tied)
> Median household income: $66,076 — 101st highest of 384 metros
> Adults reporting poor or fair health: 13.6% — 26th lowest of 384 metros

26. Santa Rosa-Petaluma, CA
> Adults binge or heavy drinking: 23.6%
> Driving deaths involving alcohol: 32.7% — 91st highest of 384 metros
> Median household income: $87,828 — 12th highest of 384 metros
> Adults reporting poor or fair health: 15.1% — 60th lowest of 384 metros
25. Ames, IA
> Adults binge or heavy drinking: 23.7%
> Driving deaths involving alcohol: 20.0% — 54th lowest of 384 metros
> Median household income: $62,181 — 143rd highest of 384 metros
> Adults reporting poor or fair health: 12.8% — 13th lowest of 384 metros
24. Omaha-Council Bluffs, NE-IA
> Adults binge or heavy drinking: 23.9%
> Driving deaths involving alcohol: 32.9% — 89th highest of 384 metros
> Median household income: $70,373 — 72nd highest of 384 metros
> Adults reporting poor or fair health: 14.0% — 35th lowest of 384 metros

23. Hilton Head Island-Bluffton, SC
> Adults binge or heavy drinking: 24.1%
> Driving deaths involving alcohol: 26.7% — 159th lowest of 384 metros
> Median household income: $71,252 — 63rd highest of 384 metros
> Adults reporting poor or fair health: 15.7% — 79th lowest of 384 metros
22. Portland-South Portland, ME
> Adults binge or heavy drinking: 24.2%
> Driving deaths involving alcohol: 30.4% — 146th highest of 384 metros (tied)
> Median household income: $71,913 — 60th highest of 384 metros
> Adults reporting poor or fair health: 13.2% — 19th lowest of 384 metros
21. North Port-Sarasota-Bradenton, FL
> Adults binge or heavy drinking: 24.4%
> Driving deaths involving alcohol: 26.4% — 147th lowest of 384 metros
> Median household income: $65,526 — 107th highest of 384 metros
> Adults reporting poor or fair health: 16.8% — 118th lowest of 384 metros
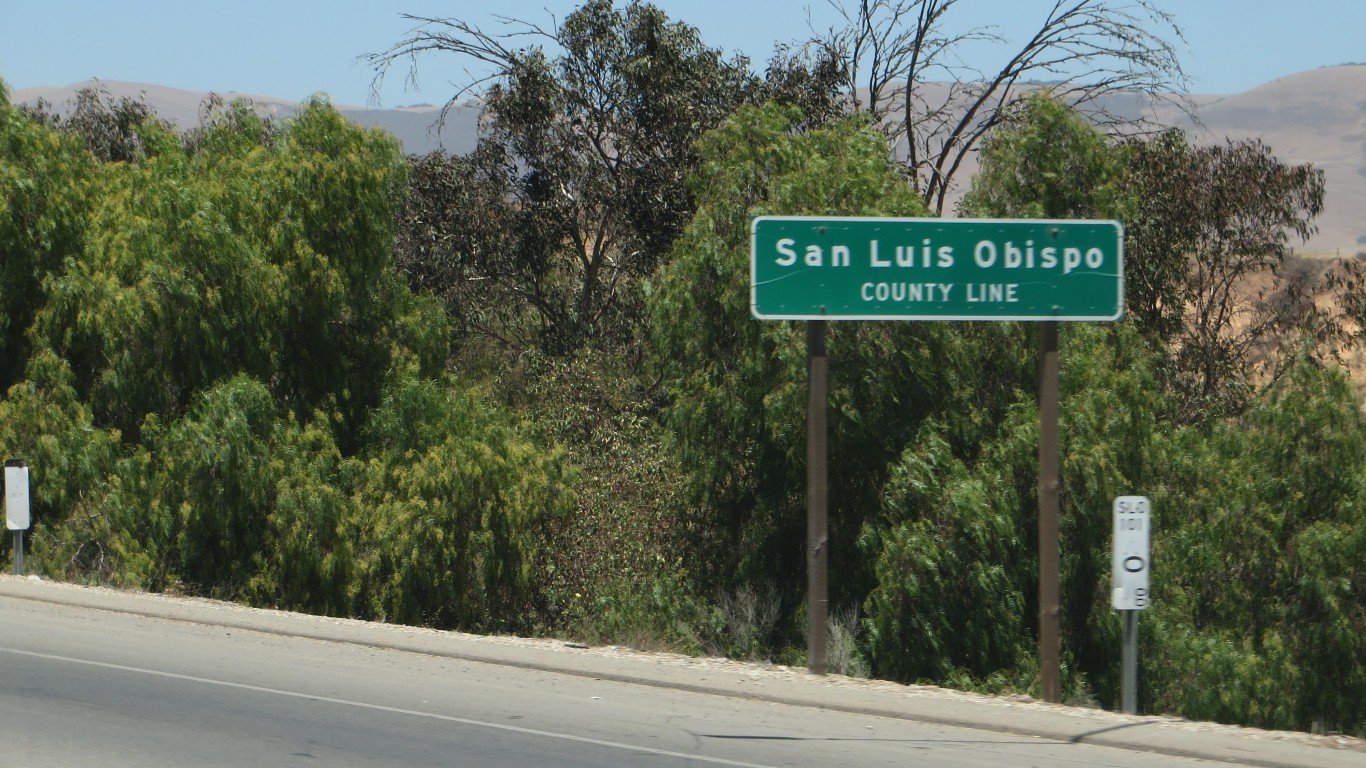
20. San Luis Obispo-Paso Robles, CA
> Adults binge or heavy drinking: 24.4%
> Driving deaths involving alcohol: 40.5% — 17th highest of 384 metros
> Median household income: $77,265 — 38th highest of 384 metros
> Adults reporting poor or fair health: 15.2% — 64th lowest of 384 metros

19. Des Moines-West Des Moines, IA
> Adults binge or heavy drinking: 24.7%
> Driving deaths involving alcohol: 35.0% — 61st highest of 384 metros
> Median household income: $71,164 — 64th highest of 384 metros
> Adults reporting poor or fair health: 13.0% — 16th lowest of 384 metros

18. Janesville-Beloit, WI
> Adults binge or heavy drinking: 25.1%
> Driving deaths involving alcohol: 42.1% — 8th highest of 384 metros
> Median household income: $61,243 — 159th highest of 384 metros
> Adults reporting poor or fair health: 16.9% — 128th lowest of 384 metros

17. Racine, WI
> Adults binge or heavy drinking: 25.2%
> Driving deaths involving alcohol: 36.4% — 43rd highest of 384 metros
> Median household income: $60,779 — 170th highest of 384 metros
> Adults reporting poor or fair health: 16.4% — 105th lowest of 384 metros

16. Duluth, MN-WI
> Adults binge or heavy drinking: 25.2%
> Driving deaths involving alcohol: 34.5% — 67th highest of 384 metros
> Median household income: $60,316 — 183rd highest of 384 metros
> Adults reporting poor or fair health: 14.3% — 42nd lowest of 384 metros

15. Lincoln, NE
> Adults binge or heavy drinking: 25.3%
> Driving deaths involving alcohol: 29.4% — 169th highest of 384 metros
> Median household income: $61,539 — 151st highest of 384 metros
> Adults reporting poor or fair health: 12.5% — 10th lowest of 384 metros

14. Milwaukee-Waukesha, WI
> Adults binge or heavy drinking: 25.4%
> Driving deaths involving alcohol: 30.5% — 141st highest of 384 metros
> Median household income: $65,845 — 103rd highest of 384 metros
> Adults reporting poor or fair health: 16.4% — 102nd lowest of 384 metros
13. Eau Claire, WI
> Adults binge or heavy drinking: 25.9%
> Driving deaths involving alcohol: 37.7% — 28th highest of 384 metros
> Median household income: $63,460 — 123rd highest of 384 metros
> Adults reporting poor or fair health: 14.9% — 54th lowest of 384 metros

12. Wausau-Weston, WI
> Adults binge or heavy drinking: 26.1%
> Driving deaths involving alcohol: 17.2% — 25th lowest of 384 metros (tied)
> Median household income: $65,094 — 110th highest of 384 metros
> Adults reporting poor or fair health: 14.3% — 41st lowest of 384 metros

11. Pittsfield, MA
> Adults binge or heavy drinking: 26.4%
> Driving deaths involving alcohol: 27.7% — 176th lowest of 384 metros
> Median household income: $58,895 — 187th lowest of 384 metros
> Adults reporting poor or fair health: 15.1% — 59th lowest of 384 metros
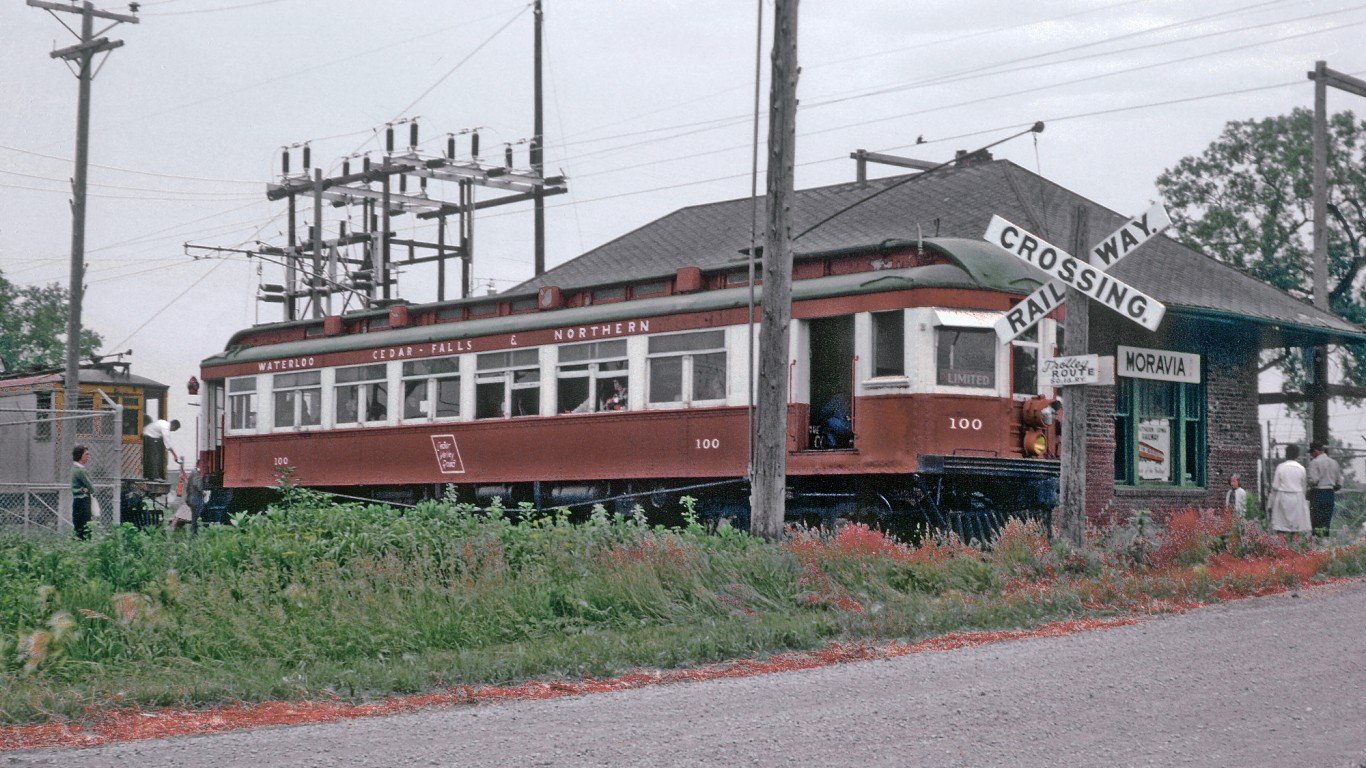
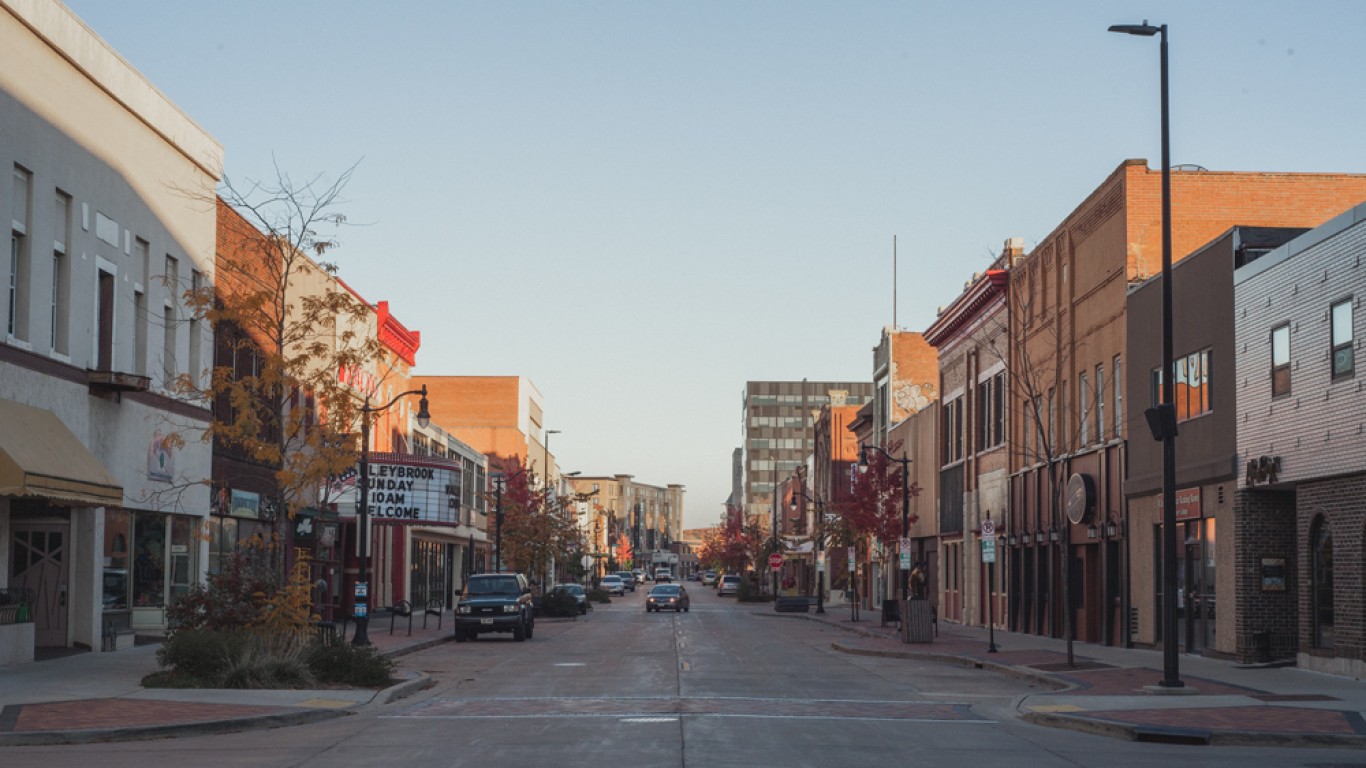
10. Waterloo-Cedar Falls, IA
> Adults binge or heavy drinking: 26.4%
> Driving deaths involving alcohol: 18.2% — 36th lowest of 384 metros
> Median household income: $63,131 — 125th highest of 384 metros
> Adults reporting poor or fair health: 14.0% — 31st lowest of 384 metros
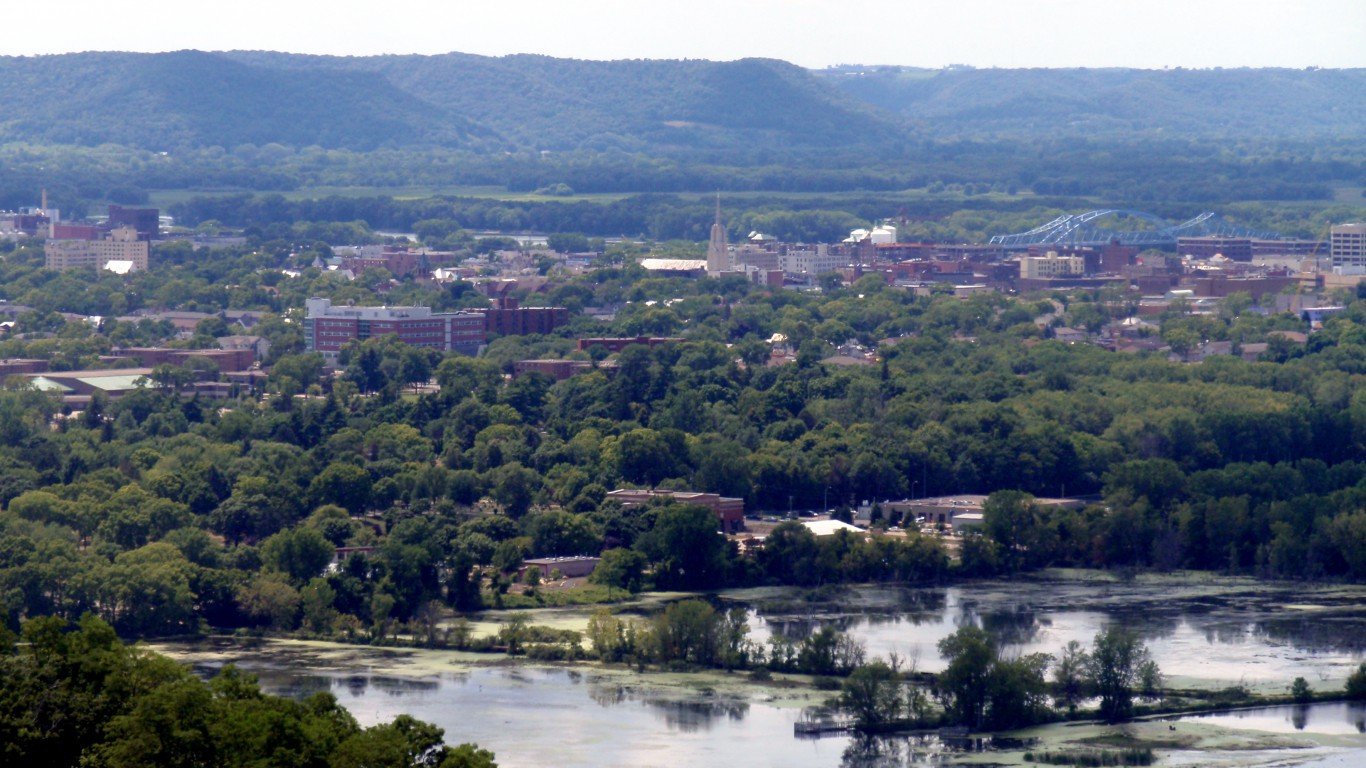
9. La Crosse-Onalaska, WI-MN
> Adults binge or heavy drinking: 26.4%
> Driving deaths involving alcohol: 26.0% — 139th lowest of 384 metros
> Median household income: $59,608 — 192nd highest of 384 metros
> Adults reporting poor or fair health: 13.8% — 30th lowest of 384 metros

8. Barnstable Town, MA
> Adults binge or heavy drinking: 26.5%
> Driving deaths involving alcohol: 37.3% — 34th highest of 384 metros
> Median household income: $85,042 — 17th highest of 384 metros
> Adults reporting poor or fair health: 12.7% — 12th lowest of 384 metros
7. Fond du Lac, WI
> Adults binge or heavy drinking: 26.5%
> Driving deaths involving alcohol: 31.6% — 112th highest of 384 metros
> Median household income: $65,329 — 108th highest of 384 metros
> Adults reporting poor or fair health: 14.6% — 48th lowest of 384 metros

6. Madison, WI
> Adults binge or heavy drinking: 27.6%
> Driving deaths involving alcohol: 31.7% — 109th highest of 384 metros
> Median household income: $75,545 — 49th highest of 384 metros
> Adults reporting poor or fair health: 12.5% — 9th lowest of 384 metros
5. Oshkosh-Neenah, WI
> Adults binge or heavy drinking: 27.6%
> Driving deaths involving alcohol: 31.4% — 120th highest of 384 metros
> Median household income: $58,347 — 178th lowest of 384 metros
> Adults reporting poor or fair health: 15.2% — 61st lowest of 384 metros

4. Green Bay, WI
> Adults binge or heavy drinking: 27.8%
> Driving deaths involving alcohol: 42.9% — 7th highest of 384 metros
> Median household income: $65,026 — 112th highest of 384 metros
> Adults reporting poor or fair health: 15.0% — 55th lowest of 384 metros

3. Sheboygan, WI
> Adults binge or heavy drinking: 27.9%
> Driving deaths involving alcohol: 31.5% — 115th highest of 384 metros (tied)
> Median household income: $60,706 — 173rd highest of 384 metros (tied)
> Adults reporting poor or fair health: 14.5% — 45th lowest of 384 metros

2. Dubuque, IA
> Adults binge or heavy drinking: 28.1%
> Driving deaths involving alcohol: 15.6% — 16th lowest of 384 metros (tied)
> Median household income: $62,178 — 144th highest of 384 metros
> Adults reporting poor or fair health: 13.0% — 15th lowest of 384 metros

1. Appleton, WI
> Adults binge or heavy drinking: 30.8%
> Driving deaths involving alcohol: 31.1% — 124th highest of 384 metros (tied)
> Median household income: $68,335 — 84th highest of 384 metros
> Adults reporting poor or fair health: 13.5% — 25th lowest of 384 metros
Methodology
To determine America’s drunkest metros, 24/7 Wall St. reviewed rates of excessive drinking from the Robert Wood Johnson Foundation and the University of Wisconsin Population Health Institute joint program’s 2021 County Health Rankings & Roadmaps report.
The rate of excessive drinking is defined as the share of adults who report either binge drinking or heavy drinking in the past 30 days. Binge drinking is defined as a woman consuming more than four drinks or a man consuming more than five drinks in a single occasion. Heavy drinking is defined as a woman consuming more than one drink per day on average or a man consuming more than two drinks per day on average.
We aggregated county-level statistics to metropolitan statistical areas. While the CHR report is from 2021, excessive drinking rate figures published in the report are from 2018.
We used the 384 metropolitan statistical areas as delineated by the United States Office of Management and Budget and used by the Census Bureau as our definition of metros.
Metros were ranked based on the excessive drinking rate. Additional information on the share of driving deaths with alcohol involvement and the share of adults that report fair or poor health are also from the 2021 CHR. Median household income data are one-year estimates from the U.S. Census Bureau’s 2019 American Community Survey.