How much alcohol can we drink without risking a negative impact on our well-being? Absolutely none, according to the World Health Organization, which declared in January of 2023 that “when it comes to alcohol consumption, there is no safe amount that does not affect health.”
While there are many apologists for moderate alcohol use, citing its social and gastronomic values (theories that it has cardiac benefits have been largely debunked), it has been scientifically proven that ethanol — the stuff that gives beer, wine, cider, and spirits their kick — can increase the risk of high blood pressure, liver and kidney disease, heart disease and stroke, and dementia, among other conditions. It is also known to weaken the immune system, leaving the body more susceptible to infections of many kinds.
Above all, to quote the WHO, alcohol “is a toxic, psychoactive, and dependence-producing substance and has been classified as a Group 1 carcinogen by the International Agency for Research on Cancer decades ago….” This puts it in the same category as asbestos, tobacco, and radiation.
According to the Centers for Disease Control and Prevention, between 2020 and 2021, more than 178,000 lives were claimed in the U.S. alone by alcohol-related causes, including not only disease but also alcohol poisoning and auto accidents. This represents an increase of 29% over the period from 2016 to 2017.
COVID-19 is considered to be largely to blame for increased drinking, and by extension increased deaths from alcohol. Stress and boredom during the pandemic were contributing factors, and also alcohol became easier to obtain, with restaurants in many places offering it with take-out food or meal delivery. (Read about these famous people whose lives were consumed by alcohol.)
To discover the U.S. counties where drinking deaths have risen the most dramatically, 24/7 Tempo reviewed data from the CDC, ranking counties on the percentage change in the annual number of alcohol-related deaths per 100,000 residents from 2018 to 2021.
Some 25 states are represented on this list of 50 counties. The state with the most counties listed — six — is Texas. South Carolina, Michigan, and Arizona come next with four each, followed by Ohio, North Carolina, Georgia, and Colorado, with three apiece. The county with the highest percentage of alcohol-related deaths during the period covered, however, is picturesque Yellowstone County, Montana.
Methodology
To determine the counties where drinking deaths have risen the most dramatically, 24/7 Tempo reviewed data on chronic and acute alcohol-related deaths from the Centers for Disease Control and Prevention. Counties were ranked based on the percentage change in the annual number of alcohol-related deaths per 100,000 residents from 2018 to 2021. Alcohol-related deaths include alcoholic psychosis, alcohol abuse, alcohol dependence syndrome, alcohol polyneuropathy, degeneration of nervous system due to alcohol, alcoholic myopathy, alcohol cardiomyopathy, alcoholic gastritis, alcoholic liver disease, alcohol-induced acute pancreatitis, alcohol-induced chronic pancreatitis, fetal alcohol syndrome, fetus and newborn affected by maternal use of alcohol, alcohol poisoning, and suicide by and exposure to alcohol. Only cities with at least 15 alcohol deaths in 2018 were included. Supplemental data on median household income are from the U.S. Census Bureau’s 2022 American Community Survey and are five-year estimates.
Scroll down to see the counties where drinking deaths have risen dramatically:
50. Clark County, OH
- Increase in alcohol-related deaths per capita, 2018 to 2021:80.9%
- Alcohol-related deaths in 2021: 22.9 per 100,000 residents (31 total)
- Alcohol-related deaths in 2018: 12.6 per 100,000 residents (17 total)
- Median household income: $58,954
- County seat: Springfield
49. York County, PA

- Increase in alcohol-related deaths per capita, 2018 to 2021:81.5%
- Alcohol-related deaths in 2021: 11.3 per 100,000 residents (52 total)
- Alcohol-related deaths in 2018: 6.2 per 100,000 residents (28 total)
- Median household income: $79,183
- County seat: York
48. Washtenaw County, MI

- Increase in alcohol-related deaths per capita, 2018 to 2021:82.6%
- Alcohol-related deaths in 2021: 10.8 per 100,000 residents (40 total)
- Alcohol-related deaths in 2018: 5.9 per 100,000 residents (22 total)
- Median household income: $84,245
- County seat: Ann Arbor
47. Prince George’s County, MD

- Increase in alcohol-related deaths per capita, 2018 to 2021:84.2%
- Alcohol-related deaths in 2021: 9.3 per 100,000 residents (89 total)
- Alcohol-related deaths in 2018: 5.1 per 100,000 residents (46 total)
- Median household income: $97,935
- County seat: Upper Marlboro
46. Linn County, IA

- Increase in alcohol-related deaths per capita, 2018 to 2021:85.0%
- Alcohol-related deaths in 2021: 13.1 per 100,000 residents (30 total)
- Alcohol-related deaths in 2018: 7.1 per 100,000 residents (16 total)
- Median household income: $75,457
- County seat: Cedar Rapids
45. McLennan County, TX

- Increase in alcohol-related deaths per capita, 2018 to 2021:85.5%
- Alcohol-related deaths in 2021: 17.5 per 100,000 residents (46 total)
- Alcohol-related deaths in 2018: 9.4 per 100,000 residents (24 total)
- Median household income: $59,781
- County seat: Waco
44. Cumberland County, NC

- Increase in alcohol-related deaths per capita, 2018 to 2021:87.5%
- Alcohol-related deaths in 2021: 15.8 per 100,000 residents (53 total)
- Alcohol-related deaths in 2018: 8.4 per 100,000 residents (28 total)
- Median household income: $55,551
- County seat: Fayetteville
43. Montgomery County, TX

- Increase in alcohol-related deaths per capita, 2018 to 2021:87.8%
- Alcohol-related deaths in 2021: 10.2 per 100,000 residents (66 total)
- Alcohol-related deaths in 2018: 5.4 per 100,000 residents (32 total)
- Median household income: $95,946
- County seat: Conroe
42. Suffolk County, MA
- Increase in alcohol-related deaths per capita, 2018 to 2021:88.4%
- Alcohol-related deaths in 2021: 10.5 per 100,000 residents (81 total)
- Alcohol-related deaths in 2018: 5.6 per 100,000 residents (45 total)
- Median household income: $87,669
- County seat: Boston
41. Summit County, OH

- Increase in alcohol-related deaths per capita, 2018 to 2021:88.7%
- Alcohol-related deaths in 2021: 16.4 per 100,000 residents (88 total)
- Alcohol-related deaths in 2018: 8.7 per 100,000 residents (47 total)
- Median household income: $68,360
- County seat: Akron
40. Oakland County, MI

- Increase in alcohol-related deaths per capita, 2018 to 2021:90.5%
- Alcohol-related deaths in 2021: 13.5 per 100,000 residents (171 total)
- Alcohol-related deaths in 2018: 7.1 per 100,000 residents (89 total)
- Median household income: $92,620
- County seat: Pontiac
39. Nueces County, TX

- Increase in alcohol-related deaths per capita, 2018 to 2021:90.5%
- Alcohol-related deaths in 2021: 18.4 per 100,000 residents (65 total)
- Alcohol-related deaths in 2018: 9.7 per 100,000 residents (35 total)
- Median household income: $64,027
- County seat: Corpus Christi
38. Lubbock County, TX

- Increase in alcohol-related deaths per capita, 2018 to 2021:91.3%
- Alcohol-related deaths in 2021: 14.3 per 100,000 residents (45 total)
- Alcohol-related deaths in 2018: 7.5 per 100,000 residents (23 total)
- Median household income: $61,911
- County seat: Lubbock
37. Fairbanks North Star Borough, AK

- Increase in alcohol-related deaths per capita, 2018 to 2021:91.5%
- Alcohol-related deaths in 2021: 38.7 per 100,000 residents (37 total)
- Alcohol-related deaths in 2018: 20.2 per 100,000 residents (20 total)
- Median household income: $81,655
- County seat: Fairbanks
36. Sandoval County, NM

- Increase in alcohol-related deaths per capita, 2018 to 2021:91.8%
- Alcohol-related deaths in 2021: 46.2 per 100,000 residents (70 total)
- Alcohol-related deaths in 2018: 24.1 per 100,000 residents (35 total)
- Median household income: $76,424
- County seat: Bernalillo
35. Navajo County, AZ

- Increase in alcohol-related deaths per capita, 2018 to 2021:93.4%
- Alcohol-related deaths in 2021: 115.6 per 100,000 residents (125 total)
- Alcohol-related deaths in 2018: 59.8 per 100,000 residents (66 total)
- Median household income: $50,335
- County seat: Holbrook
34. Pinal County, AZ
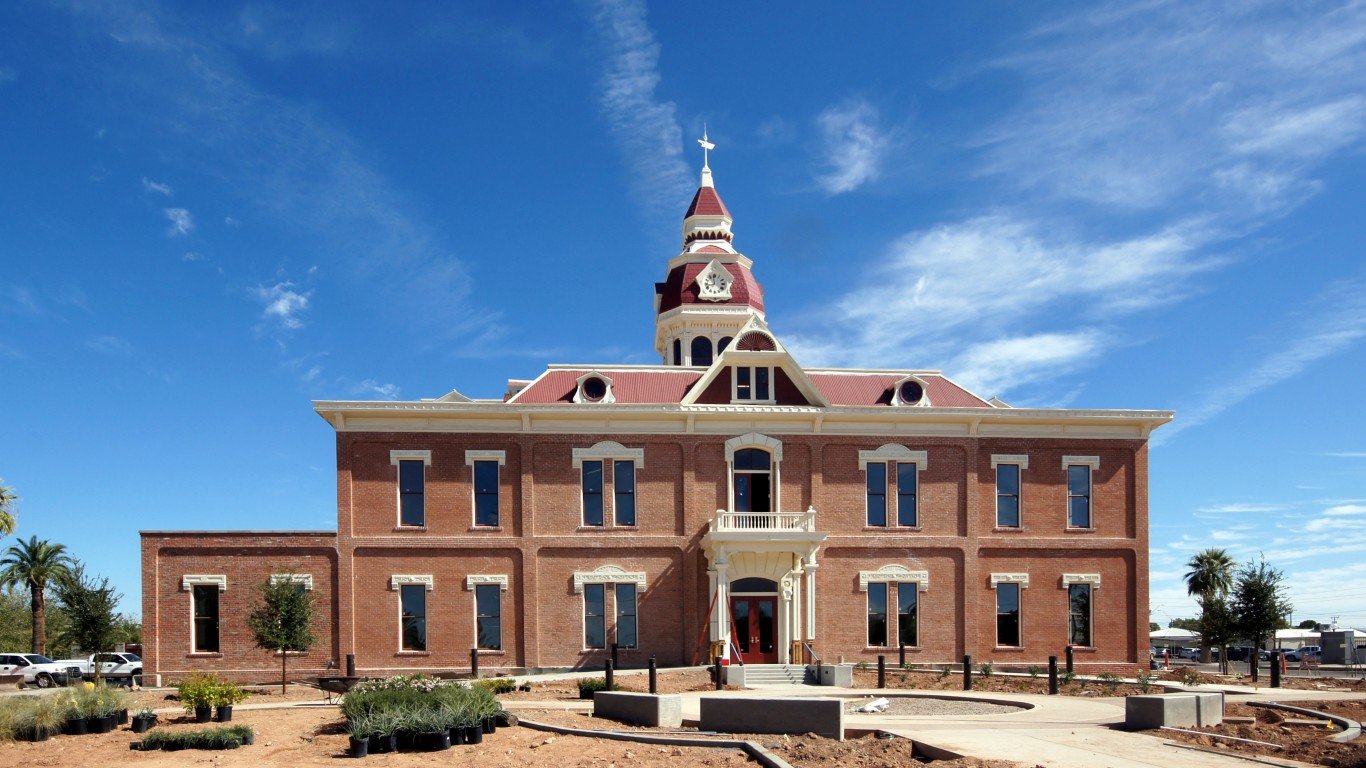
- Increase in alcohol-related deaths per capita, 2018 to 2021:94.2%
- Alcohol-related deaths in 2021: 18.2 per 100,000 residents (82 total)
- Alcohol-related deaths in 2018: 9.4 per 100,000 residents (42 total)
- Median household income: $73,313
- County seat: Florence
33. Baldwin County, AL

- Increase in alcohol-related deaths per capita, 2018 to 2021:95.2%
- Alcohol-related deaths in 2021: 18.8 per 100,000 residents (45 total)
- Alcohol-related deaths in 2018: 9.6 per 100,000 residents (21 total)
- Median household income: $71,039
- County seat: Bay Minette
32. Fayette County, KY

- Increase in alcohol-related deaths per capita, 2018 to 2021:98.0%
- Alcohol-related deaths in 2021: 19.0 per 100,000 residents (61 total)
- Alcohol-related deaths in 2018: 9.6 per 100,000 residents (31 total)
- Median household income: $66,087
- County seat: Lexington
31. Gwinnett County, GA

- Increase in alcohol-related deaths per capita, 2018 to 2021:99.5%
- Alcohol-related deaths in 2021: 5.8 per 100,000 residents (56 total)
- Alcohol-related deaths in 2018: 2.9 per 100,000 residents (27 total)
- Median household income: $82,296
- County seat: Lawrenceville
30. Laramie County, WY

- Increase in alcohol-related deaths per capita, 2018 to 2021:100.7%
- Alcohol-related deaths in 2021: 44.6 per 100,000 residents (45 total)
- Alcohol-related deaths in 2018: 22.2 per 100,000 residents (22 total)
- Median household income: $76,282
- County seat: Cheyenne
29. Adams County, CO

- Increase in alcohol-related deaths per capita, 2018 to 2021:101.0%
- Alcohol-related deaths in 2021: 31.4 per 100,000 residents (164 total)
- Alcohol-related deaths in 2018: 15.6 per 100,000 residents (80 total)
- Median household income: $86,297
- County seat: Brighton
28. Weld County, CO
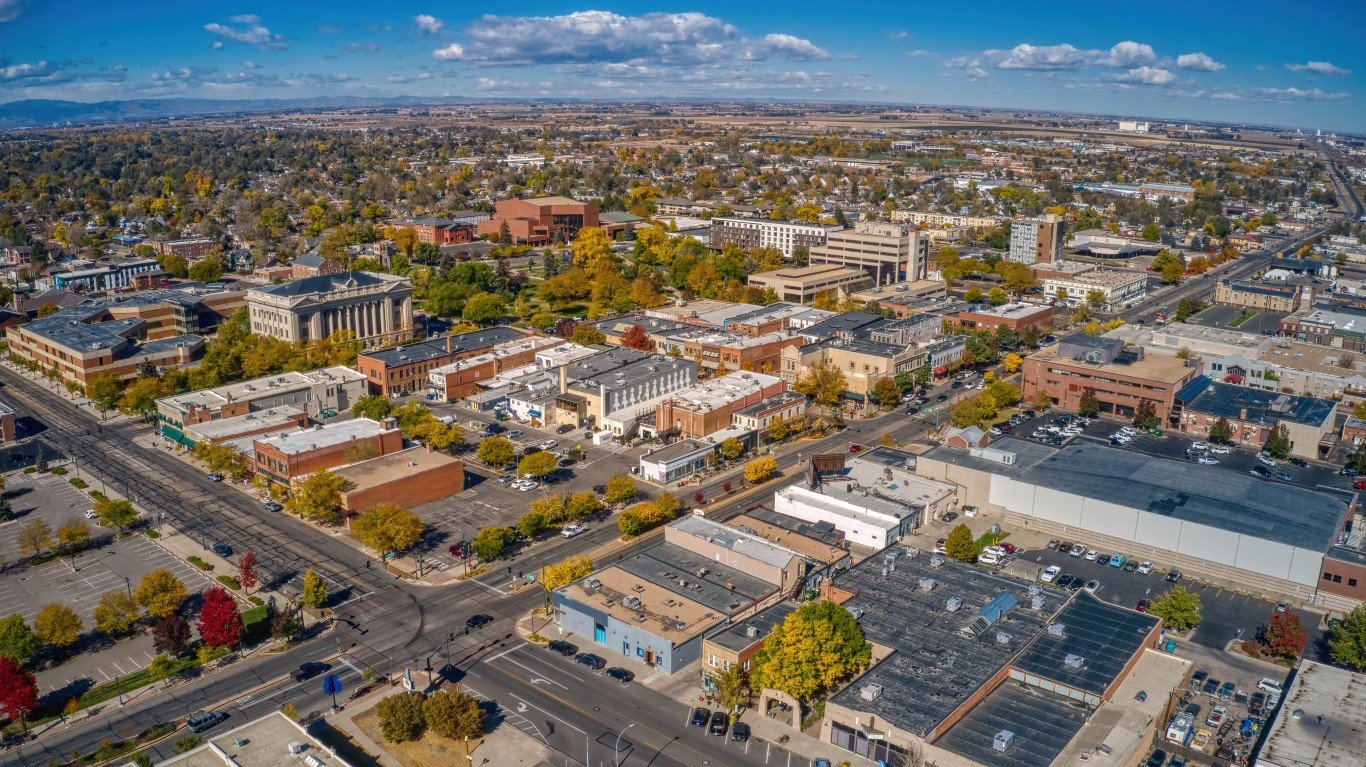
- Increase in alcohol-related deaths per capita, 2018 to 2021:101.3%
- Alcohol-related deaths in 2021: 28.8 per 100,000 residents (98 total)
- Alcohol-related deaths in 2018: 14.3 per 100,000 residents (45 total)
- Median household income: $89,182
- County seat: Greeley
27. Beaufort County, SC

- Increase in alcohol-related deaths per capita, 2018 to 2021:101.3%
- Alcohol-related deaths in 2021: 23.5 per 100,000 residents (45 total)
- Alcohol-related deaths in 2018: 11.7 per 100,000 residents (22 total)
- Median household income: $81,260
- County seat: Beaufort
26. Chatham County, GA

- Increase in alcohol-related deaths per capita, 2018 to 2021:102.7%
- Alcohol-related deaths in 2021: 18.2 per 100,000 residents (54 total)
- Alcohol-related deaths in 2018: 9.0 per 100,000 residents (26 total)
- Median household income: $66,171
- County seat: Savannah
25. Trumbull County, OH
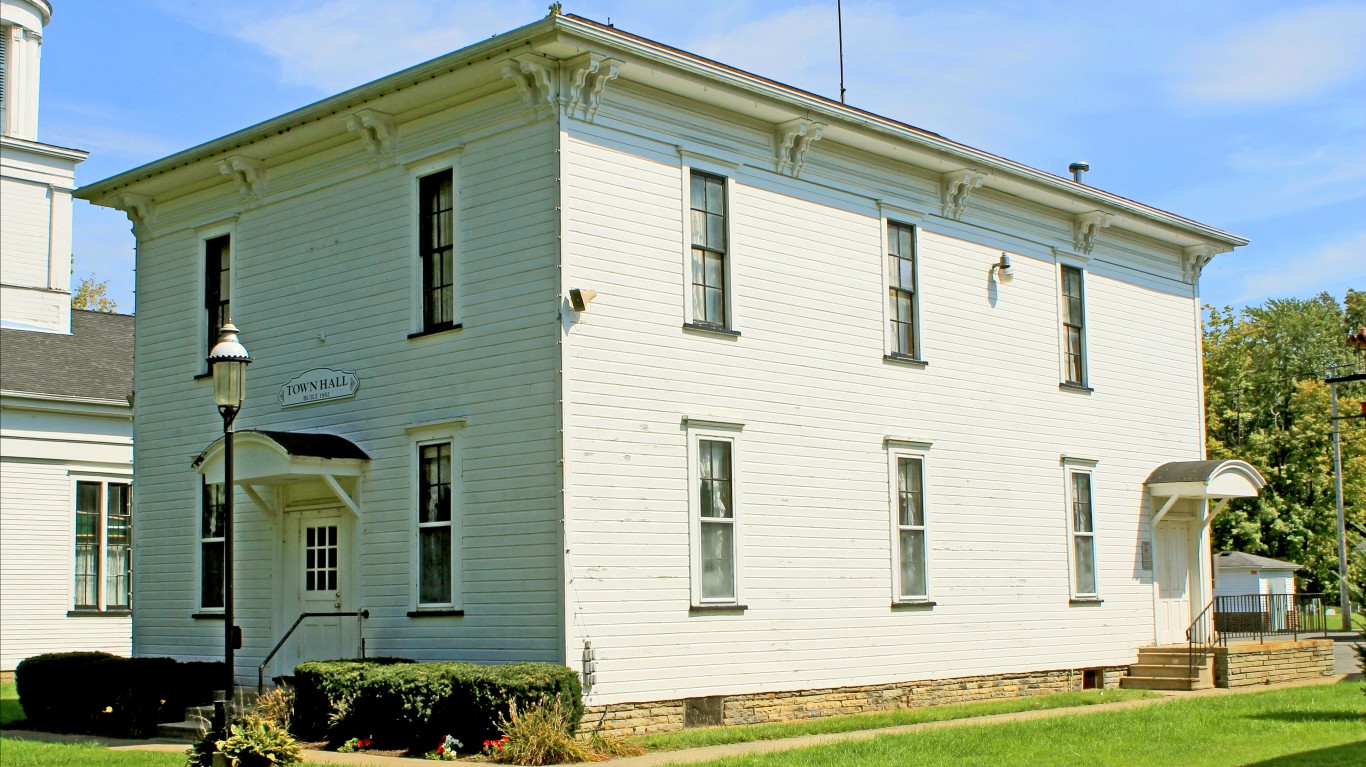
- Increase in alcohol-related deaths per capita, 2018 to 2021:103.1%
- Alcohol-related deaths in 2021: 17.4 per 100,000 residents (35 total)
- Alcohol-related deaths in 2018: 8.6 per 100,000 residents (17 total)
- Median household income: $53,537
- County seat: Warren
24. Pennington County, SD

- Increase in alcohol-related deaths per capita, 2018 to 2021:103.7%
- Alcohol-related deaths in 2021: 47.4 per 100,000 residents (53 total)
- Alcohol-related deaths in 2018: 23.3 per 100,000 residents (26 total)
- Median household income: $67,823
- County seat: Rapid City
23. Fort Bend County, TX

- Increase in alcohol-related deaths per capita, 2018 to 2021:104.4%
- Alcohol-related deaths in 2021: 5.7 per 100,000 residents (49 total)
- Alcohol-related deaths in 2018: 2.8 per 100,000 residents (22 total)
- Median household income: $109,987
- County seat: Richmond
22. Madison County, IL
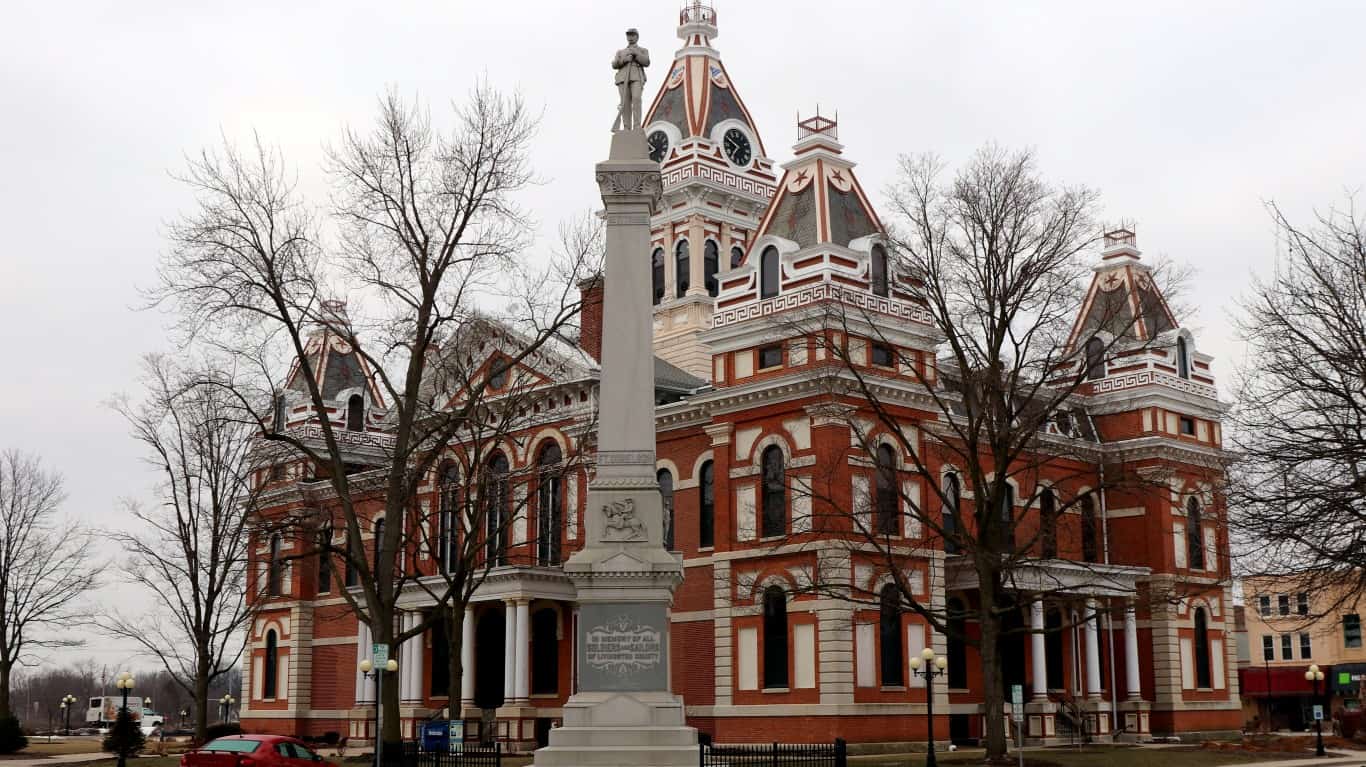
- Increase in alcohol-related deaths per capita, 2018 to 2021:106.2%
- Alcohol-related deaths in 2021: 12.5 per 100,000 residents (33 total)
- Alcohol-related deaths in 2018: 6.1 per 100,000 residents (16 total)
- Median household income: $71,759
- County seat: Edwardsville
21. Seminole County, FL

- Increase in alcohol-related deaths per capita, 2018 to 2021:107.0%
- Alcohol-related deaths in 2021: 11.1 per 100,000 residents (52 total)
- Alcohol-related deaths in 2018: 5.3 per 100,000 residents (25 total)
- Median household income: $79,490
- County seat: Sanford
20. Guilford County, NC

- Increase in alcohol-related deaths per capita, 2018 to 2021:107.4%
- Alcohol-related deaths in 2021: 14.4 per 100,000 residents (78 total)
- Alcohol-related deaths in 2018: 6.9 per 100,000 residents (37 total)
- Median household income: $62,880
- County seat: Greensboro
19. Outagamie County, WI

- Increase in alcohol-related deaths per capita, 2018 to 2021:107.9%
- Alcohol-related deaths in 2021: 17.8 per 100,000 residents (34 total)
- Alcohol-related deaths in 2018: 8.5 per 100,000 residents (16 total)
- Median household income: $78,705
- County seat: Appleton
18. Kitsap County, WA

- Increase in alcohol-related deaths per capita, 2018 to 2021:112.1%
- Alcohol-related deaths in 2021: 25.2 per 100,000 residents (69 total)
- Alcohol-related deaths in 2018: 11.9 per 100,000 residents (32 total)
- Median household income: $93,675
- County seat: Port Orchard
17. Richland County, SC

- Increase in alcohol-related deaths per capita, 2018 to 2021:118.0%
- Alcohol-related deaths in 2021: 15.8 per 100,000 residents (66 total)
- Alcohol-related deaths in 2018: 7.2 per 100,000 residents (30 total)
- Median household income: $59,850
- County seat: Columbia
16. Spartanburg County, SC

- Increase in alcohol-related deaths per capita, 2018 to 2021:123.7%
- Alcohol-related deaths in 2021: 23.5 per 100,000 residents (79 total)
- Alcohol-related deaths in 2018: 10.5 per 100,000 residents (33 total)
- Median household income: $61,955
- County seat: Spartanburg
15. Forsyth County, NC

- Increase in alcohol-related deaths per capita, 2018 to 2021:125.3%
- Alcohol-related deaths in 2021: 14.3 per 100,000 residents (55 total)
- Alcohol-related deaths in 2018: 6.3 per 100,000 residents (24 total)
- Median household income: $61,229
- County seat: Winston-Salem
14. Greenville County, SC

- Increase in alcohol-related deaths per capita, 2018 to 2021:128.0%
- Alcohol-related deaths in 2021: 13.3 per 100,000 residents (71 total)
- Alcohol-related deaths in 2018: 5.8 per 100,000 residents (30 total)
- Median household income: $71,328
- County seat: Greenville
13. Benton County, WA

- Increase in alcohol-related deaths per capita, 2018 to 2021:131.8%
- Alcohol-related deaths in 2021: 19.5 per 100,000 residents (41 total)
- Alcohol-related deaths in 2018: 8.4 per 100,000 residents (17 total)
- Median household income: $83,778
- County seat: Prosser
12. Norfolk city, VA

- Increase in alcohol-related deaths per capita, 2018 to 2021:132.1%
- Alcohol-related deaths in 2021: 16.2 per 100,000 residents (38 total)
- Alcohol-related deaths in 2018: 7.0 per 100,000 residents (17 total)
- Median household income: $60,998
- County seat: Norfolk
11. Apache County, AZ

- Increase in alcohol-related deaths per capita, 2018 to 2021:132.9%
- Alcohol-related deaths in 2021: 152.4 per 100,000 residents (100 total)
- Alcohol-related deaths in 2018: 65.4 per 100,000 residents (47 total)
- Median household income: $37,483
- County seat: St. Johns
10. Genesee County, MI
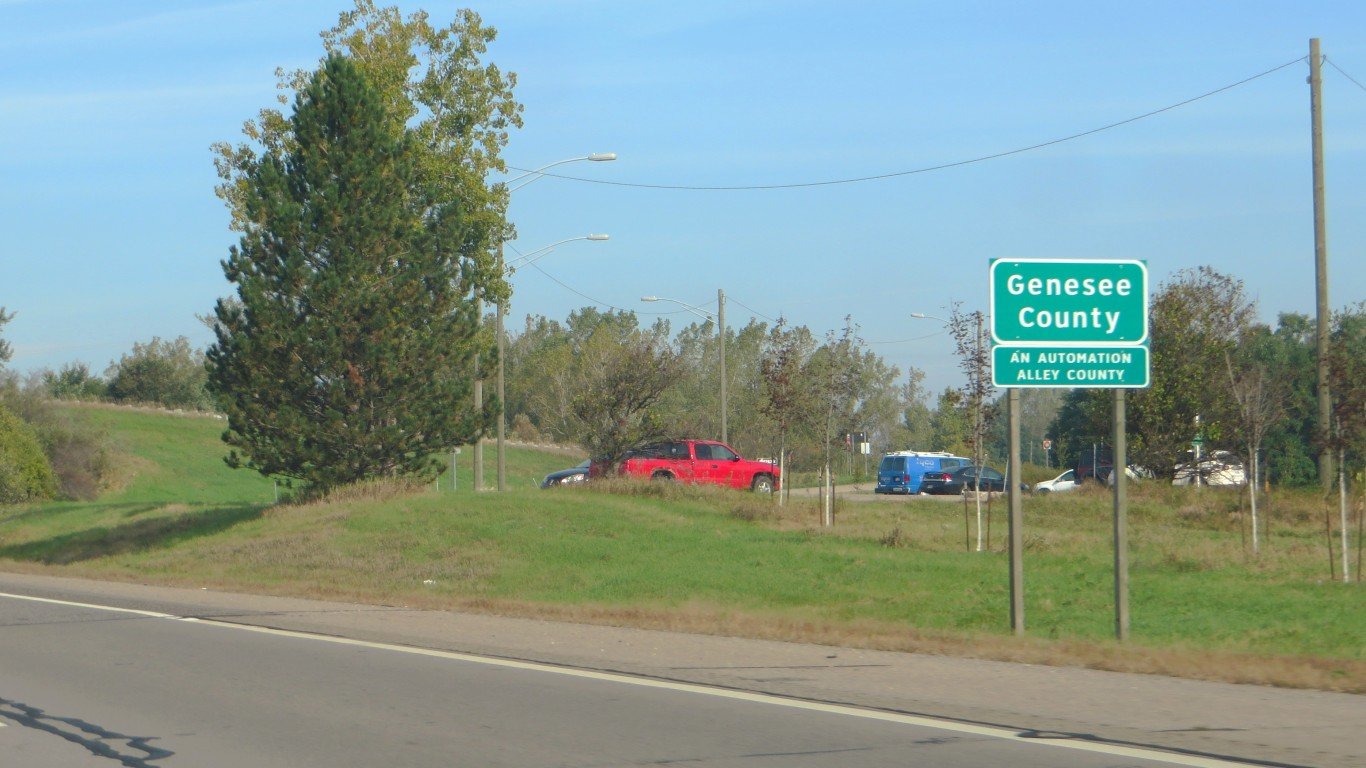
- Increase in alcohol-related deaths per capita, 2018 to 2021:134.9%
- Alcohol-related deaths in 2021: 20.8 per 100,000 residents (84 total)
- Alcohol-related deaths in 2018: 8.8 per 100,000 residents (36 total)
- Median household income: $58,594
- County seat: Flint
9. Linn County, OR
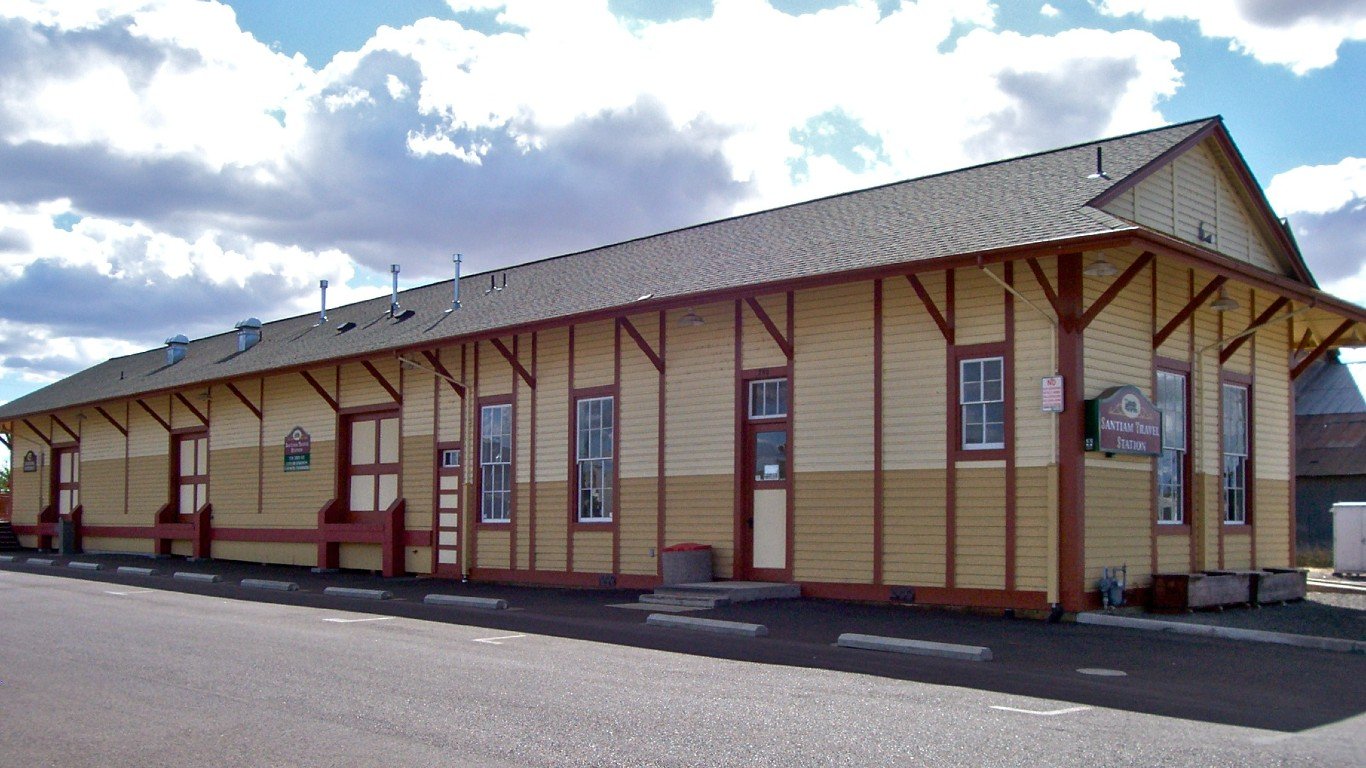
- Increase in alcohol-related deaths per capita, 2018 to 2021:135.4%
- Alcohol-related deaths in 2021: 37.0 per 100,000 residents (48 total)
- Alcohol-related deaths in 2018: 15.7 per 100,000 residents (20 total)
- Median household income: $69,523
- County seat: Albany
8. Boulder County, CO

- Increase in alcohol-related deaths per capita, 2018 to 2021:139.4%
- Alcohol-related deaths in 2021: 22.8 per 100,000 residents (75 total)
- Alcohol-related deaths in 2018: 9.5 per 100,000 residents (31 total)
- Median household income: $99,770
- County seat: Boulder
7. Montgomery County, PA

- Increase in alcohol-related deaths per capita, 2018 to 2021:140.7%
- Alcohol-related deaths in 2021: 8.7 per 100,000 residents (75 total)
- Alcohol-related deaths in 2018: 3.6 per 100,000 residents (30 total)
- Median household income: $107,441
- County seat: Norristown
6. Madison County, AL

- Increase in alcohol-related deaths per capita, 2018 to 2021:142.9%
- Alcohol-related deaths in 2021: 13.9 per 100,000 residents (55 total)
- Alcohol-related deaths in 2018: 5.7 per 100,000 residents (21 total)
- Median household income: $78,058
- County seat: Huntsville
5. Mohave County, AZ

- Increase in alcohol-related deaths per capita, 2018 to 2021: 146.0%
- Alcohol-related deaths in 2021: 52.8 per 100,000 residents (115 total)
- Alcohol-related deaths in 2018: 21.5 per 100,000 residents (45 total)
- Median household income: $53,592
- County seat: Kingman
4. Denton County, TX

- Increase in alcohol-related deaths per capita, 2018 to 2021:153.4%
- Alcohol-related deaths in 2021: 8.0 per 100,000 residents (75 total)
- Alcohol-related deaths in 2018: 3.1 per 100,000 residents (27 total)
- Median household income: $104,180
- County seat: Denton
3. Ingham County, MI

- Increase in alcohol-related deaths per capita, 2018 to 2021:155.4%
- Alcohol-related deaths in 2021: 20.1 per 100,000 residents (57 total)
- Alcohol-related deaths in 2018: 7.9 per 100,000 residents (23 total)
- Median household income: $62,548
- County seat: Mason
2. Cobb County, GA

- Increase in alcohol-related deaths per capita, 2018 to 2021:163.2%
- Alcohol-related deaths in 2021: 9.4 per 100,000 residents (72 total)
- Alcohol-related deaths in 2018: 3.6 per 100,000 residents (27 total)
- Median household income: $94,244
- County seat: Marietta
1. Yellowstone County, MT

- Increase in alcohol-related deaths per capita, 2018 to 2021:230.0%
- Alcohol-related deaths in 2021: 37.1 per 100,000 residents (62 total)
- Alcohol-related deaths in 2018: 11.2 per 100,000 residents (18 total)
- Median household income: $72,300
- County seat: Billings


