
Retirement may be the end of a career, but it’s also the start of a new chapter of adulthood. Most people know when they can or want to retire. Where to retire, however, may be a more complex decision to make.
To rank the best and worst states for people who want to stay active, both physically and socially, in retirement, 24/7 Tempo used data from the U.S. Census Bureau and the Centers for Disease Control and Prevention. We created an index of more than 20 measures of retirement-friendliness, representing four categories — environment, health-related factors, social support, and demographics.
One of the advantages of retirement is that a person is not limited to living in their current state. Many retirees relocate to experience a different way of life in a new environment. It’s hard to look past sunshine, nice weather year-round, as well as a large number of retirement communities and social events.
To stay happy as well as healthy in older age, it is important that people eat a healthy diet, avoid unhealthy habits like smoking, and get preventive medical care like vaccinations and disease screenings. It’s important that retirees have a good idea of what their cost of living will be so they can make plans, save, and avoid financial hardship. This is what it costs to retire in every state.
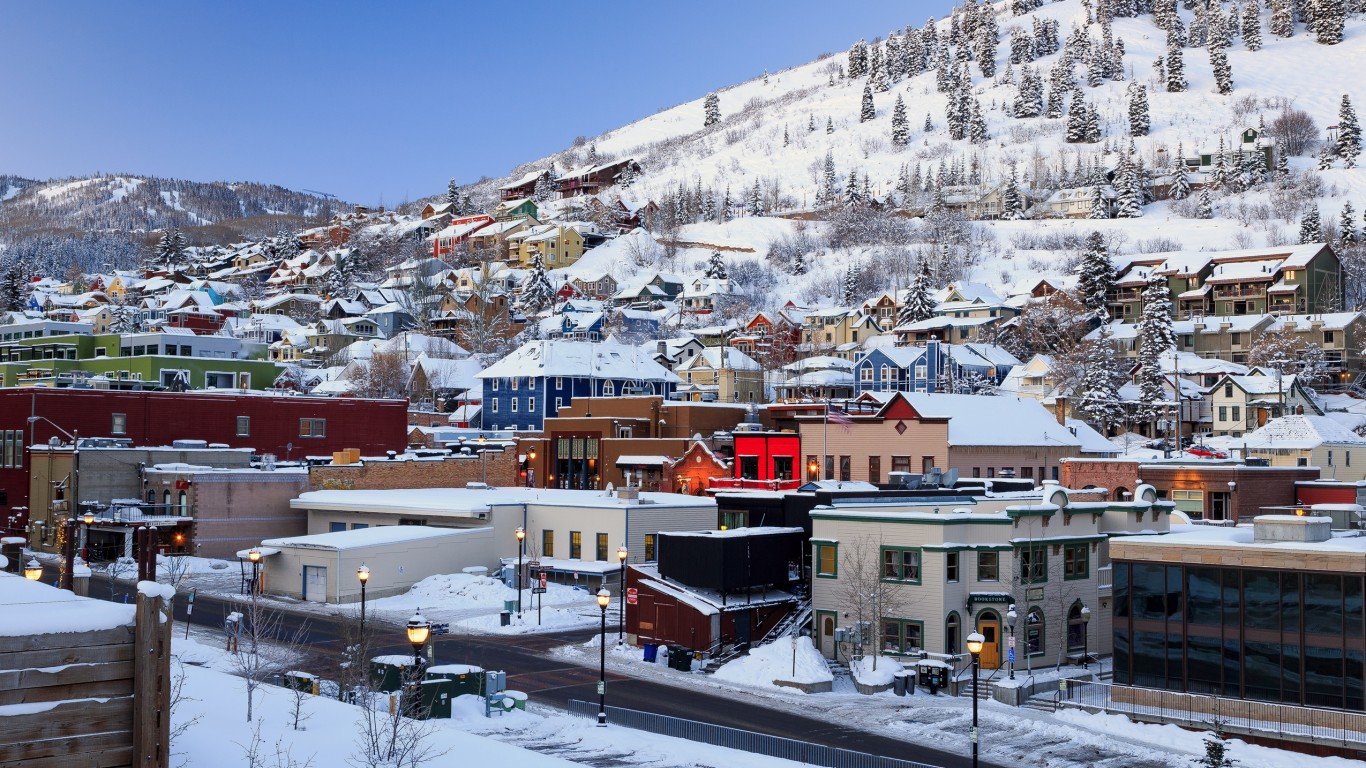
50. Utah
> Population: 3.2 million
> Population 65+: 11.4% — the lowest (total: 365,198)
> National parks and historic sites: 13
> Avg. hours of full-sun per day: 4 hours 52 minutes — 8th highest
> Adults 65+ who volunteer: 44.6% — the highest
> Adults 65+ in good or excellent health: 44.6% — 17th highest
> Cost of living: 3.5% lower than the national average — 23rd highest
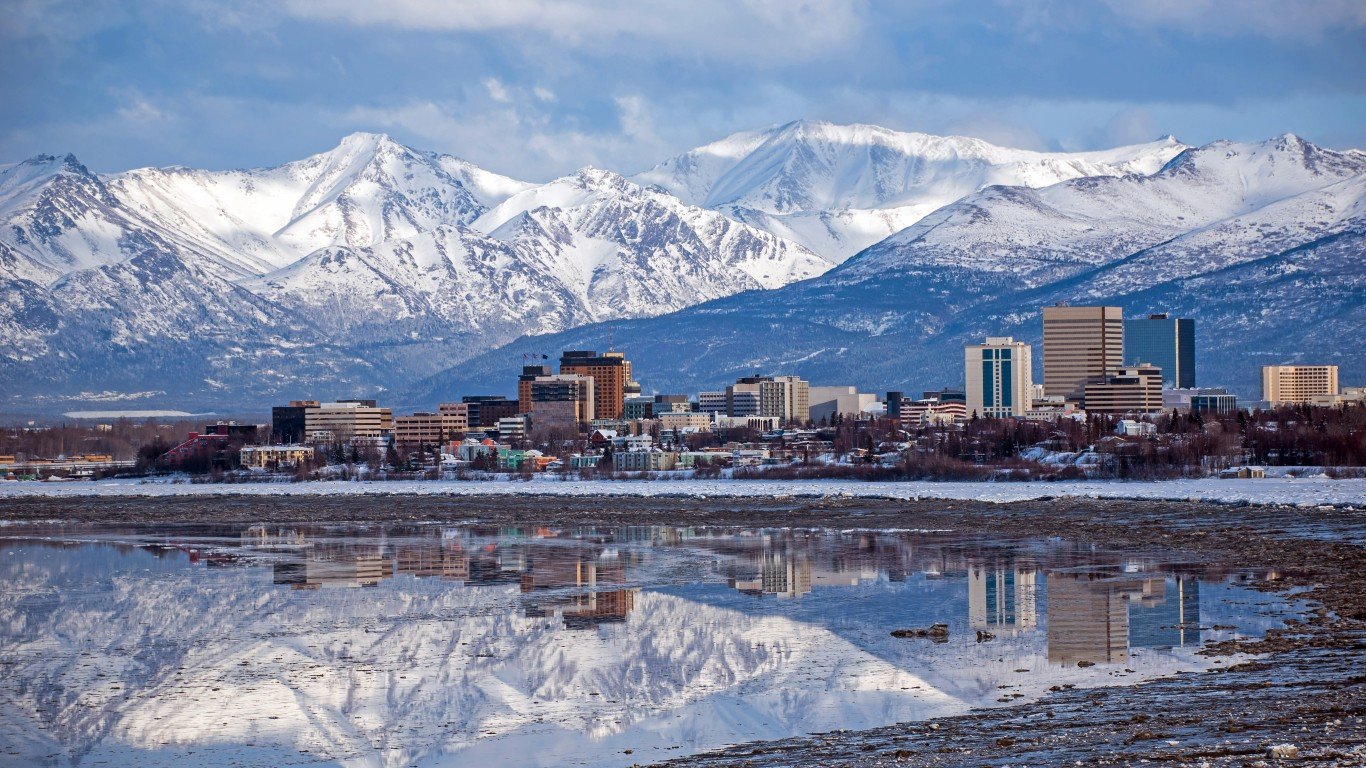
49. Alaska
> Population: 732,000
> Population 65+: 12.4% — 2nd lowest (total: 90,588)
> National parks and historic sites: 24
> Avg. hours of full-sun per day: N/A
> Adults 65+ who volunteer: 35.0% — 14th highest
> Adults 65+ in good or excellent health: 49.4% — 5th highest
> Cost of living: 5.1% higher than the national average — 9th highest

48. Texas
> Population: 29.0 million
> Population 65+: 12.9% — 3rd lowest (total: 3,738,727)
> National parks and historic sites: 14
> Avg. hours of full-sun per day: 5 hours 6 minutes — 5th highest
> Adults 65+ who volunteer: 27.5% — 15th lowest
> Adults 65+ in good or excellent health: 37.4% — 11th lowest
> Cost of living: 3.5% lower than the national average — 23rd highest
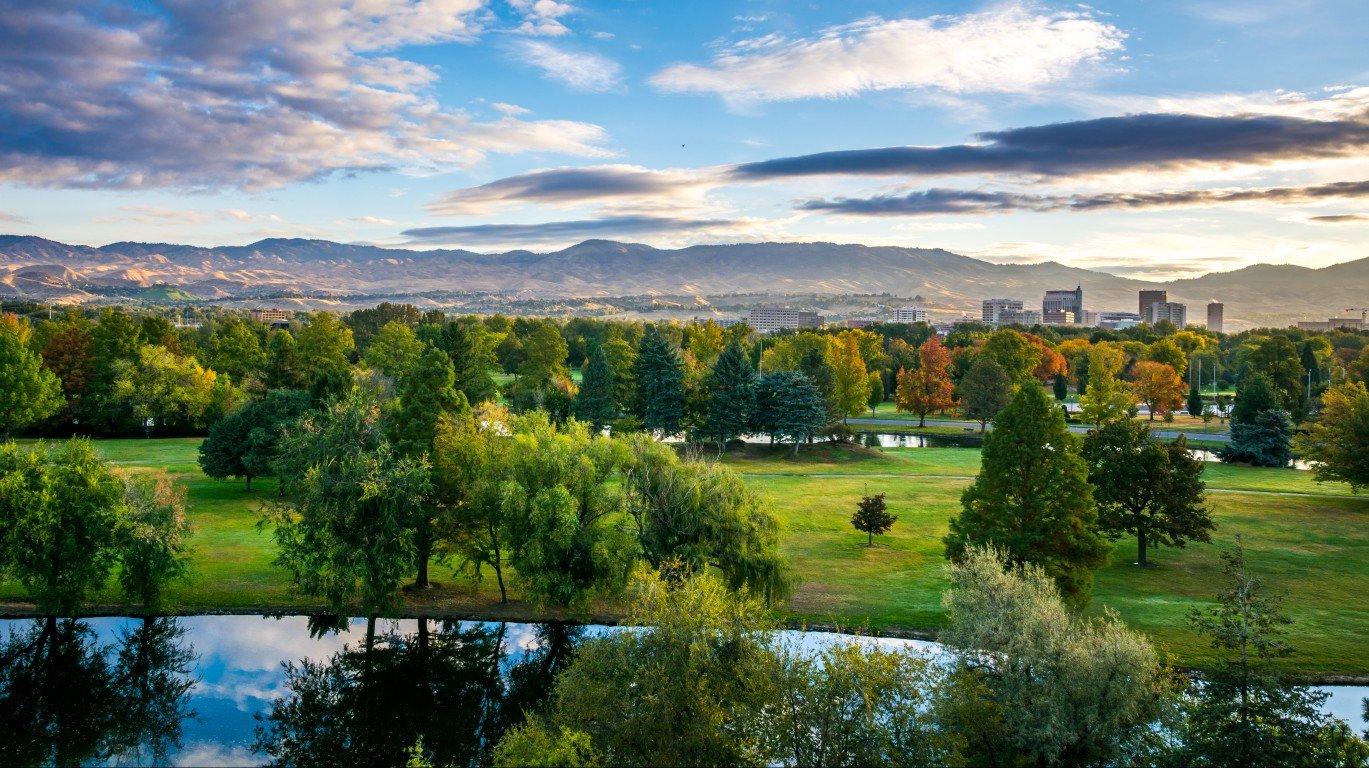
47. Idaho
> Population: 1.8 million
> Population 65+: 16.2% — 16th lowest (total: 288,617)
> National parks and historic sites: 7
> Avg. hours of full-sun per day: 4 hours 26 minutes — 19th highest
> Adults 65+ who volunteer: 30.5% — 23rd lowest
> Adults 65+ in good or excellent health: 45.3% — 14th highest
> Cost of living: 7.8% lower than the national average — 21st lowest

46. New York
> Population: 19.5 million
> Population 65+: 16.9% — 25th lowest (total: 3,295,968)
> National parks and historic sites: 24
> Avg. hours of full-sun per day: 3 hours 52 minutes — 3rd lowest
> Adults 65+ who volunteer: 22.2% — 8th lowest
> Adults 65+ in good or excellent health: 41.0% — 21st lowest
> Cost of living: 16.3% higher than the national average — 3rd highest
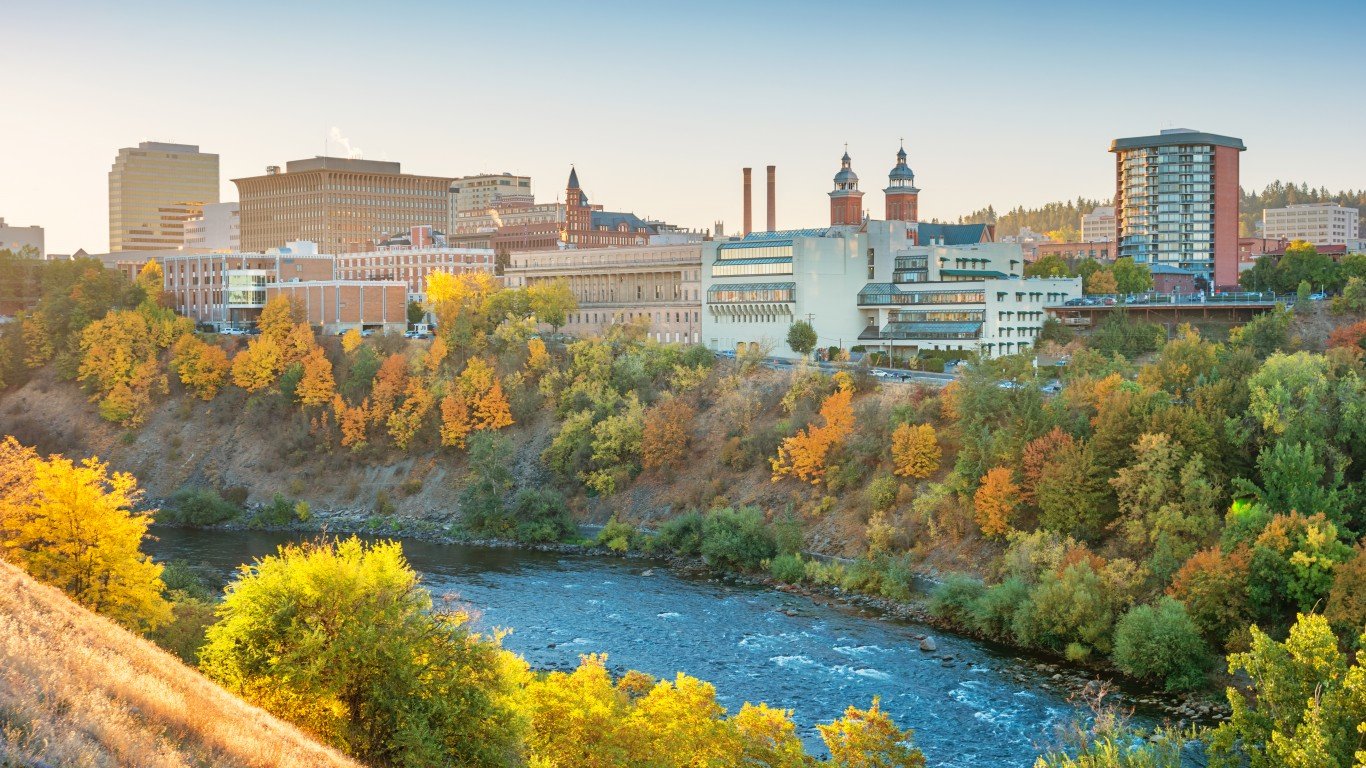
45. Washington
> Population: 7.6 million
> Population 65+: 15.9% — 8th lowest (total: 1,207,685)
> National parks and historic sites: 15
> Avg. hours of full-sun per day: 4 hours 4 minutes — 11th lowest (tied)
> Adults 65+ who volunteer: 36.8% — 7th highest
> Adults 65+ in good or excellent health: 47.9% — 7th highest
> Cost of living: 8.4% higher than the national average — 6th highest
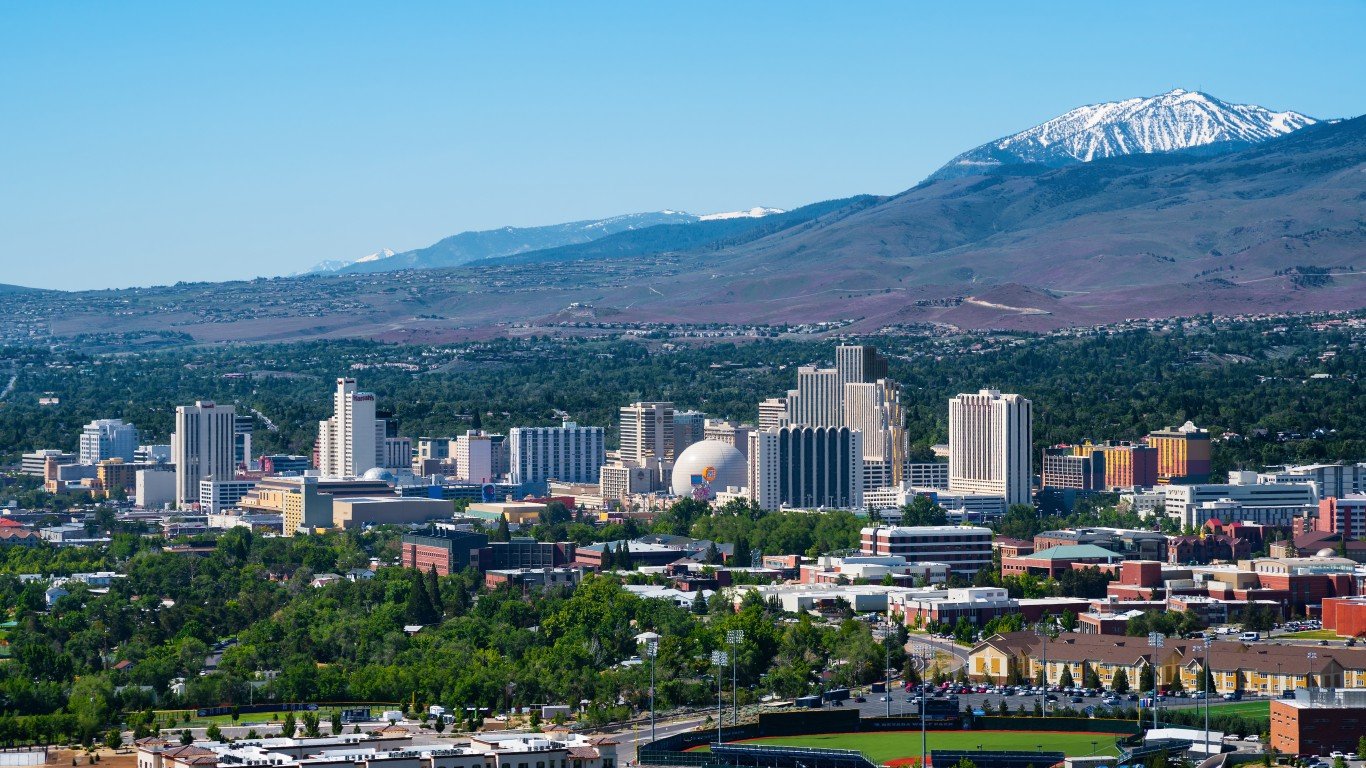
44. Nevada
> Population: 3.1 million
> Population 65+: 16.2% — 17th lowest (total: 498,219)
> National parks and historic sites: 4
> Avg. hours of full-sun per day: 5 hours 1 minutes — 6th highest
> Adults 65+ who volunteer: 24.1% — 10th lowest
> Adults 65+ in good or excellent health: 36.2% — 10th lowest
> Cost of living: 2.6% lower than the national average — 20th highest

43. Colorado
> Population: 5.8 million
> Population 65+: 14.7% — 5th lowest (total: 845,378)
> National parks and historic sites: 13
> Avg. hours of full-sun per day: 4 hours 50 minutes — 9th highest
> Adults 65+ who volunteer: 31.7% — 25th highest
> Adults 65+ in good or excellent health: 51.1% — 3rd highest
> Cost of living: 1.9% higher than the national average — 13th highest

42. Georgia
> Population: 10.6 million
> Population 65+: 14.3% — 4th lowest (total: 1,523,192)
> National parks and historic sites: 11
> Avg. hours of full-sun per day: 4 hours 48 minutes — 11th highest
> Adults 65+ who volunteer: 19.7% — 2nd lowest
> Adults 65+ in good or excellent health: 36.2% — 10th lowest
> Cost of living: 6.8% lower than the national average — 24th lowest

41. California
> Population: 39.5 million
> Population 65+: 14.8% — 6th lowest (total: 5,834,998)
> National parks and historic sites: 28
> Avg. hours of full-sun per day: 5 hours 21 minutes — 2nd highest
> Adults 65+ who volunteer: 23.3% — 9th lowest
> Adults 65+ in good or excellent health: 44.4% — 18th highest
> Cost of living: 16.4% higher than the national average — 2nd highest

40. Illinois
> Population: 12.7 million
> Population 65+: 16.1% — 14th lowest (total: 2,045,361)
> National parks and historic sites: 2
> Avg. hours of full-sun per day: 4 hours 10 minutes — 16th lowest
> Adults 65+ who volunteer: 27.8% — 17th lowest
> Adults 65+ in good or excellent health: 38.6% — 14th lowest
> Cost of living: 2.6% lower than the national average — 20th highest

39. Michigan
> Population: 10.0 million
> Population 65+: 17.7% — 14th highest (total: 1,766,409)
> National parks and historic sites: 5
> Avg. hours of full-sun per day: 3 hours 58 minutes — 8th lowest
> Adults 65+ who volunteer: 26.1% — 13th lowest
> Adults 65+ in good or excellent health: 41.7% — 23rd lowest
> Cost of living: 7.7% lower than the national average — 22nd lowest

38. Indiana
> Population: 6.7 million
> Population 65+: 16.1% — 13th lowest (total: 1,084,472)
> National parks and historic sites: 3
> Avg. hours of full-sun per day: 4 hours 7 minutes — 14th lowest
> Adults 65+ who volunteer: 35.2% — 12th highest
> Adults 65+ in good or excellent health: 39.3% — 17th lowest
> Cost of living: 11.3% lower than the national average — 11th lowest

37. Minnesota
> Population: 5.6 million
> Population 65+: 16.3% — 18th lowest (total: 921,491)
> National parks and historic sites: 5
> Avg. hours of full-sun per day: 3 hours 54 minutes — 5th lowest
> Adults 65+ who volunteer: 43.3% — 2nd highest
> Adults 65+ in good or excellent health: 47.7% — 8th highest
> Cost of living: 2.0% lower than the national average — 19th highest

36. Maryland
> Population: 6.0 million
> Population 65+: 15.9% — 9th lowest (total: 959,887)
> National parks and historic sites: 18
> Avg. hours of full-sun per day: 4 hours 17 minutes — 21st lowest
> Adults 65+ who volunteer: 38.2% — 4th highest
> Adults 65+ in good or excellent health: 42.7% — 25th lowest
> Cost of living: 7.7% higher than the national average — 7th highest

35. Massachusetts
> Population: 6.9 million
> Population 65+: 17.0% — 25th highest (total: 1,172,293)
> National parks and historic sites: 15
> Avg. hours of full-sun per day: 4 hours 6 minutes — 13th lowest (tied)
> Adults 65+ who volunteer: 30.1% — 20th lowest
> Adults 65+ in good or excellent health: 48.0% — 6th highest
> Cost of living: 10.4% higher than the national average — 5th highest

34. Louisiana
> Population: 4.6 million
> Population 65+: 16.0% — 11th lowest (total: 742,194)
> National parks and historic sites: 5
> Avg. hours of full-sun per day: 4 hours 53 minutes — 7th highest
> Adults 65+ who volunteer: 22.0% — 7th lowest
> Adults 65+ in good or excellent health: 33.7% — 5th lowest
> Cost of living: 12.1% lower than the national average — 8th lowest

33. Wisconsin
> Population: 5.8 million
> Population 65+: 17.5% — 18th highest (total: 1,019,896)
> National parks and historic sites: 2
> Avg. hours of full-sun per day: 3 hours 56 minutes — 6th lowest
> Adults 65+ who volunteer: 37.1% — 5th highest
> Adults 65+ in good or excellent health: 44.2% — 19th highest
> Cost of living: 8.1% lower than the national average — 20th lowest

32. Virginia
> Population: 8.5 million
> Population 65+: 15.9% — 10th lowest (total: 1,358,336)
> National parks and historic sites: 22
> Avg. hours of full-sun per day: 4 hours 24 minutes — 20th highest
> Adults 65+ who volunteer: 33.5% — 17th highest
> Adults 65+ in good or excellent health: 42.3% — 24th lowest
> Cost of living: 1.3% higher than the national average — 14th highest

31. Connecticut
> Population: 3.6 million
> Population 65+: 17.6% — 16th highest (total: 629,032)
> National parks and historic sites: 2
> Avg. hours of full-sun per day: 4 hours 8 minutes — 15th lowest
> Adults 65+ who volunteer: 30.7% — 24th lowest
> Adults 65+ in good or excellent health: 50.4% — 4th highest
> Cost of living: 5.0% higher than the national average — 10th highest

30. Ohio
> Population: 11.7 million
> Population 65+: 17.5% — 19th highest (total: 2,043,548)
> National parks and historic sites: 8
> Avg. hours of full-sun per day: 4 hours 3 minutes — 10th lowest
> Adults 65+ who volunteer: 30.3% — 21st lowest
> Adults 65+ in good or excellent health: 40.1% — 20th lowest
> Cost of living: 11.6% lower than the national average — 9th lowest

29. Oregon
> Population: 4.2 million
> Population 65+: 18.2% — 10th highest (total: 767,496)
> National parks and historic sites: 5
> Avg. hours of full-sun per day: 4 hours 29 minutes — 18th highest
> Adults 65+ who volunteer: 36.5% — 9th highest
> Adults 65+ in good or excellent health: 45.5% — 13th highest
> Cost of living: 2.2% higher than the national average — 12th highest

28. North Dakota
> Population: 762,000
> Population 65+: 15.8% — 7th lowest (total: 120,177)
> National parks and historic sites: 3
> Avg. hours of full-sun per day: 4 hours 2 minutes — 9th lowest
> Adults 65+ who volunteer: 38.7% — 3rd highest
> Adults 65+ in good or excellent health: 39.0% — 15th lowest
> Cost of living: 10.7% lower than the national average — 14th lowest

27. Tennessee
> Population: 6.8 million
> Population 65+: 16.7% — 22nd lowest (total: 1,138,965)
> National parks and historic sites: 12
> Avg. hours of full-sun per day: 4 hours 23 minutes — 21st highest
> Adults 65+ who volunteer: 27.6% — 16th lowest
> Adults 65+ in good or excellent health: 34.2% — 6th lowest
> Cost of living: 10.3% lower than the national average — 16th lowest

26. Kentucky
> Population: 4.5 million
> Population 65+: 16.9% — 24th lowest (total: 754,559)
> National parks and historic sites: 5
> Avg. hours of full-sun per day: 4 hours 14 minutes — 20th lowest
> Adults 65+ who volunteer: 18.9% — the lowest
> Adults 65+ in good or excellent health: 34.5% — 7th lowest
> Cost of living: 12.6% lower than the national average — 6th lowest

25. New Hampshire
> Population: 1.4 million
> Population 65+: 18.6% — 9th highest (total: 253,147)
> National parks and historic sites: 2
> Avg. hours of full-sun per day: 3 hours 53 minutes — 4th lowest
> Adults 65+ who volunteer: 32.3% — 22nd highest
> Adults 65+ in good or excellent health: 51.7% — 2nd highest
> Cost of living: 6.5% higher than the national average — 8th highest

24. Missouri
> Population: 6.1 million
> Population 65+: 17.2% — 23rd highest (total: 1,057,943)
> National parks and historic sites: 6
> Avg. hours of full-sun per day: 4 hours 20 minutes — 22nd lowest
> Adults 65+ who volunteer: 26.7% — 14th lowest
> Adults 65+ in good or excellent health: 39.1% — 16th lowest
> Cost of living: 11.3% lower than the national average — 11th lowest

23. Oklahoma
> Population: 4.0 million
> Population 65+: 16.1% — 12th lowest (total: 635,222)
> National parks and historic sites: 3
> Avg. hours of full-sun per day: 4 hours 45 minutes — 12th highest
> Adults 65+ who volunteer: 33.0% — 18th highest
> Adults 65+ in good or excellent health: 34.9% — 8th lowest
> Cost of living: 12.8% lower than the national average — 5th lowest

22. New Jersey
> Population: 8.9 million
> Population 65+: 16.6% — 21st lowest (total: 1,475,075)
> National parks and historic sites: 9
> Avg. hours of full-sun per day: 4 hours 14 minutes — 19th lowest
> Adults 65+ who volunteer: 21.9% — 6th lowest
> Adults 65+ in good or excellent health: 43.8% — 20th highest
> Cost of living: 16.0% higher than the national average — 4th highest

21. Nebraska
> Population: 1.9 million
> Population 65+: 16.1% — 15th lowest (total: 312,295)
> National parks and historic sites: 5
> Avg. hours of full-sun per day: 4 hours 23 minutes — 22nd highest
> Adults 65+ who volunteer: 35.5% — 11th highest
> Adults 65+ in good or excellent health: 45.7% — 12th highest
> Cost of living: 10.5% lower than the national average — 15th lowest

20. Rhode Island
> Population: 1.1 million
> Population 65+: 17.7% — 15th highest (total: 187,155)
> National parks and historic sites: 2
> Avg. hours of full-sun per day: 4 hours 11 minutes — 17th lowest
> Adults 65+ who volunteer: 28.4% — 18th lowest
> Adults 65+ in good or excellent health: 46.4% — 11th highest
> Cost of living: 1.3% higher than the national average — 14th highest

19. North Carolina
> Population: 10.5 million
> Population 65+: 16.7% — 23rd lowest (total: 1,750,935)
> National parks and historic sites: 10
> Avg. hours of full-sun per day: 4 hours 35 minutes — 16th highest (tied)
> Adults 65+ who volunteer: 32.7% — 20th highest
> Adults 65+ in good or excellent health: 37.6% — 12th lowest
> Cost of living: 8.3% lower than the national average — 19th lowest

18. New Mexico
> Population: 2.1 million
> Population 65+: 18.0% — 12th highest (total: 377,730)
> National parks and historic sites: 15
> Avg. hours of full-sun per day: 5 hours 20 minutes — 3rd highest
> Adults 65+ who volunteer: 30.5% — 23rd lowest
> Adults 65+ in good or excellent health: 40.0% — 19th lowest
> Cost of living: 8.9% lower than the national average — 17th lowest

17. Kansas
> Population: 2.9 million
> Population 65+: 16.4% — 20th lowest (total: 477,996)
> National parks and historic sites: 5
> Avg. hours of full-sun per day: 4 hours 37 minutes — 15th highest
> Adults 65+ who volunteer: 36.0% — 10th highest
> Adults 65+ in good or excellent health: 42.8% — 24th highest
> Cost of living: 10.8% lower than the national average — 13th lowest

16. Arizona
> Population: 7.3 million
> Population 65+: 18.0% — 13th highest (total: 1,307,241)
> National parks and historic sites: 22
> Avg. hours of full-sun per day: 5 hours 27 minutes — the highest
> Adults 65+ who volunteer: 25.0% — 11th lowest
> Adults 65+ in good or excellent health: 45.3% — 14th highest
> Cost of living: 3.7% lower than the national average — 25th highest

15. Pennsylvania
> Population: 12.8 million
> Population 65+: 18.7% — 8th highest (total: 2,388,218)
> National parks and historic sites: 19
> Avg. hours of full-sun per day: 3 hours 56 minutes — 7th lowest
> Adults 65+ who volunteer: 32.8% — 19th highest
> Adults 65+ in good or excellent health: 38.4% — 13th lowest
> Cost of living: 3.0% lower than the national average — 22nd highest

14. Mississippi
> Population: 3.0 million
> Population 65+: 16.4% — 19th lowest (total: 486,804)
> National parks and historic sites: 8
> Avg. hours of full-sun per day: 4 hours 44 minutes — 13th highest
> Adults 65+ who volunteer: 20.2% — 3rd lowest
> Adults 65+ in good or excellent health: 28.8% — the lowest
> Cost of living: 15.6% lower than the national average — the lowest

13. Arkansas
> Population: 3.0 million
> Population 65+: 17.4% — 22nd highest (total: 524,237)
> National parks and historic sites: 7
> Avg. hours of full-sun per day: 4 hours 35 minutes — 16th highest (tied)
> Adults 65+ who volunteer: 28.9% — 19th lowest
> Adults 65+ in good or excellent health: 32.7% — 3rd lowest
> Cost of living: 15.3% lower than the national average — 2nd lowest
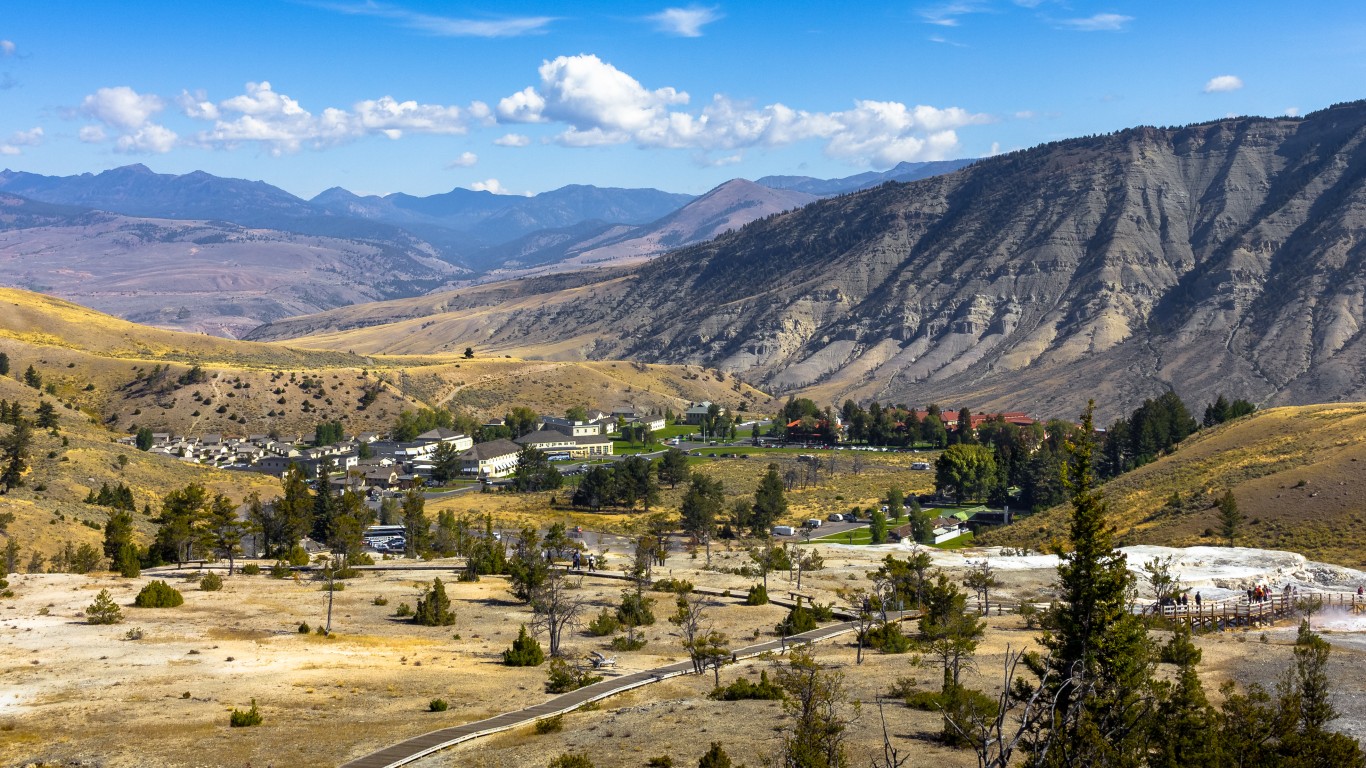
12. Wyoming
> Population: 579,000
> Population 65+: 17.1% — 24th highest (total: 98,789)
> National parks and historic sites: 7
> Avg. hours of full-sun per day: 4 hours 31 minutes — 17th highest
> Adults 65+ who volunteer: 32.6% — 21st highest
> Adults 65+ in good or excellent health: 43.7% — 22nd highest
> Cost of living: 7.2% lower than the national average — 23rd lowest

11. Alabama
> Population: 4.9 million
> Population 65+: 17.4% — 20th highest (total: 854,312)
> National parks and historic sites: 9
> Avg. hours of full-sun per day: 4 hours 43 minutes — 14th highest
> Adults 65+ who volunteer: 25.4% — 12th lowest
> Adults 65+ in good or excellent health: 31.1% — 2nd lowest
> Cost of living: 14.2% lower than the national average — 3rd lowest

10. Vermont
> Population: 624,000
> Population 65+: 20.1% — 4th highest (total: 125,201)
> National parks and historic sites: 2
> Avg. hours of full-sun per day: 3 hours 45 minutes — the lowest
> Adults 65+ who volunteer: 33.6% — 16th highest
> Adults 65+ in good or excellent health: 52.6% — the highest
> Cost of living: 3.1% higher than the national average — 11th highest

9. Iowa
> Population: 3.2 million
> Population 65+: 17.5% — 17th highest (total: 553,575)
> National parks and historic sites: 2
> Avg. hours of full-sun per day: 4 hours 5 minutes — 12th lowest
> Adults 65+ who volunteer: 36.9% — 6th highest
> Adults 65+ in good or excellent health: 43.8% — 20th highest
> Cost of living: 11.0% lower than the national average — 12th lowest

8. Montana
> Population: 1.1 million
> Population 65+: 19.5% — 6th highest (total: 207,909)
> National parks and historic sites: 8
> Avg. hours of full-sun per day: 4 hours 6 minutes — 13th lowest (tied)
> Adults 65+ who volunteer: 35.1% — 13th highest
> Adults 65+ in good or excellent health: 47.5% — 9th highest
> Cost of living: 6.5% lower than the national average — 25th lowest

7. South Dakota
> Population: 885,000
> Population 65+: 17.4% — 21st highest (total: 153,799)
> National parks and historic sites: 6
> Avg. hours of full-sun per day: 4 hours 12 minutes — 18th lowest
> Adults 65+ who volunteer: 36.8% — 7th highest
> Adults 65+ in good or excellent health: 42.8% — 24th highest
> Cost of living: 12.2% lower than the national average — 7th lowest

6. Hawaii
> Population: 1.4 million
> Population 65+: 19.0% — 7th highest (total: 269,470)
> National parks and historic sites: 8
> Avg. hours of full-sun per day: N/A
> Adults 65+ who volunteer: 20.5% — 5th lowest
> Adults 65+ in good or excellent health: 43.4% — 23rd highest
> Cost of living: 19.3% higher than the national average — the highest

5. South Carolina
> Population: 5.1 million
> Population 65+: 18.2% — 11th highest (total: 935,538)
> National parks and historic sites: 7
> Avg. hours of full-sun per day: 4 hours 49 minutes — 10th highest
> Adults 65+ who volunteer: 31.9% — 24th highest
> Adults 65+ in good or excellent health: 39.5% — 18th lowest
> Cost of living: 8.5% lower than the national average — 18th lowest

4. West Virginia
> Population: 1.8 million
> Population 65+: 20.5% — 3rd highest (total: 367,400)
> National parks and historic sites: 6
> Avg. hours of full-sun per day: 4 hours 4 minutes — 11th lowest (tied)
> Adults 65+ who volunteer: 31.0% — 25th lowest
> Adults 65+ in good or excellent health: 33.0% — 4th lowest
> Cost of living: 12.9% lower than the national average — 4th lowest

3. Delaware
> Population: 974,000
> Population 65+: 19.5% — 5th highest (total: 189,638)
> National parks and historic sites: 1
> Avg. hours of full-sun per day: 4 hours 23 minutes — 21st highest
> Adults 65+ who volunteer: 32.0% — 23rd highest
> Adults 65+ in good or excellent health: 45.2% — 16th highest
> Cost of living: 0.6% lower than the national average — 17th highest
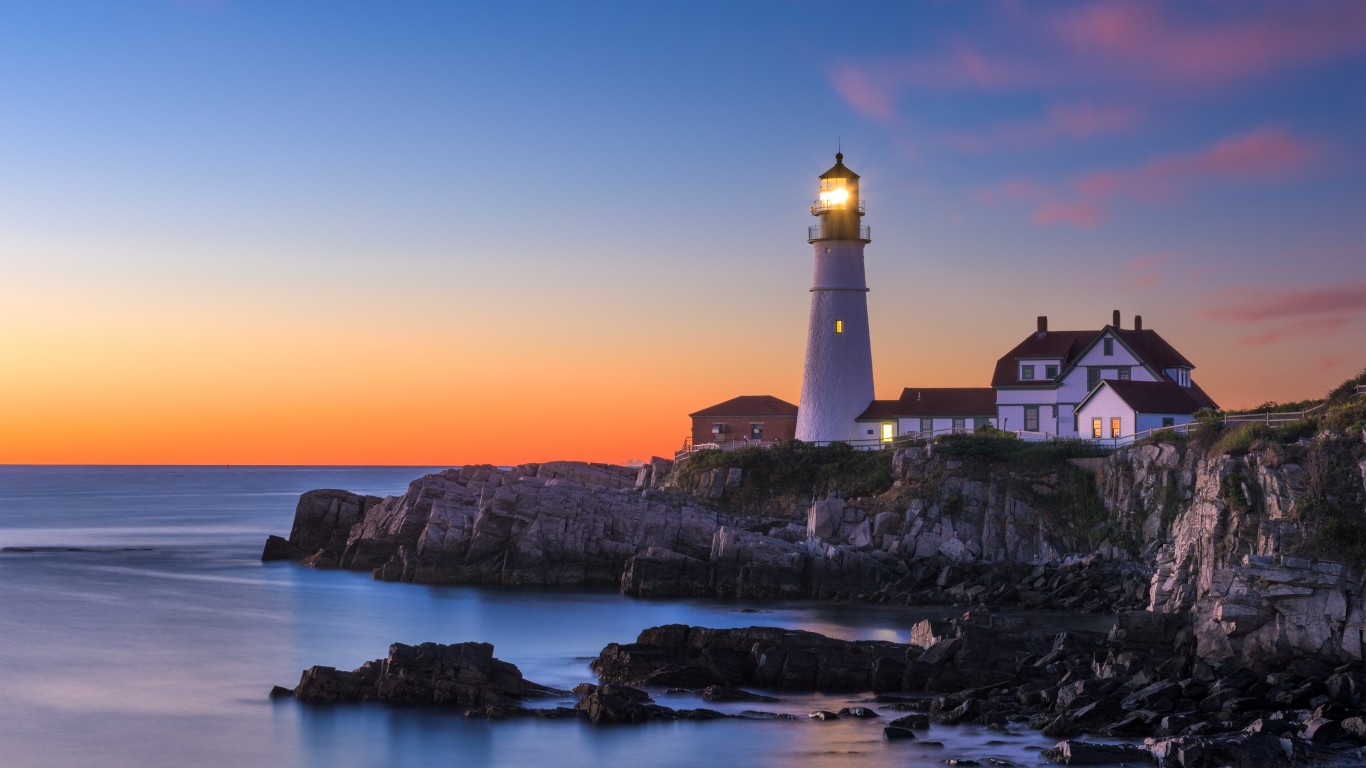
2. Maine
> Population: 1.3 million
> Population 65+: 21.3% — the highest (total: 285,978)
> National parks and historic sites: 4
> Avg. hours of full-sun per day: 3 hours 46 minutes — 2nd lowest
> Adults 65+ who volunteer: 33.7% — 15th highest
> Adults 65+ in good or excellent health: 46.6% — 10th highest
> Cost of living: 0.7% lower than the national average — 18th highest

1. Florida
> Population: 21.5 million
> Population 65+: 20.9% — 2nd highest (total: 4,498,198)
> National parks and historic sites: 11
> Avg. hours of full-sun per day: 5 hours 10 minutes — 4th highest
> Adults 65+ who volunteer: 20.3% — 4th lowest
> Adults 65+ in good or excellent health: 41.7% — 23rd lowest
> Cost of living: 1.0% higher than the national average — 16th highest
Methodology
To determine the best and worst states for older citizens, 24/7 Tempo created an index comprising 22 measures in four categories: health factors, environmental factors, social support, and the share of the population 65 years old and over. These categories aimed to capture the essential elements of quality of life for retired adults. We created an index for each category to rank each state by this criteria as well as an overall index. Each category was given equal weight in the index.
Population estimates, including the share of the population 65 years old and over, as well as the average retirement income, and the percentage of adults 65+ living under the poverty line, were obtained from the U.S. Census Bureau’s American Community Survey and are for 2019.
National parks and site data for each state was obtained from the National Park Service and includes sites that are either affiliated or managed by the NPS. The average hours of full sunlight per day was calculated from data provided by the Centers for Disease Control and Prevention’s North America Land Data Assimilation System and was based on the aggregate average kilojoules of sunshine per square meter for the years 1979 to 2011 and was converted to kilowatt-hours per square meter. A peak sun-hour is a period during which the intensity of sunlight exceeds 1,000 watts per square meter.
The percentage of adults 65 and older that reported volunteering the past 12 months was obtained from America’s Health Rankings analysis of Corporation for National & Community Service (Americorps) data from 2017. The share of adults 65+ who met CDC exercise guidelines in 2017 and the share of adults 65+ who reported good or excellent health in 2018 were also obtained from America’s Health Rankings in its analysis of CDC data. Data on membership associations per 10,000 state residents was obtained from 2018 state level data provided by the 2021 County Health Rankings & Roadmaps, a Robert Wood Johnson Foundation and University of Wisconsin Population Health Institute joint program.