
There is no shortage of advice on how to live a long and healthy life. But while some lifestyle factors such as keeping active, not smoking, and eating a balanced diet are under our control, others are not. Such factors include genetics, environment, socioeconomic status, access to health care, and even social determinants such as race and gender. (One key environmental factor is water quality, and these are American cities with the most contaminated water.)
As some of these factors – especially socioeconomic conditions, health care infrastructure, and environmental quality – are common to many U.S. cities, variations in them contribute to disparities in health outcomes across different urban areas.
To determine the 25 healthiest cities in the United States, 24/7 Tempo reviewed county-level data from the 2023 County Health Rankings & Roadmaps program of the University of Wisconsin Population Health Institute. Metropolitan areas were ranked based on an index consisting of eight health measures, such as potential life lost, smoking rate, and percentage reporting fair or poor health, all using data from the CHR. In all, 384 metro areas were considered.
One component of the index is the adult smoking rate, which is lower than the national rate of 16% in all of the 25 healthiest metro areas. No. 6 on the list, Provo-Orem, Utah, has the lowest smoking rate nationwide at 6.8%. Similarly, 24 of the 25 healthiest cities have lower adult obesity rates than the national average of 32%, including eight cities that have among the 10 lowest obesity rates of all 384 metros considered. Boulder, Colorado, the city with the lowest obesity rate nationwide, at 17.6%, ranks No. 2 on the list. (In contrast, here’s a list of the most obese city in every state.)
While median household income is not an index component, nine of the 25 healthiest cities are also among the 10 wealthiest nationwide. Still, five of the 25 cities on the list have lower median household incomes than the national median of $69,717. The city with the highest income on the list, at $139,892, also has the highest income nationwide – and ranks as the healthiest of all 384 U.S. metro areas.
Regionally, the majority of the healthiest U.S. cities are in the West, including eight in California, and two each in Oregon, Utah, and Hawaii. Four others are in the Midwest, including two in Iowa, and four more are in the Northeast.
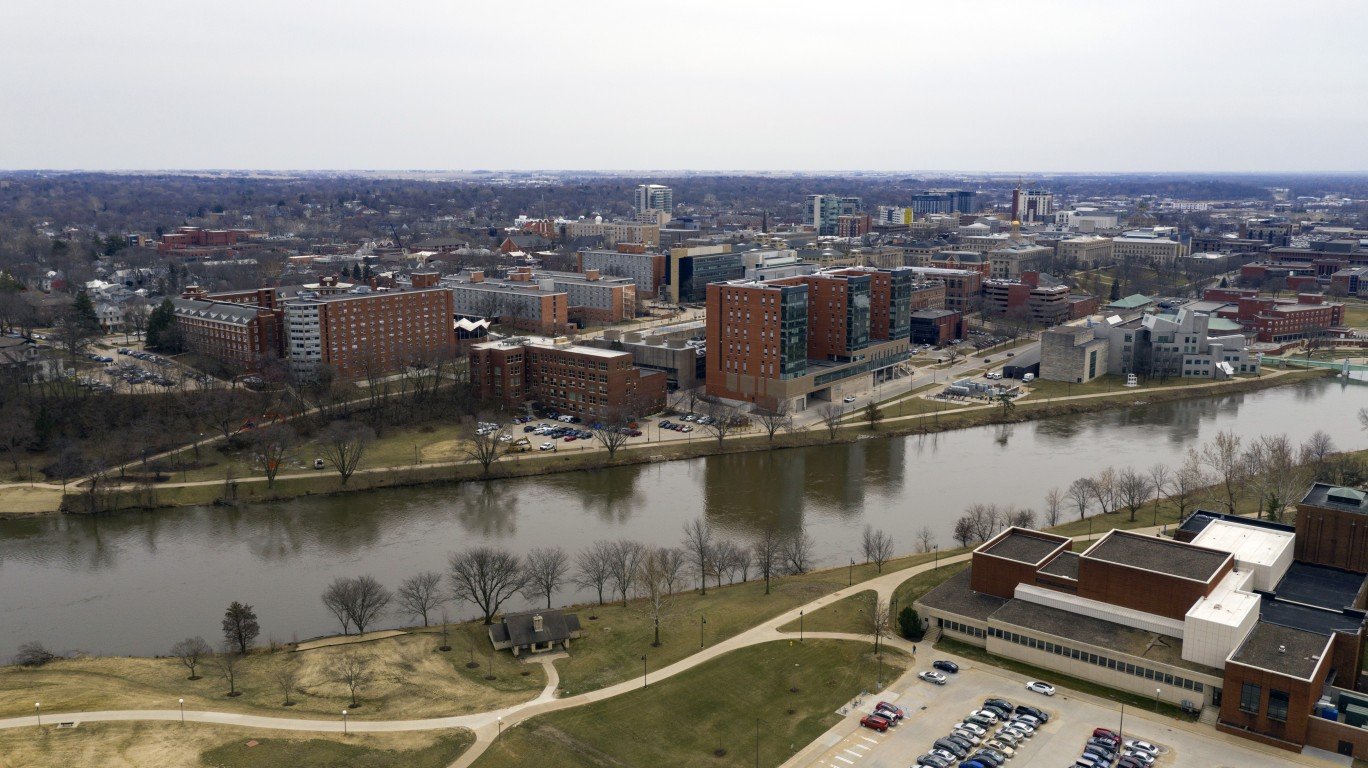
25. Iowa City, Iowa
> Adults in fair or poor health, 2020: 11.1% (#340 of 384 MSAs)
> Adult smoking rate, 2020: 14.0% (#339 of 384 MSAs)
> Adult obesity rate, 2020: 30.6% (#308 of 384 MSAs)
> Median household income, 2021: $66,216 (#141 of 384 MSAs)
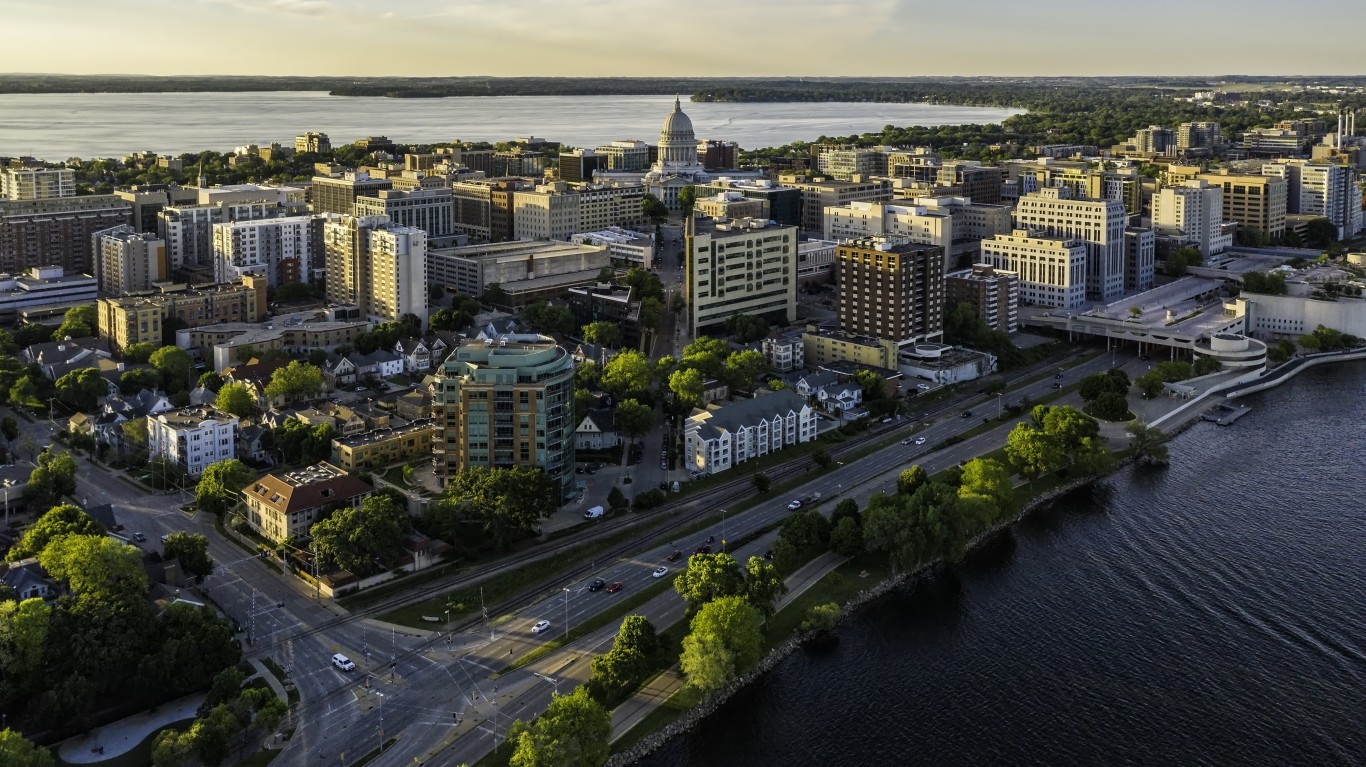
24. Madison, Wisconsin
> Adults in fair or poor health, 2020: 9.3% (#380 of 384 MSAs)
> Adult smoking rate, 2020: 13.3% (#349 of 384 MSAs)
> Adult obesity rate, 2020: 26.4% (#368 of 384 MSAs)
> Median household income, 2021: $76,731 (#62 of 384 MSAs)

23. Rochester, Minnesota
> Adults in fair or poor health, 2020: 9.7% (#376 of 384 MSAs)
> Adult smoking rate, 2020: 15.2% (#305 of 384 MSAs)
> Adult obesity rate, 2020: 32.5% (#262 of 384 MSAs)
> Median household income, 2021: $80,434 (#44 of 384 MSAs)

22. Logan, Utah-Idaho
> Adults in fair or poor health, 2020: 12.7% (#273 of 384 MSAs)
> Adult smoking rate, 2020: 9.9% (#378 of 384 MSAs)
> Adult obesity rate, 2020: 30.1% (#316 of 384 MSAs)
> Median household income, 2021: $67,022 (#126 of 384 MSAs)

21. Ames, Iowa
> Adults in fair or poor health, 2020: 10.8% (#354 of 384 MSAs)
> Adult smoking rate, 2020: 15.0% (#316 of 384 MSAs)
> Adult obesity rate, 2020: 33.7% (#229 of 384 MSAs)
> Median household income, 2021: $64,569 (#161 of 384 MSAs)

20. San Diego-Chula Vista-Carlsbad, California
> Adults in fair or poor health, 2020: 13.4% (#246 of 384 MSAs)
> Adult smoking rate, 2020: 10.9% (#375 of 384 MSAs)
> Adult obesity rate, 2020: 28.4% (#345 of 384 MSAs)
> Median household income, 2021: $91,003 (#13 of 384 MSAs)

19. Oxnard-Thousand Oaks-Ventura, California
> Adults in fair or poor health, 2020: 13.5% (#239 of 384 MSAs)
> Adult smoking rate, 2020: 11.1% (#372 of 384 MSAs)
> Adult obesity rate, 2020: 28.9% (#339 of 384 MSAs)
> Median household income, 2021: $96,454 (#9 of 384 MSAs)

18. Boston-Cambridge-Newton, Massachusetts-New Hampshiure
> Adults in fair or poor health, 2020: 9.9% (#374 of 384 MSAs)
> Adult smoking rate, 2020: 11.9% (#365 of 384 MSAs)
> Adult obesity rate, 2020: 23.9% (#379 of 384 MSAs)
> Median household income, 2021: $100,750 (#7 of 384 MSAs)

17. Washington-Arlington-Alexandria, DC-Virginia-Maryland-West Virginia
> Adults in fair or poor health, 2020: 10.8% (#356 of 384 MSAs)
> Adult smoking rate, 2020: 11.1% (#374 of 384 MSAs)
> Adult obesity rate, 2020: 28.5% (#342 of 384 MSAs)
> Median household income, 2021: $110,355 (#3 of 384 MSAs)

16. Fort Collins, Colorado
> Adults in fair or poor health, 2020: 9.3% (#381 of 384 MSAs)
> Adult smoking rate, 2020: 13.0% (#353 of 384 MSAs)
> Adult obesity rate, 2020: 23.9% (#377 of 384 MSAs)
> Median household income, 2021: $78,109 (#57 of 384 MSAs)

15. San Luis Obispo-Paso Robles, California
> Adults in fair or poor health, 2020: 12.3% (#291 of 384 MSAs)
> Adult smoking rate, 2020: 11.6% (#369 of 384 MSAs)
> Adult obesity rate, 2020: 27.9% (#353 of 384 MSAs)
> Median household income, 2021: $80,615 (#42 of 384 MSAs)

14. Santa Cruz-Watsonville, California
> Adults in fair or poor health, 2020: 13.2% (#255 of 384 MSAs)
> Adult smoking rate, 2020: 11.4% (#370 of 384 MSAs)
> Adult obesity rate, 2020: 27.5% (#357 of 384 MSAs)
> Median household income, 2021: $93,933 (#11 of 384 MSAs)

13. Seattle-Tacoma-Bellevue, Washington
> Adults in fair or poor health, 2020: 11.0% (#349 of 384 MSAs)
> Adult smoking rate, 2020: 11.6% (#368 of 384 MSAs)
> Adult obesity rate, 2020: 25.6% (#370 of 384 MSAs)
> Median household income, 2021: $101,721 (#5 of 384 MSAs)

12. Kahului-Wailuku-Lahaina, Hawaii
> Adults in fair or poor health, 2020: 11.0% (#344 of 384 MSAs)
> Adult smoking rate, 2020: 14.0% (#340 of 384 MSAs)
> Adult obesity rate, 2020: 23.9% (#377 of 384 MSAs)
> Median household income, 2021: $76,273 (#63 of 384 MSAs)

11. Burlington-South Burlington, Vermont
> Adults in fair or poor health, 2020: 9.1% (#383 of 384 MSAs)
> Adult smoking rate, 2020: 13.0% (#352 of 384 MSAs)
> Adult obesity rate, 2020: 24.5% (#374 of 384 MSAs)
> Median household income, 2021: $81,852 (#37 of 384 MSAs)

10. Urban Honolulu, HI
> Adults in fair or poor health, 2020: 11.4% (#326 of 384 MSAs)
> Adult smoking rate, 2020: 12.0% (#363 of 384 MSAs)
> Adult obesity rate, 2020: 24.3% (#375 of 384 MSAs)
> Median household income, 2021: $90,704 (#15 of 384 MSAs)

9. Santa Rosa-Petaluma, California
> Adults in fair or poor health, 2020: 12.3% (#291 of 384 MSAs)
> Adult smoking rate, 2020: 11.8% (#366 of 384 MSAs)
> Adult obesity rate, 2020: 25.2% (#372 of 384 MSAs)
> Median household income, 2021: $94,295 (#10 of 384 MSAs)

8. Ithaca, New York
> Adults in fair or poor health, 2020: 9.9% (#372 of 384 MSAs)
> Adult smoking rate, 2020: 14.7% (#327 of 384 MSAs)
> Adult obesity rate, 2020: 26.9% (#364 of 384 MSAs)
> Median household income, 2021: $66,441 (#137 of 384 MSAs)

7. Napa, California
> Adults in fair or poor health, 2020: 12.7% (#274 of 384 MSAs)
> Adult smoking rate, 2020: 11.1% (#372 of 384 MSAs)
> Adult obesity rate, 2020: 26.9% (#364 of 384 MSAs)
> Median household income, 2021: $97,213 (#8 of 384 MSAs)

6. Provo-Orem, Utah
> Adults in fair or poor health, 2020: 10.8% (#355 of 384 MSAs)
> Adult smoking rate, 2020: 6.8% (#384 of 384 MSAs)
> Adult obesity rate, 2020: 30.1% (#322 of 384 MSAs)
> Median household income, 2021: $86,629 (#22 of 384 MSAs)

5. Bridgeport-Stamford-Norwalk, Connecticut
> Adults in fair or poor health, 2020: 9.9% (#372 of 384 MSAs)
> Adult smoking rate, 2020: 10.5% (#376 of 384 MSAs)
> Adult obesity rate, 2020: 23.5% (#381 of 384 MSAs)
> Median household income, 2021: $100,810 (#6 of 384 MSAs)

4. Corvallis, Oregon
> Adults in fair or poor health, 2020: 11.1% (#341 of 384 MSAs)
> Adult smoking rate, 2020: 12.7% (#357 of 384 MSAs)
> Adult obesity rate, 2020: 28.5% (#343 of 384 MSAs)
> Median household income, 2021: $64,163 (#167 of 384 MSAs)

3. San Francisco-Oakland-Berkeley, California
> Adults in fair or poor health, 2020: 11.2% (#334 of 384 MSAs)
> Adult smoking rate, 2020: 9.5% (#379 of 384 MSAs)
> Adult obesity rate, 2020: 23.8% (#380 of 384 MSAs)
> Median household income, 2021: $116,005 (#2 of 384 MSAs)

2. Boulder, Colorado
> Adults in fair or poor health, 2020: 8.5% (#384 of 384 MSAs)
> Adult smoking rate, 2020: 11.3% (#371 of 384 MSAs)
> Adult obesity rate, 2020: 17.6% (#384 of 384 MSAs)
> Median household income, 2021: $90,168 (#16 of 384 MSAs)

1. San Jose-Sunnyvale-Santa Clara, California
> Adults in fair or poor health, 2020: 10.7% (#360 of 384 MSAs)
> Adult smoking rate, 2020: 8.5% (#383 of 384 MSAs)
> Adult obesity rate, 2020: 20.9% (#383 of 384 MSAs)
> Median household income, 2021: $139,892 (#1 of 384 MSAs)
Methodology
To determine the healthiest cities in the United States, 24/7 Tempo reviewed county-level data from the 2023 County Health Rankings & Roadmaps program of the University of Wisconsin Population Health Institute. Metropolitan statistical areas were ranked based on an index consisting of eight health measures, all using data from the CHR.
The measures are: The years of potential life lost before age 75 per 100,000 residents from 2018 to 2020; the percentage of adults reporting fair or poor health in 2020; the average number of physically unhealthy days reported in the last 30 days in 2020; the percentage of live births with low birthweight from 2014 to 2020; the percentage of adults who are current smokers in 2020; the percentage of adults reporting a body mass index of 30 or greater in 2020; the number of preventable hospital stays for ambulatory-care sensitive conditions per 100,000 Medicare enrollees in 2020; and the number of deaths due to injury per 100,000 residents from 2016 to 2020.
All data was aggregated from the county level to the metropolitan level using boundary definitions from the U.S. Census Bureau and was weighted by county population. Supplemental data on median household income is from the Census Bureau’s 2021 American Community Survey and are one-year estimates.