
“Location, location, location” matters not just in real estate, but also in health. Factors such as quality of the local health care system, public health policy, culture, environment, and the economy can all have an impact on the overall health of a population. In some cities, these factors are more conducive to a healthier population, while in others they may contribute to poorer health outcomes.
For example, urban populations in most states consistently fare better in terms of health than their rural counterparts, although the difference also varies between and within states. Similarly, job opportunities and access to health care differ greatly between cities, contributing to differences in health outcomes. (Here are American cities with the most private hospitals.)
To measure and rank the health of the population in cities in every state, 24/7 Tempo calculated an index using eight health measures such as potential life lost, smoking rate, and percentage reporting fair or poor health, using data from the 2023 County Health Rankings & Roadmaps program of the University of Wisconsin Population Health Institute. In all, 384 metro areas were considered to determine the least healthy one in every state. Rhode Island, New Hampshire, Vermont, and Delaware each have only one metro area, and it is therefore listed here by default – though by default, it is also the state’s healthiest metro area. (Note that the cities listed for some states are core cities for metro areas that extend across state borders; these are identified as such.)
Mobile, Alabama; Elmira, New York; Springfield, Ohio; and Yakima, Washington are some examples of the unhealthiest cities in their states, and like all but five cities on the list, have a lower median annual household income than the state as a whole. Still, the range of median household income is wide, from $38,737 in Beckley, West Virginia, to $91,627 in the Manchester-Nashua, New Hampshire, metro area.
When it comes to health habits and outcomes, the adult smoking rate ranges from 9.3% in St. George, Utah, which ranks as the 42nd healthiest city nationwide, to 25.8% in Beckley, which ranks as the least healthy city nationwide. Similarly, the adult obesity rate ranges from 23.9% in Kahului-Wailuku-Lahaina, Hawaii, which ranks as the 12th healthiest city nationwide, to 42.9% in Pine Bluff, Arkansas, which ranks as the third unhealthiest city nationwide. (These are America’s least healthy cities.)

Alabama: Mobile
> Adults in fair or poor health: 19.9% (state: 18.9%)
> Adult smoking rate: 20.5% (state: 19.5%)
> Adult obesity rate: 39.5% (state: 39.3%)
> Median household income: $49,691 (state: $53,913)

Alaska: Anchorage
> Adults in fair or poor health: 11.5% (state: 12.2%)
> Adult smoking rate: 16.4% (state: 18.0%)
> Adult obesity rate: 30.0% (state: 31.8%)
> Median household income: $84,476 (state: $77,845)

Arizona: Lake Havasu City-Kingman
> Adults in fair or poor health: 16.7% (state: 14.5%)
> Adult smoking rate: 21.0% (state: 13.7%)
> Adult obesity rate: 35.7% (state: 31.5%)
> Median household income: $46,616 (state: $69,056)

Arkansas: Pine Bluff
> Adults in fair or poor health: 22.8% (state: 19.4%)
> Adult smoking rate: 23.1% (state: 21.6%)
> Adult obesity rate: 42.9% (state: 37.2%)
> Median household income: $46,826 (state: $52,528)

California: Bakersfield
> Adults in fair or poor health: 21.2% (state: 14.4%)
> Adult smoking rate: 15.1% (state: 9.0%)
> Adult obesity rate: 35.0% (state: 30.2%)
> Median household income: $58,217 (state: $84,907)

Colorado: Pueblo
> Adults in fair or poor health: 15.5% (state: 10.2%)
> Adult smoking rate: 17.6% (state: 12.6%)
> Adult obesity rate: 29.6% (state: 24.2%)
> Median household income: $56,689 (state: $82,254)

Connecticut: New Haven-Milford
> Adults in fair or poor health: 11.6% (state: 11.0%)
> Adult smoking rate: 15.4% (state: 12.6%)
> Adult obesity rate: 33.3% (state: 29.5%)
> Median household income: $75,295 (state: $83,771)

Delaware: Dover
> Adults in fair or poor health: 14.6% (state: 12.8%)
> Adult smoking rate: 20.0% (state: 15.8%)
> Adult obesity rate: 39.1% (state: 36.2%)
> Median household income: $64,308 (state: $71,091)

Florida: Ocala
> Adults in fair or poor health: 17.8% (state: 13.3%)
> Adult smoking rate: 20.8% (state: 15.5%)
> Adult obesity rate: 38.2% (state: 28.3%)
> Median household income: $55,161 (state: $63,062)

Georgia: Albany
> Adults in fair or poor health: 20.0% (state: 15.1%)
> Adult smoking rate: 21.1% (state: 16.3%)
> Adult obesity rate: 41.4% (state: 34.3%)
> Median household income: $48,659 (state: $66,559)

Hawaii: Kahului-Wailuku-Lahaina
> Adults in fair or poor health: 11.0% (state: 10.3%)
> Adult smoking rate: 14.0% (state: 12.2%)
> Adult obesity rate: 23.9% (state: 25.0%)
> Median household income: $76,273 (state: $84,857)

Idaho: Pocatello
> Adults in fair or poor health: 13.6% (state: 11.8%)
> Adult smoking rate: 18.2% (state: 14.2%)
> Adult obesity rate: 36.3% (state: 31.3%)
> Median household income: $60,475 (state: $66,474)

Illinois: Danville
> Adults in fair or poor health: 16.7% (state: 12.3%)
> Adult smoking rate: 22.1% (state: 12.8%)
> Adult obesity rate: 38.2% (state: 32.5%)
> Median household income: $49,091 (state: $72,205)

Indiana: Muncie
> Adults in fair or poor health: 17.3% (state: 15.1%)
> Adult smoking rate: 22.5% (state: 20.2%)
> Adult obesity rate: 40.1% (state: 37.2%)
> Median household income: $50,497 (state: $62,743)

Iowa: Davenport-Moline-Rock Island, Iowa/Illinois
> Adults in fair or poor health: 12.9% (state: 12.0%)
> Adult smoking rate: 16.8% (state: 16.8%)
> Adult obesity rate: 36.3% (state: 37.2%)
> Median household income: $61,166 (state: $65,600)

Kansas: Topeka
> Adults in fair or poor health: 13.1% (state: 12.8%)
> Adult smoking rate: 17.7% (state: 17.2%)
> Adult obesity rate: 37.5% (state: 35.8%)
> Median household income: $57,474 (state: $64,124)

Kentucky: Bowling Green
> Adults in fair or poor health: 18.9% (state: 19.5%)
> Adult smoking rate: 22.1% (state: 22.2%)
> Adult obesity rate: 37.6% (state: 37.0%)
> Median household income: $57,057 (state: $55,573)

Louisiana: Monroe
> Adults in fair or poor health: 20.8% (state: 19.0%)
> Adult smoking rate: 21.2% (state: 18.9%)
> Adult obesity rate: 42.5% (state: 38.3%)
> Median household income: $45,001 (state: $52,087)

Maine: Bangor
> Adults in fair or poor health: 12.6% (state: 11.1%)
> Adult smoking rate: 20.2% (state: 18.0%)
> Adult obesity rate: 34.3% (state: 31.3%)
> Median household income: $56,250 (state: $64,767)

Maryland: Hagerstown-Martinsburg, Maryland/West Virginia
> Adults in fair or poor health: 15.1% (state: 10.6%)
> Adult smoking rate: 20.4% (state: 11.1%)
> Adult obesity rate: 37.7% (state: 30.9%)
> Median household income: $67,372 (state: $90,203)

Massachusetts: Springfield
> Adults in fair or poor health: 12.9% (state: 10.8%)
> Adult smoking rate: 15.4% (state: 11.4%)
> Adult obesity rate: 29.2% (state: 24.5%)
> Median household income: $65,520 (state: $89,645)

Michigan: Flint
> Adults in fair or poor health: 16.8% (state: 14.7%)
> Adult smoking rate: 22.2% (state: 19.3%)
> Adult obesity rate: 42.1% (state: 35.3%)
> Median household income: $52,025 (state: $63,498)

Minnesota: Duluth, Minnesota/Wisconsin
> Adults in fair or poor health: 11.7% (state: 10.0%)
> Adult smoking rate: 20.5% (state: 14.3%)
> Adult obesity rate: 33.0% (state: 30.6%)
> Median household income: $64,960 (state: $77,720)

Mississippi: Hattiesburg
> Adults in fair or poor health: 18.6% (state: 18.7%)
> Adult smoking rate: 19.4% (state: 20.7%)
> Adult obesity rate: 39.1% (state: 39.9%)
> Median household income: $55,444 (state: $48,716)

Missouri: St. Joseph, Missouri/Kansas
> Adults in fair or poor health: 16.2% (state: 15.2%)
> Adult smoking rate: 22.2% (state: 18.6%)
> Adult obesity rate: 37.3% (state: 34.2%)
> Median household income: $54,702 (state: $61,847)

Montana: Great Falls
> Adults in fair or poor health: 12.9% (state: 12.1%)
> Adult smoking rate: 18.6% (state: 17.5%)
> Adult obesity rate: 35.0% (state: 28.9%)
> Median household income: $57,706 (state: $63,249)

Nebraska: Grand Island
> Adults in fair or poor health: 12.8% (state: 10.2%)
> Adult smoking rate: 17.3% (state: 14.5%)
> Adult obesity rate: 39.1% (state: 34.0%)
> Median household income: $61,749 (state: $66,817)

Nevada: Carson City
> Adults in fair or poor health: 16.3% (state: 16.7%)
> Adult smoking rate: 18.4% (state: 14.1%)
> Adult obesity rate: 34.4% (state: 28.1%)
> Median household income: $65,330 (state: $66,274)

New Hampshire: Manchester-Nashua
> Adults in fair or poor health: 10.9% (state: 10.8%)
> Adult smoking rate: 14.1% (state: 14.7%)
> Adult obesity rate: 29.2% (state: 30.5%)
> Median household income: $91,627 (state: $88,465)

New Jersey: Vineland-Bridgeton
> Adults in fair or poor health: 17.8% (state: 10.8%)
> Adult smoking rate: 19.1% (state: 11.1%)
> Adult obesity rate: 35.7% (state: 27.7%)
> Median household income: $58,389 (state: $89,296)

New Mexico: Farmington
> Adults in fair or poor health: 17.7% (state: 13.8%)
> Adult smoking rate: 22.6% (state: 16.9%)
> Adult obesity rate: 35.0% (state: 31.7%)
> Median household income: $47,819 (state: $53,992)

New York: Elmira
> Adults in fair or poor health: 12.5% (state: 11.8%)
> Adult smoking rate: 19.1% (state: 12.3%)
> Adult obesity rate: 33.0% (state: 26.5%)
> Median household income: $60,219 (state: $74,314)

North Carolina: Rocky Mount
> Adults in fair or poor health: 17.5% (state: 13.5%)
> Adult smoking rate: 20.9% (state: 17.0%)
> Adult obesity rate: 39.0% (state: 33.6%)
> Median household income: $51,769 (state: $61,972)

North Dakota: Grand Forks, North Dakota/Minnesota
> Adults in fair or poor health: 11.6% (state: 11.6%)
> Adult smoking rate: 17.8% (state: 17.9%)
> Adult obesity rate: 35.9% (state: 33.6%)
> Median household income: $62,568 (state: $66,519)
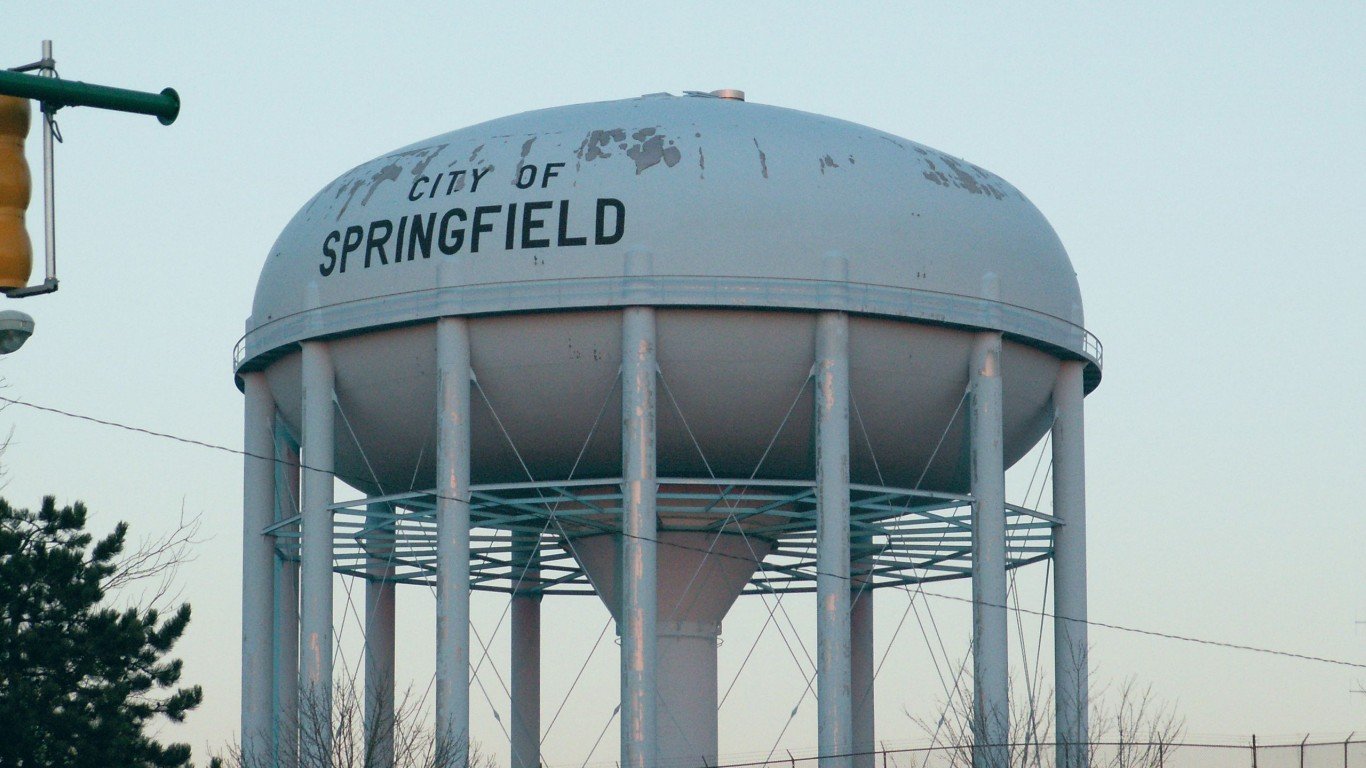
Ohio: Springfield
> Adults in fair or poor health: 16.3% (state: 14.5%)
> Adult smoking rate: 23.9% (state: 20.2%)
> Adult obesity rate: 36.7% (state: 35.8%)
> Median household income: $59,431 (state: $62,262)

Oklahoma: Lawton
> Adults in fair or poor health: 18.0% (state: 17.3%)
> Adult smoking rate: 20.7% (state: 19.6%)
> Adult obesity rate: 39.4% (state: 37.1%)
> Median household income: $49,422 (state: $55,826)

Oregon: Grants Pass
> Adults in fair or poor health: 15.8% (state: 12.7%)
> Adult smoking rate: 19.1% (state: 13.6%)
> Adult obesity rate: 30.4% (state: 28.3%)
> Median household income: $48,785 (state: $71,562)

Pennsylvania: Johnstown
> Adults in fair or poor health: 14.4% (state: 13.1%)
> Adult smoking rate: 20.8% (state: 16.7%)
> Adult obesity rate: 33.2% (state: 31.6%)
> Median household income: $52,995 (state: $68,957)

Rhode Island: Providence-Warwick, Rhode Island/Massaschusetts
> Adults in fair or poor health: 12.5% (state: 11.8%)
> Adult smoking rate: 15.7% (state: 14.1%)
> Adult obesity rate: 29.6% (state: 30.6%)
> Median household income: $73,788 (state: $74,008)

South Carolina: Florence
> Adults in fair or poor health: 18.4% (state: 15.9%)
> Adult smoking rate: 20.8% (state: 19.1%)
> Adult obesity rate: 41.7% (state: 36.7%)
> Median household income: $49,724 (state: $59,318)

South Dakota: Rapid City
> Adults in fair or poor health: 10.8% (state: 10.4%)
> Adult smoking rate: 18.0% (state: 19.0%)
> Adult obesity rate: 32.8% (state: 33.4%)
> Median household income: $63,342 (state: $66,143)

Tennessee: Memphis, Tennessee/Mississippi/Arkansas
> Adults in fair or poor health: 17.9% (state: 15.7%)
> Adult smoking rate: 19.1% (state: 19.7%)
> Adult obesity rate: 38.8% (state: 35.8%)
> Median household income: $55,840 (state: $59,695)
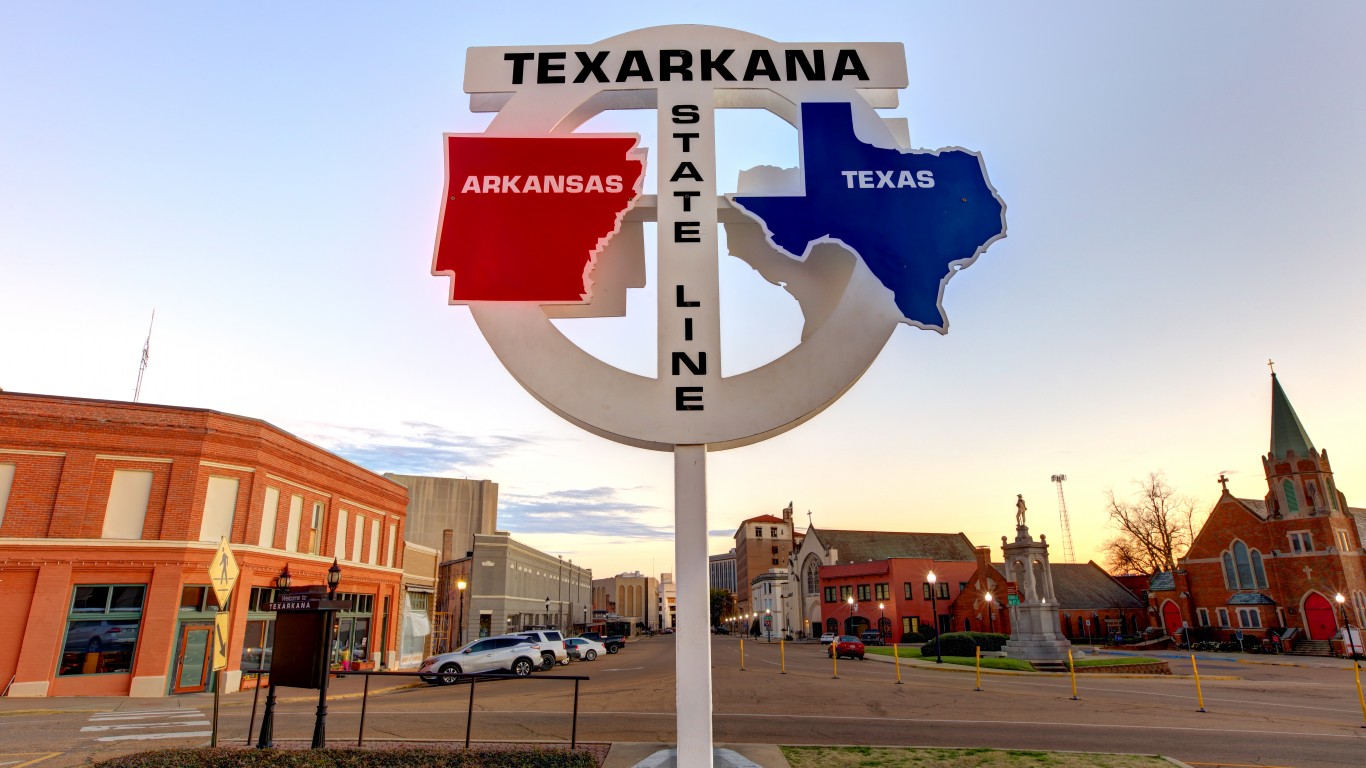
Texas: Texarkana, Texas/Arkansas
> Adults in fair or poor health: 19.1% (state: 15.7%)
> Adult smoking rate: 21.1% (state: 13.3%)
> Adult obesity rate: 38.6% (state: 35.8%)
> Median household income: $50,070 (state: $66,963)

Utah: St. George
> Adults in fair or poor health: 12.0% (state: 10.9%)
> Adult smoking rate: 9.3% (state: 8.3%)
> Adult obesity rate: 30.8% (state: 29.3%)
> Median household income: $61,186 (state: $79,449)

Vermont: Burlington-South Burlington
> Adults in fair or poor health: 9.1% (state: 10.6%)
> Adult smoking rate: 13.0% (state: 14.4%)
> Adult obesity rate: 24.5% (state: 26.3%)
> Median household income: $81,852 (state: $72,431)

Virginia: Roanoke
> Adults in fair or poor health: 14.6% (state: 12.4%)
> Adult smoking rate: 18.6% (state: 13.9%)
> Adult obesity rate: 35.0% (state: 32.4%)
> Median household income: $59,630 (state: $80,963)

Washington: Yakima
> Adults in fair or poor health: 19.2% (state: 11.8%)
> Adult smoking rate: 17.5% (state: 11.6%)
> Adult obesity rate: 37.1% (state: 28.0%)
> Median household income: $61,012 (state: $84,247)

West Virginia: Beckley, WV
> Adults in fair or poor health: 21.7% (state: 20.0%)
> Adult smoking rate: 25.8% (state: 24.0%)
> Adult obesity rate: 41.8% (state: 39.6%)
> Median household income: $38,737 (state: $51,248)

Wisconsin: Janesville-Beloit
> Adults in fair or poor health: 12.1% (state: 12.4%)
> Adult smoking rate: 18.4% (state: 16.1%)
> Adult obesity rate: 35.1% (state: 32.7%)
> Median household income: $66,090 (state: $67,125)

Wyoming: Casper
> Adults in fair or poor health: 12.2% (state: 11.5%)
> Adult smoking rate: 20.3% (state: 19.4%)
> Adult obesity rate: 34.0% (state: 30.6%)
> Median household income: $63,605 (state: $65,204)
Methodology
To determine the least healthy city in every state, 24/7 Tempo reviewed county-level data from the 2023 County Health Rankings & Roadmaps program of the University of Wisconsin Population Health Institute. Metropolitan statistical areas were ranked based on an index consisting of eight health measures, all using data from the CHR.
The measures are: years of potential life lost before age 75 per 100,000 residents from 2018 to 2020; percentage of adults reporting fair or poor health in 2020; average number of physically unhealthy days reported in the last 30 days in 2020; percentage of live births with low birthweight from 2014 to 2020; percentage of adults who were current smokers in 2020; percentage of adults reporting a body mass index of 30 or greater in 2020; number of preventable hospital stays for ambulatory-care-sensitive conditions per 100,000 Medicare enrollees in 2020; and number of deaths due to injury per 100,000 residents from 2016 to 2020.
All data was aggregated from the county level to the metropolitan level using boundary definitions from the U.S. Census Bureau and was weighted by county population. Supplemental data on median household income is from the Census Bureau’s 2021 American Community Survey and are one-year estimates. Note that four states – Rhode Island, New Hampshire, Vermont, and Delaware – each have only one metropolitan area, which is listed here by default.