
Does the location where you reside have a massive impact on your level of activity? Research shows there are certain cities across the United States that are much less active than others.
There are many reasons why residents in certain cities might not be as active as they should be. How walkable a city’s landscape is can be a major factor. Folks who can walk to grocery stores, movie theaters, or coffee shops with ease will naturally rack up more steps throughout their day. Others forced to drive cars or take modes of public transit simply have a harder time reaching the goal number of 10,000 steps per day.
Another factor at play is the cost of living in various cities. If paying rent and taking care of other bills is overwhelming to a person, their work hours will be prioritized over their fitness time. Stressing over finances often results in people spending more time on the job to make ends meet instead of focusing on their fitness plans. Those who live affordable lifestyles can shift their focus to exercise routines, but that isn’t the case for everyone.
A third factor revolves around how many exercise facilities and fast food restaurants are located in any particular city. If there are more fast food joints than gyms, it’s easy for a person’s health status to get thrown off track. Staying in good shape certainly requires dedication and determination. The harsh reality is that people who live in inactive cities have higher rates of obesity with shorter life expectancies. It’s still possible to live fulfilling and healthy lives in inactive cities, but it’ll be a bit more challenging. (On the topic of health and wellness, see a ranking of all 50 states based on exercise.)
To determine America’s most inactive metros, 24/7 Tempo reviewed adult physical inactivity rates from the Robert Wood Johnson Foundation and the University of Wisconsin Population Health Institute joint program’s 2023 County Health Rankings and Roadmaps report. The physical inactivity rate is defined as the share of adults 20 years and older who report no leisure-time physical activity. We used the 384 metropolitan statistical areas as delineated by the United States Office of Management and Budget and used by the Census Bureau as our definition of metros. Additional information on the share of adults 20 years and older who report a body mass index of 30 kg/m2 or higher (considered obese), the share of adults reporting poor or fair health, and the life expectancy at birth also came from the 2023 CHR.
50. Elizabethtown-Fort Knox, Kentucky
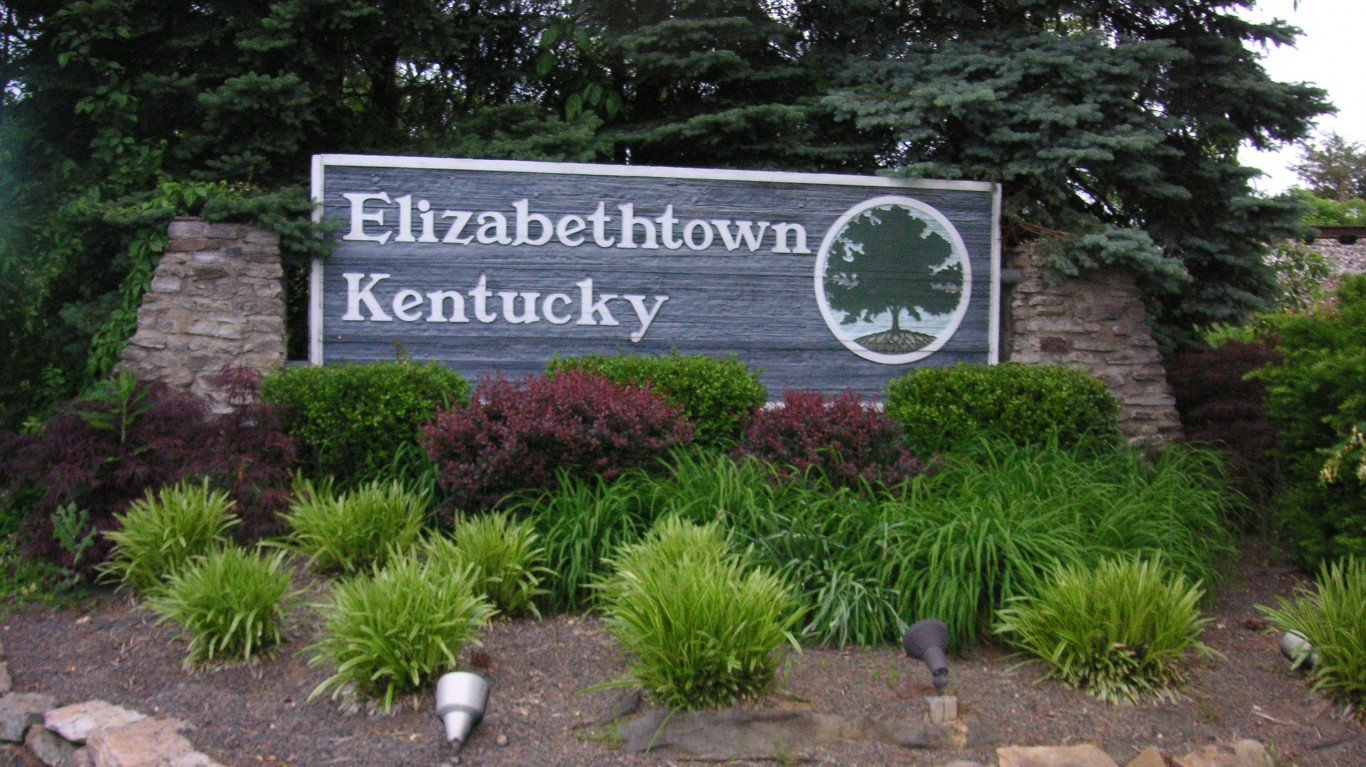
- Adults who don’t exercise: 28.4%
- Adult obesity rate: 39.2% — #43 out of 384 metro areas
- Adults in poor or fair health: 17.8% — #67 out of 384 metro areas
- Life expectancy: 75.8 years — #302 out of 384 metro areas
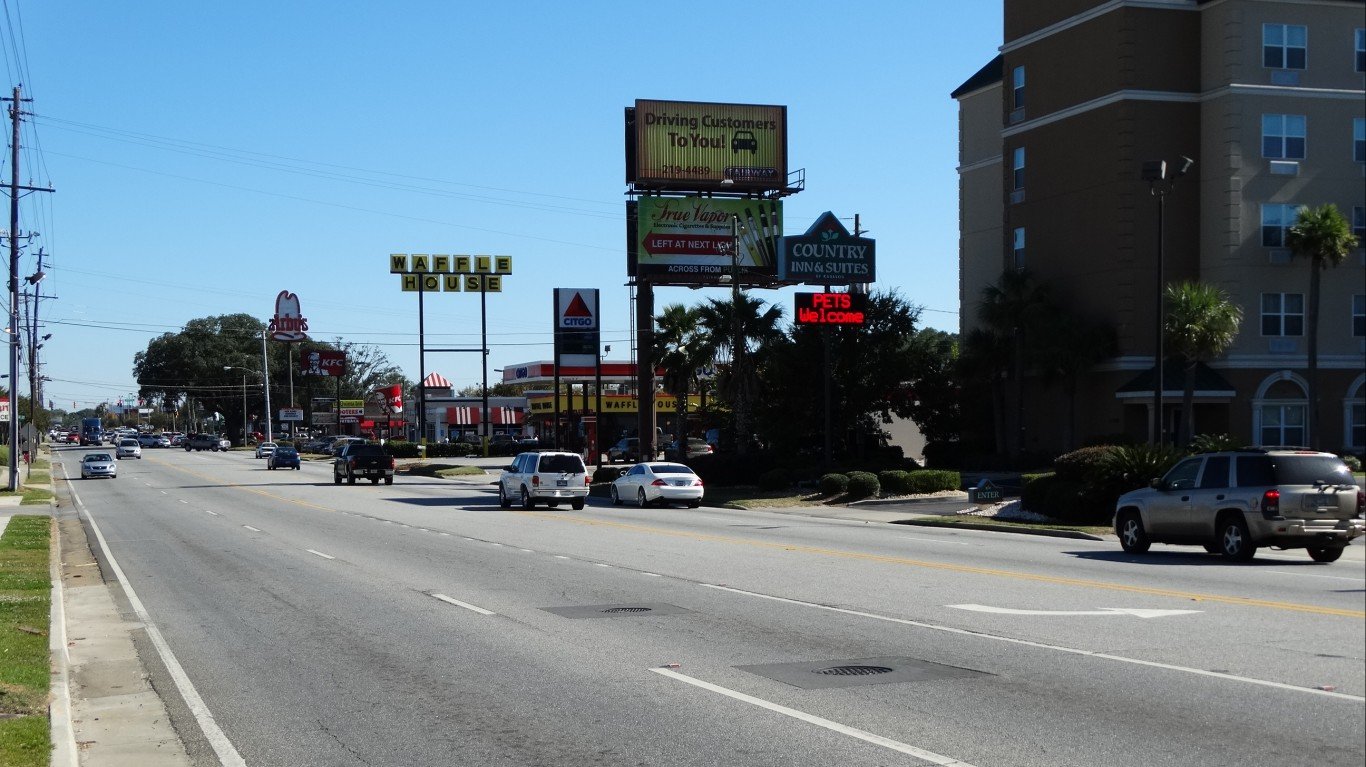
49. Hattiesburg, Mississippi

- Adults who don’t exercise: 28.4%
- Adult obesity rate: 39.1% — #44 out of 384 metro areas
- Adults in poor or fair health: 18.6% — #47 out of 384 metro areas
- Life expectancy: 75.1 years — #339 out of 384 metro areas
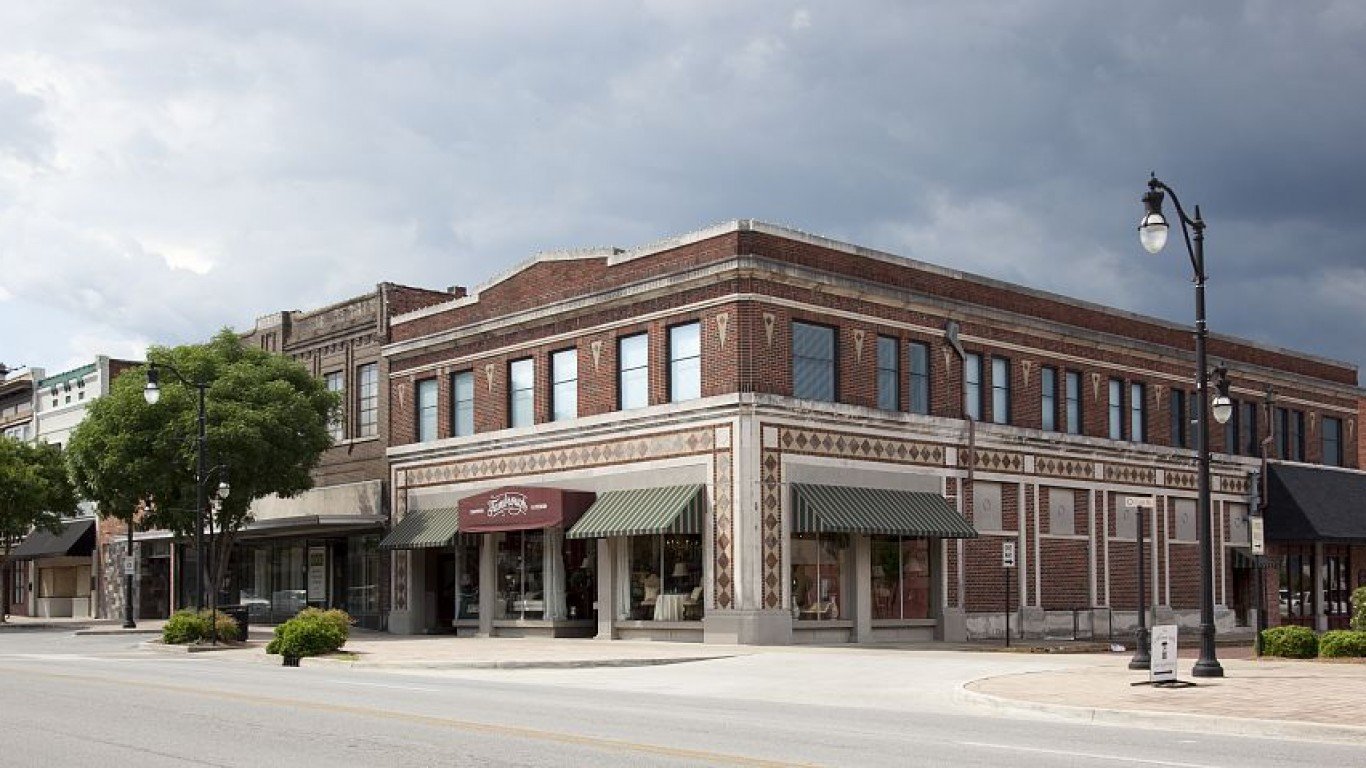
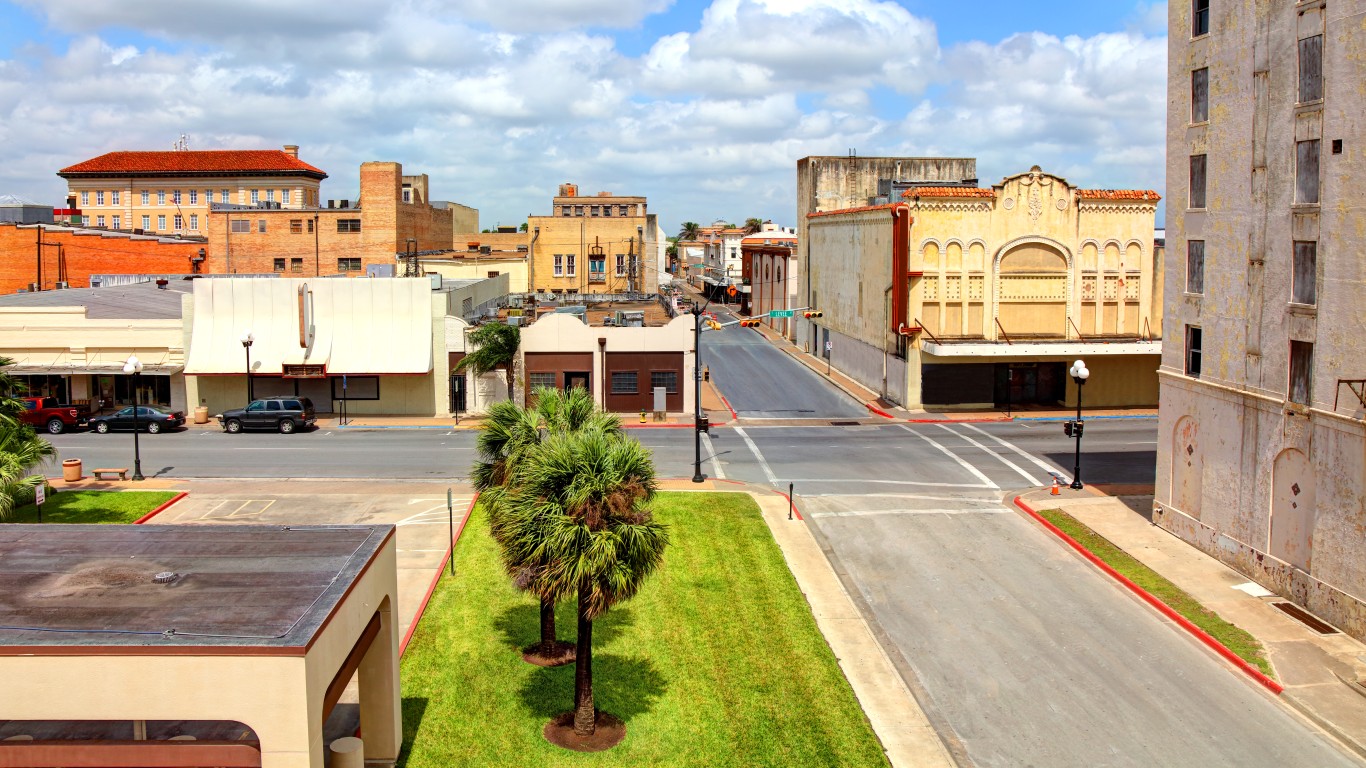
48. Victoria, Texas
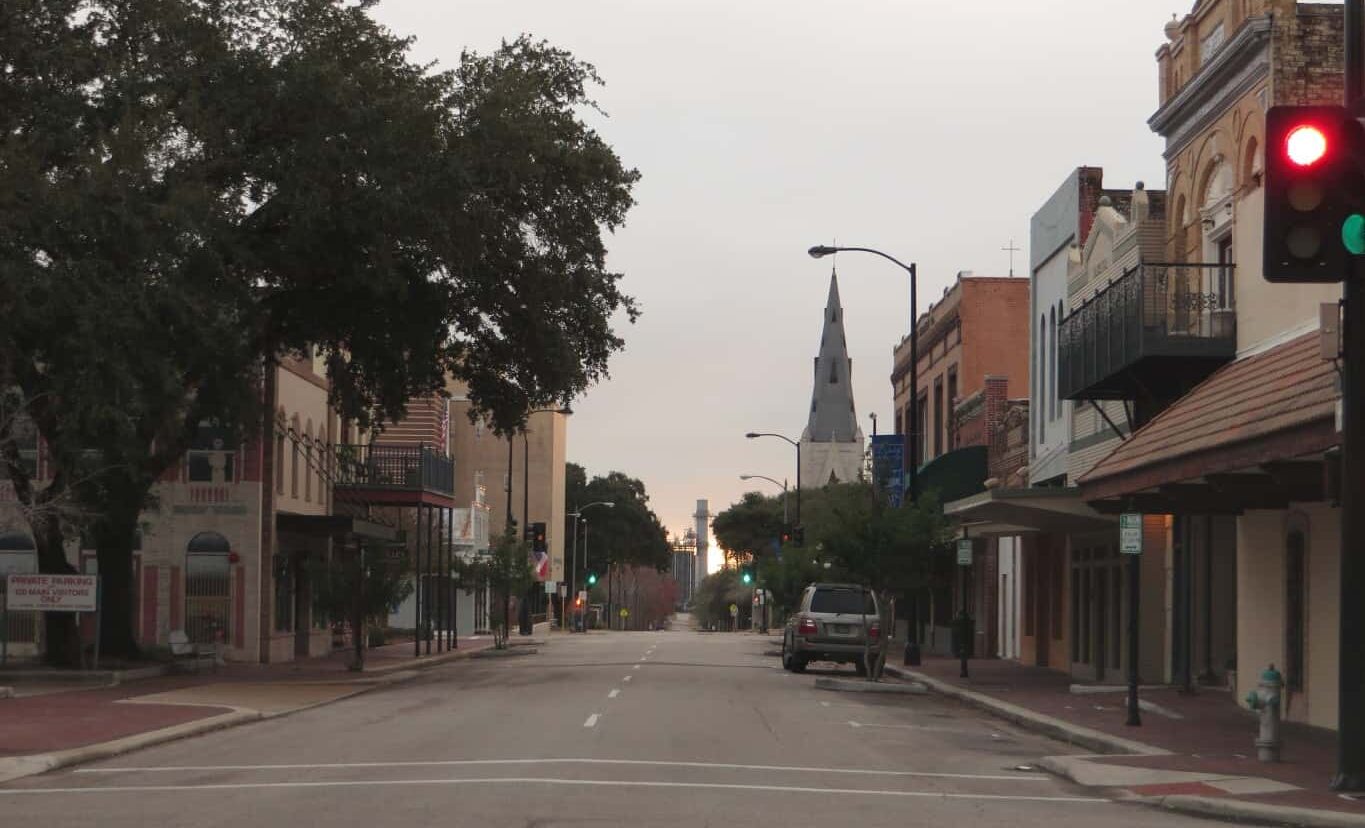
Victoria is a city in the U.S. state of Texas. It is the county seat of Victoria County. The population was 86,793 as of the 2010 census. The three counties of the Victoria Metropolitan Statistical Area had a population of 111,163 as of the 2000 census. Victoria is located 30 miles inland from the Gulf of Mexico. The city is a regional hub for a seven-county area known as the "Golden Crescent", and serves a retail trade area of over 250,000 people. Victoria is known as "The Crossroads" because of its location within a two-hour drive of Corpus Christi, Houston, San Antonio, and Austin. Victoria is named for General Guadalupe Victoria, who became the first president of independent Mexico. Victoria is the cathedral city of the Roman Catholic Diocese of Victoria in Texas. Victoria is located on the coastal plains of Texas about 50 miles from the Gulf of Mexico and 20 miles from the nearest bay waters. It lies along and just to the east of the Guadalupe River. The top...
- Adults who don’t exercise: 28.6%
- Adult obesity rate: 38.2% — #80 out of 384 metro areas
- Adults in poor or fair health: 19.2% — #32 out of 384 metro areas
- Life expectancy: 77.5 years — #207 out of 384 metro areas
47. Lexington-Fayette, Kentucky
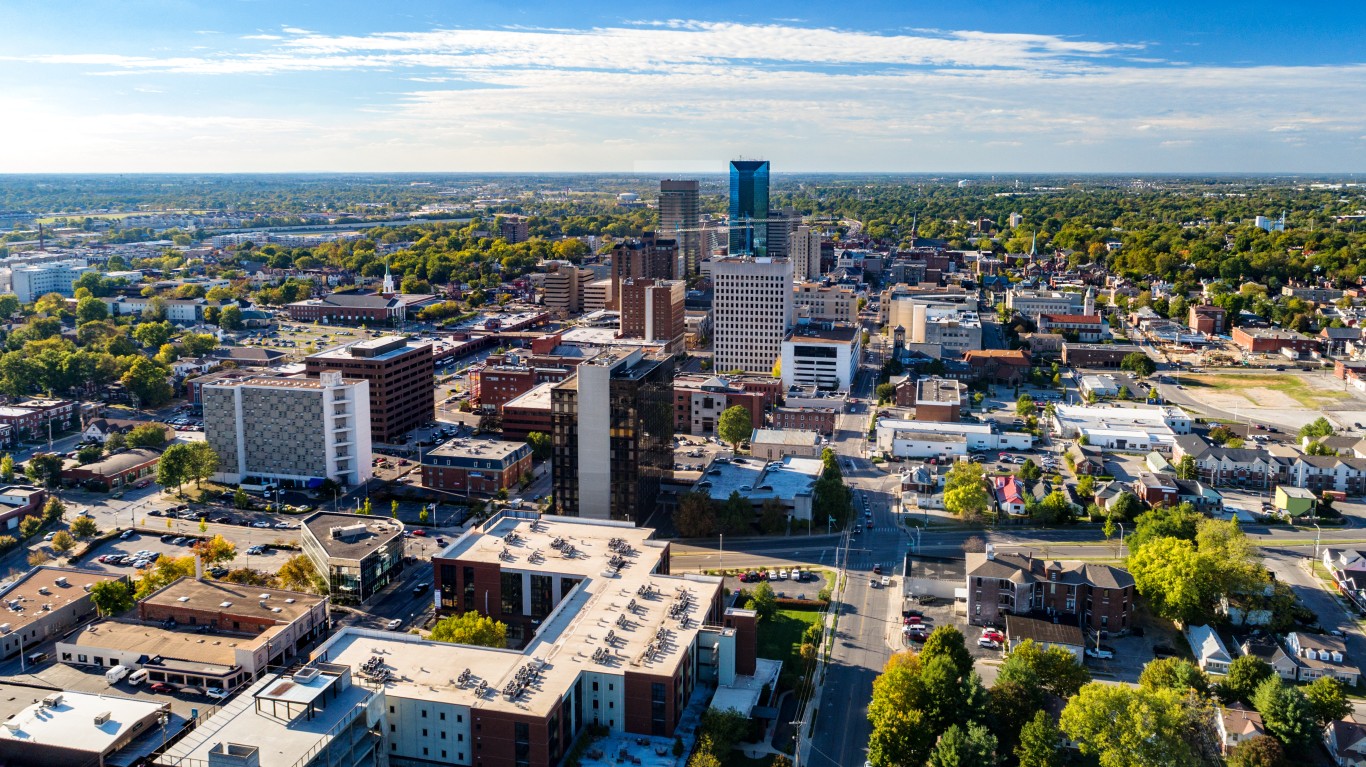
- Adults who don’t exercise: 28.6%
- Adult obesity rate: 34.1% — #217 out of 384 metro areas
- Adults in poor or fair health: 16.4% — #108 out of 384 metro areas
- Life expectancy: 77.4 years — #218 out of 384 metro areas
46. Lafayette, Louisiana

- Adults who don’t exercise: 28.6%
- Adult obesity rate: 37.0% — #110 out of 384 metro areas
- Adults in poor or fair health: 18.1% — #58 out of 384 metro areas
- Life expectancy: 76.2 years — #286 out of 384 metro areas
45. Macon-Bibb County, Georgia
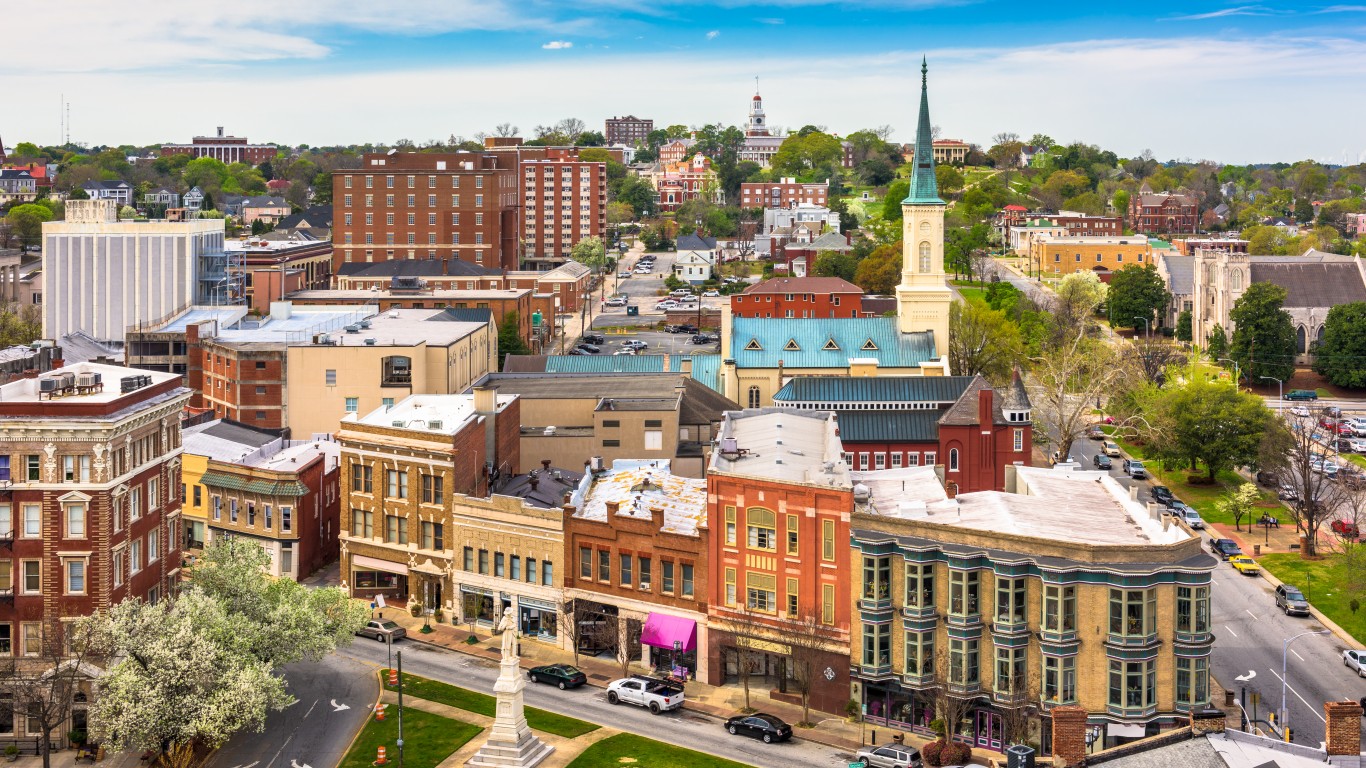
- Adults who don’t exercise: 28.7%
- Adult obesity rate: 38.9% — #58 out of 384 metro areas
- Adults in poor or fair health: 19.0% — #39 out of 384 metro areas
- Life expectancy: 74.1 years — #368 out of 384 metro areas
44. Lake Havasu City-Kingman, Arizona

- Adults who don’t exercise: 28.7%
- Adult obesity rate: 35.7% — #160 out of 384 metro areas
- Adults in poor or fair health: 16.7% — #99 out of 384 metro areas
- Life expectancy: 75.5 years — #319 out of 384 metro areas
43. Merced, California

- Adults who don’t exercise: 28.9%
- Adult obesity rate: 38.0% — #85 out of 384 metro areas
- Adults in poor or fair health: 21.7% — #9 out of 384 metro areas
- Life expectancy: 78.2 years — #164 out of 384 metro areas
42. Owensboro, Kentucky
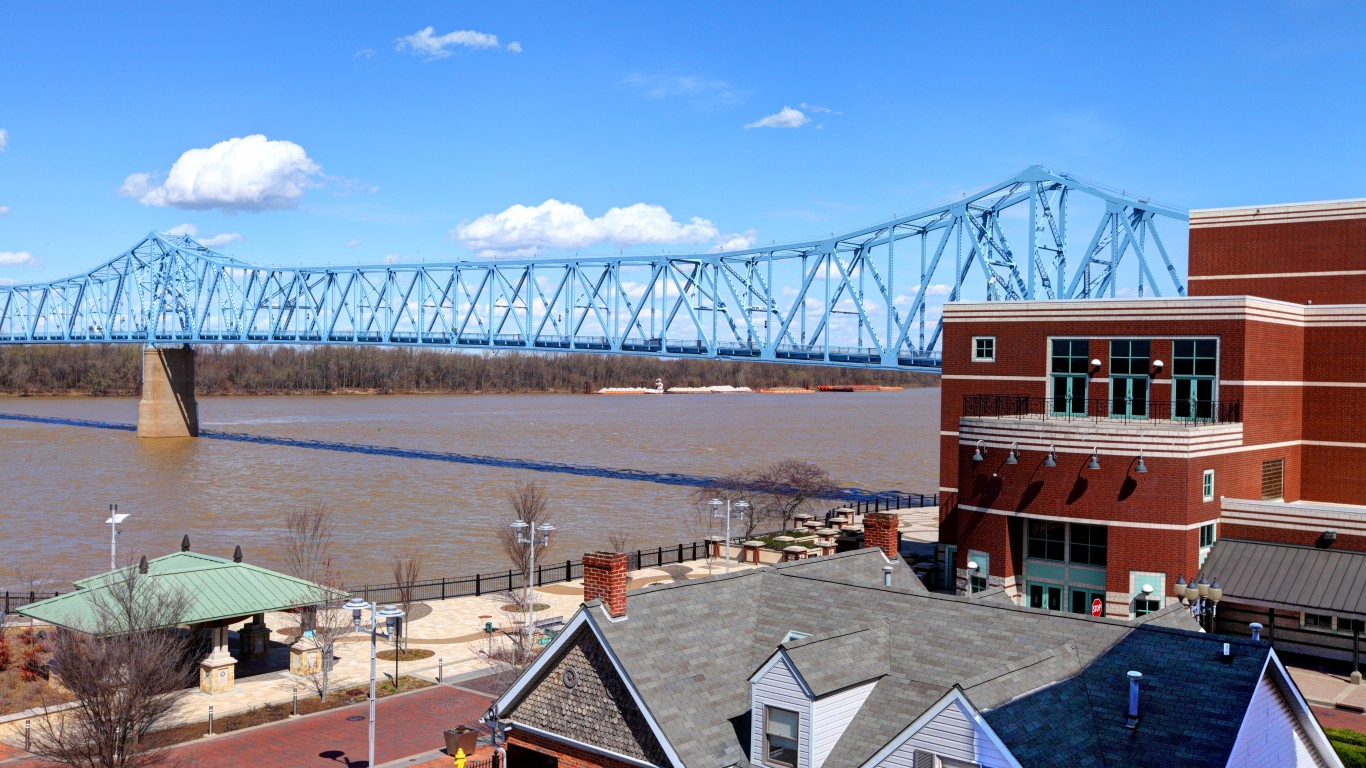
- Adults who don’t exercise: 28.9%
- Adult obesity rate: 39.1% — #46 out of 384 metro areas
- Adults in poor or fair health: 18.2% — #55 out of 384 metro areas
- Life expectancy: 76.4 years — #280 out of 384 metro areas
41. Miami-Fort Lauderdale-Pompano Beach, Florida

- Adults who don’t exercise: 29.0%
- Adult obesity rate: 29.6% — #329 out of 384 metro areas
- Adults in poor or fair health: 17.4% — #81 out of 384 metro areas
- Life expectancy: 81.5 years — #27 out of 384 metro areas
40. Springfield, Ohio
- Adults who don’t exercise: 29.0%
- Adult obesity rate: 36.7% — #120 out of 384 metro areas
- Adults in poor or fair health: 16.3% — #113 out of 384 metro areas
- Life expectancy: 73.9 years — #373 out of 384 metro areas
39. Montgomery, Alabama

- Adults who don’t exercise: 29.0%
- Adult obesity rate: 44.4% — #2 out of 384 metro areas
- Adults in poor or fair health: 19.1% — #34 out of 384 metro areas
- Life expectancy: 75.3 years — #328 out of 384 metro areas
38. Visalia, California

- Adults who don’t exercise: 29.1%
- Adult obesity rate: 36.0% — #147 out of 384 metro areas
- Adults in poor or fair health: 22.8% — #7 out of 384 metro areas
- Life expectancy: 77.8 years — #194 out of 384 metro areas
37. Hinesville, Georgia
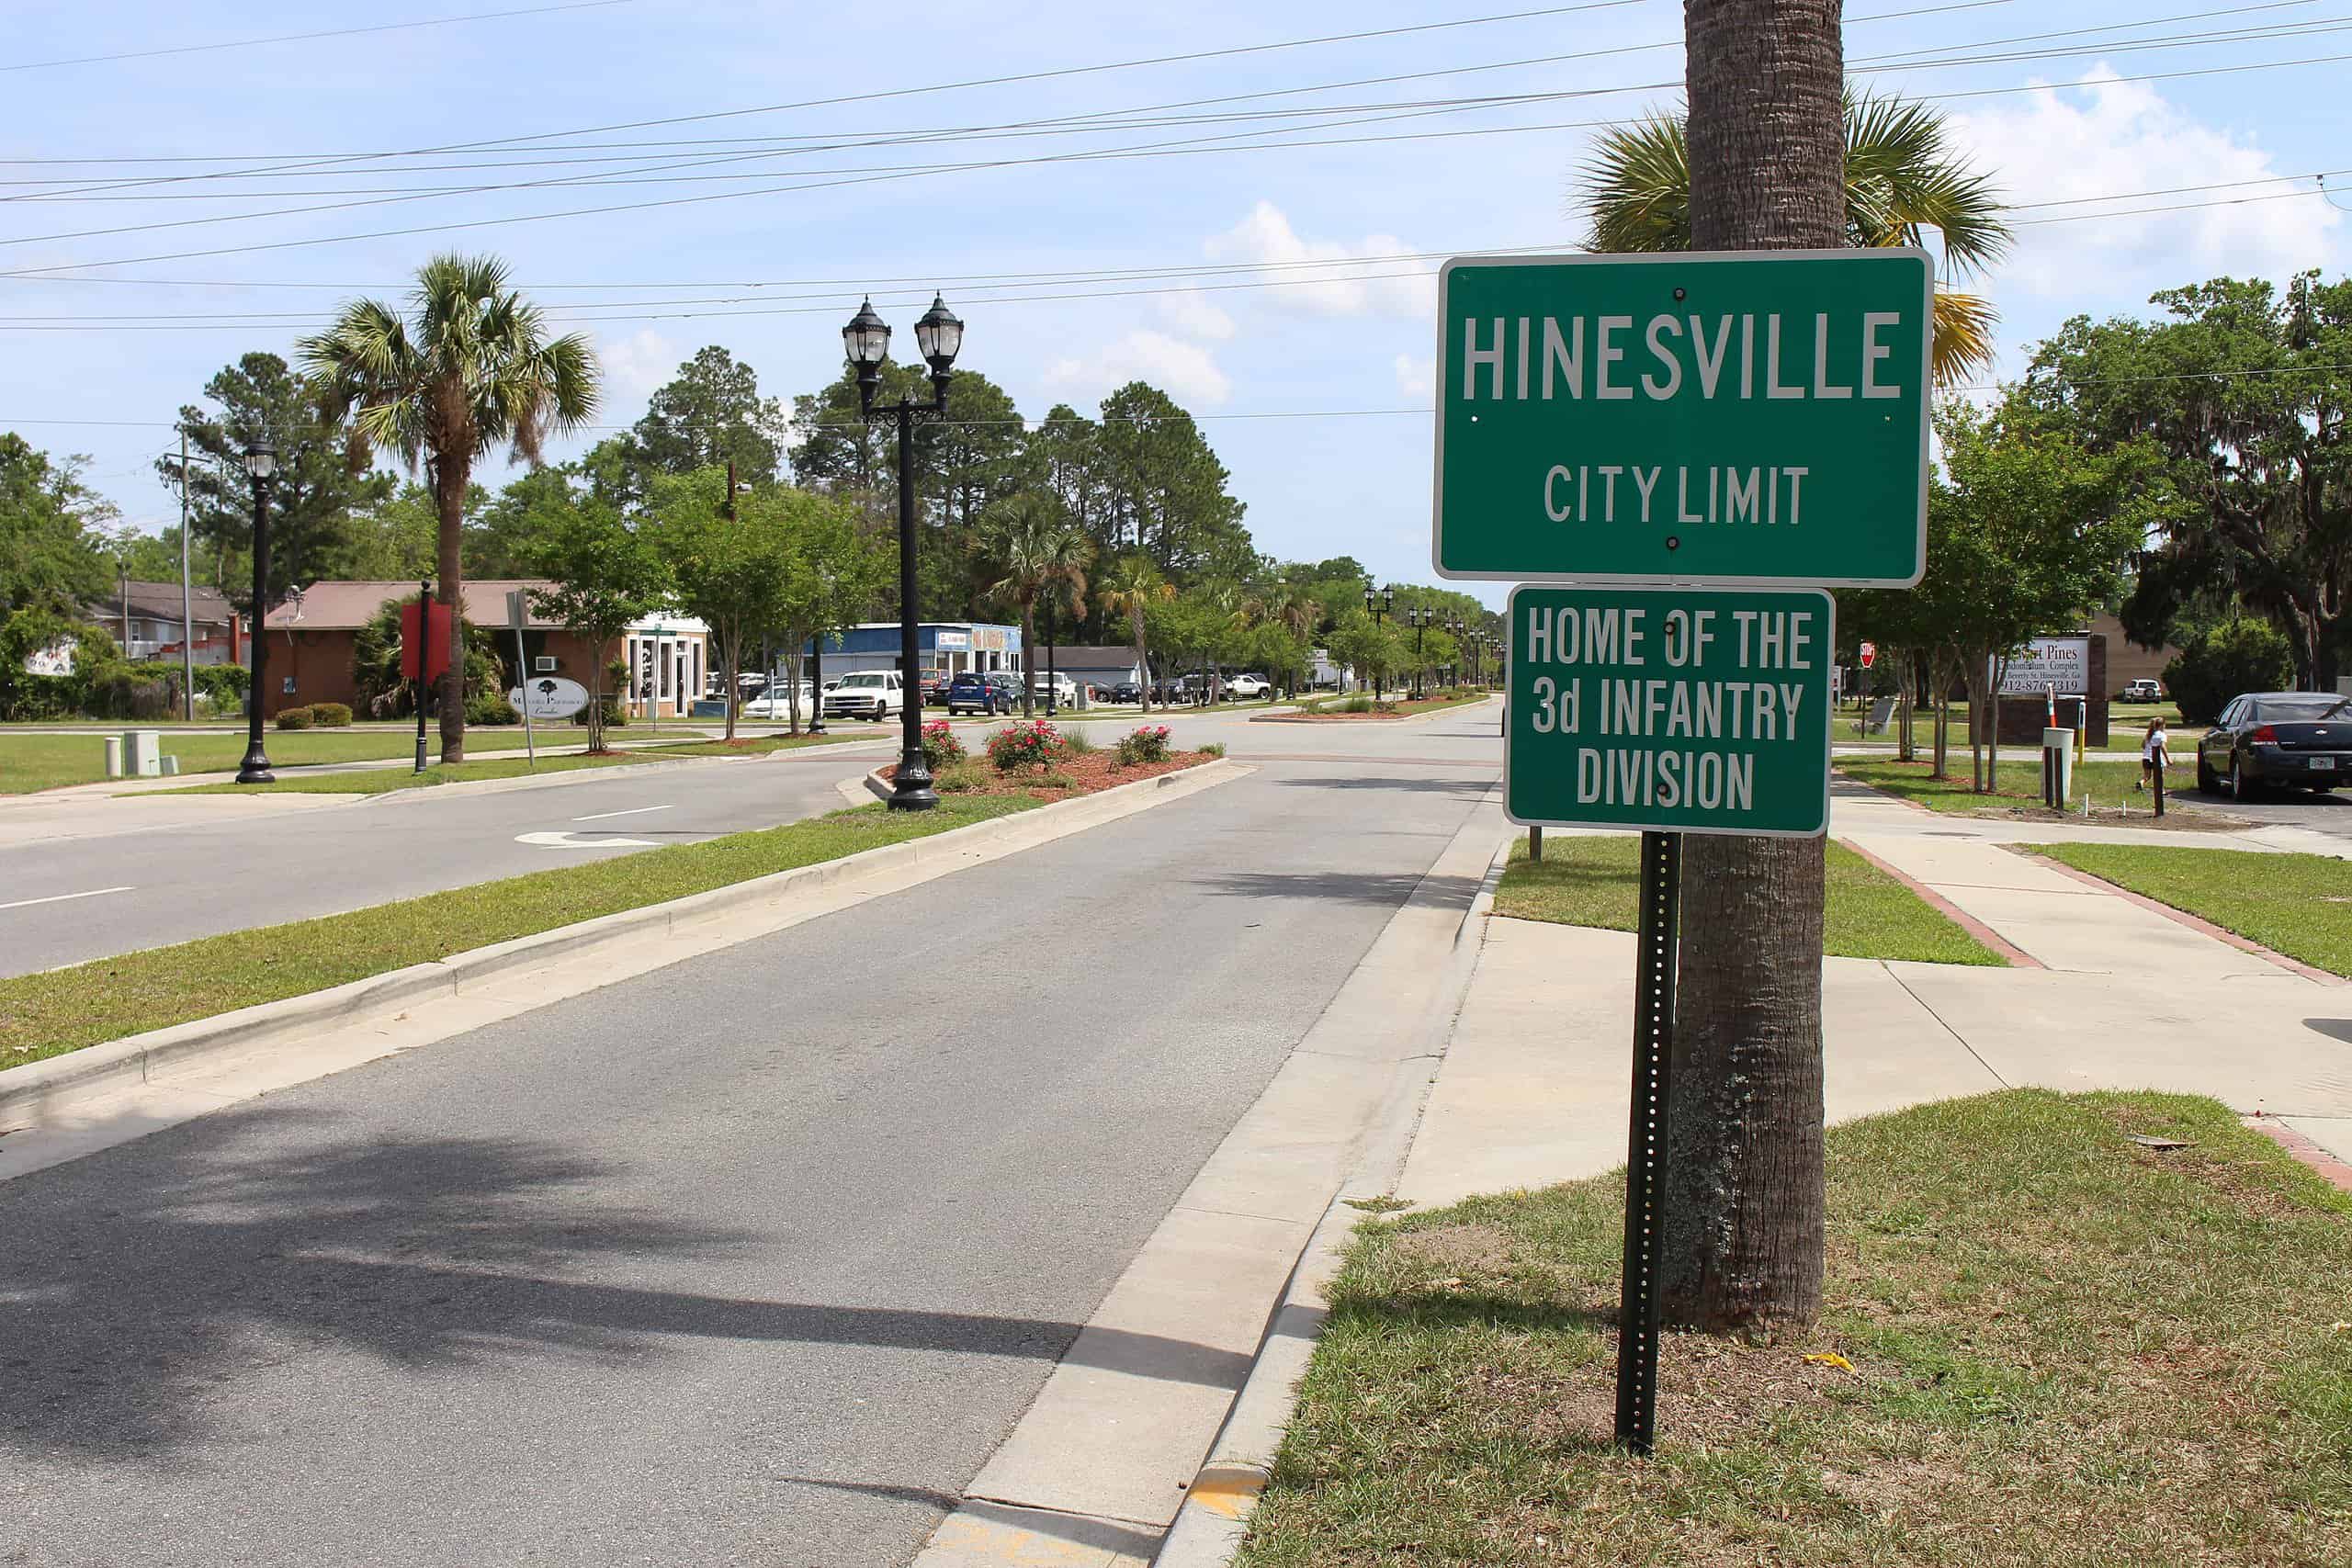
- Adults who don’t exercise: 29.1%
- Adult obesity rate: 40.7% — #22 out of 384 metro areas
- Adults in poor or fair health: 18.3% — #52 out of 384 metro areas
- Life expectancy: 76.5 years — #273 out of 384 metro areas
36. Columbus, Georgia-Alabama

- Adults who don’t exercise: 29.2%
- Adult obesity rate: 38.4% — #72 out of 384 metro areas
- Adults in poor or fair health: 18.5% — #48 out of 384 metro areas
- Life expectancy: 74.3 years — #361 out of 384 metro areas
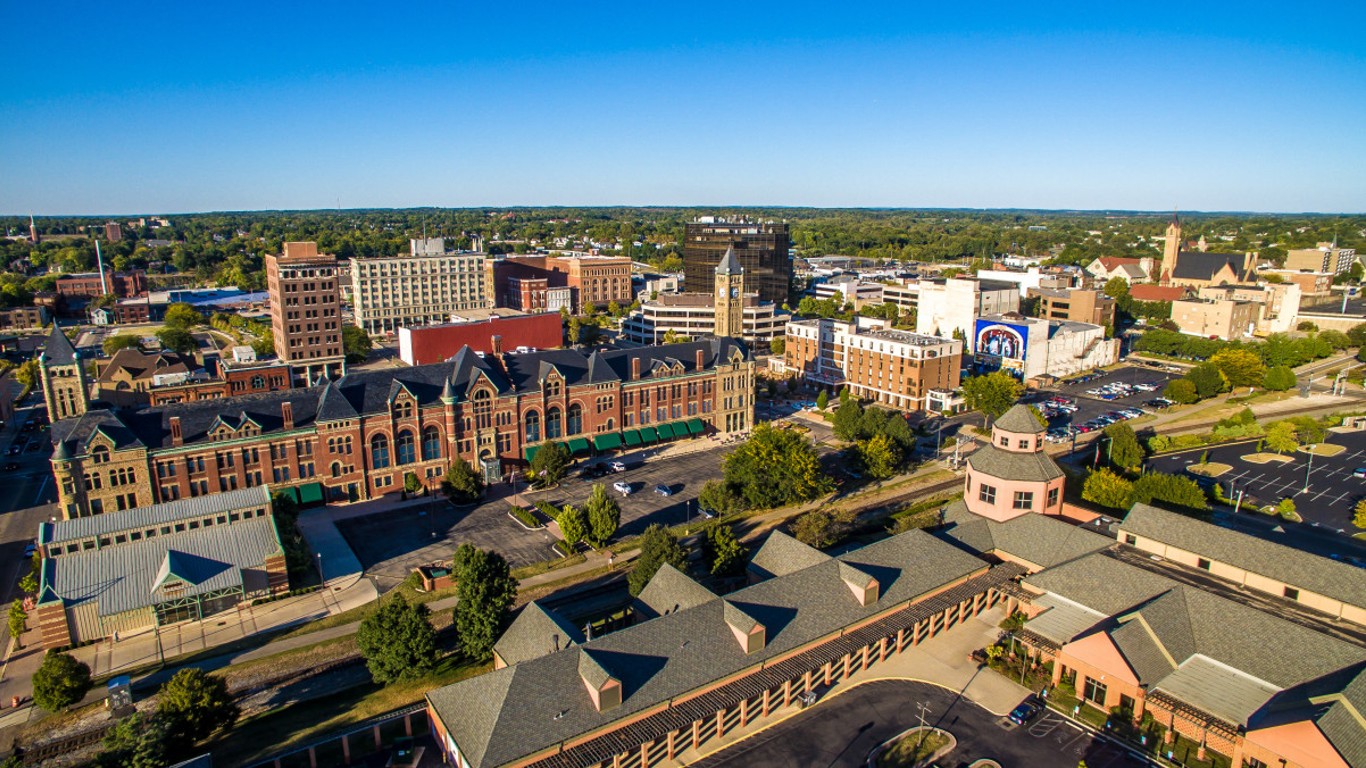
35. Muncie, Indiana
- Adults who don’t exercise: 29.2%
- Adult obesity rate: 40.1% — #29 out of 384 metro areas
- Adults in poor or fair health: 17.3% — #82 out of 384 metro areas
- Life expectancy: 74.2 years — #366 out of 384 metro areas
34. Gadsden, Alabama
- Adults who don’t exercise: 29.3%
- Adult obesity rate: 41.1% — #17 out of 384 metro areas
- Adults in poor or fair health: 19.1% — #35 out of 384 metro areas
- Life expectancy: 72.5 years — #383 out of 384 metro areas
33. Jonesboro, Arkansas

- Adults who don’t exercise: 29.3%
- Adult obesity rate: 40.5% — #26 out of 384 metro areas
- Adults in poor or fair health: 18.7% — #45 out of 384 metro areas
- Life expectancy: 75.2 years — #334 out of 384 metro areas
32. Yuma, Arizona
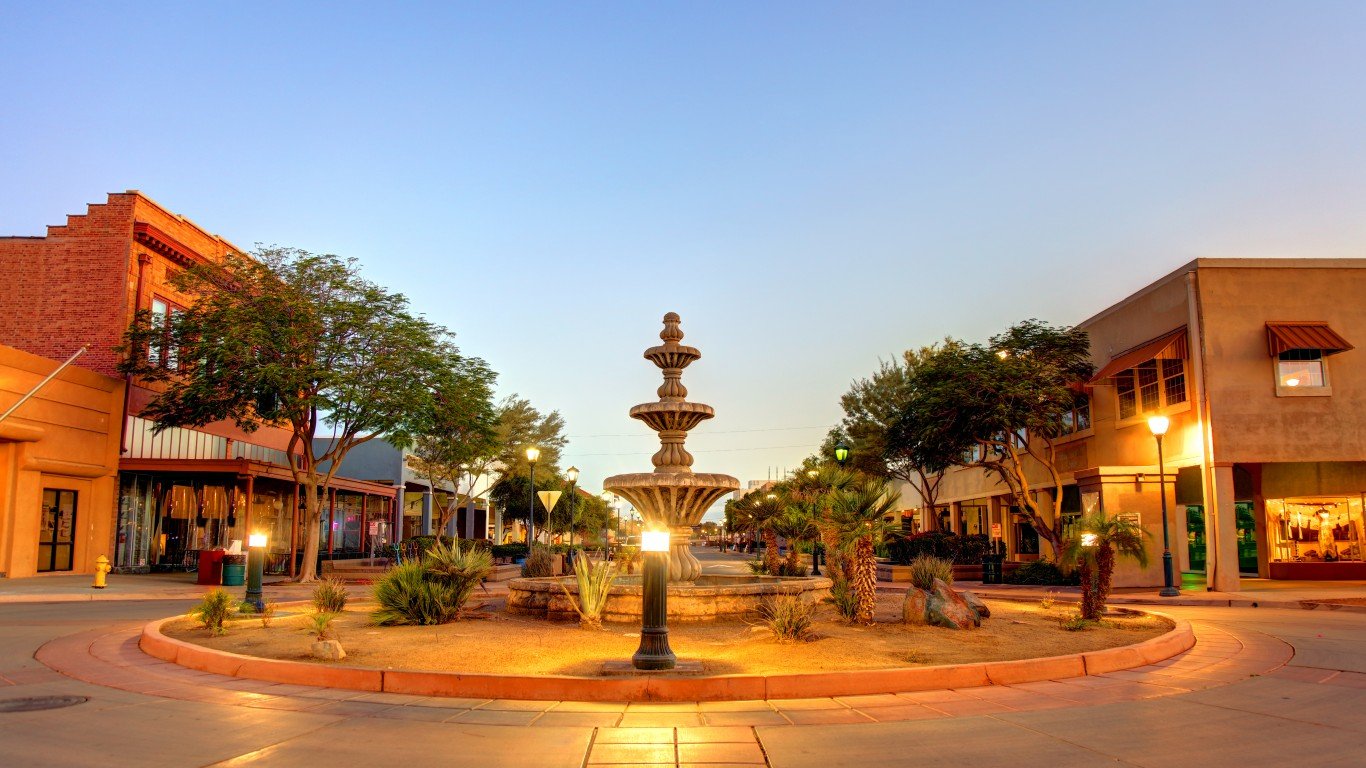
- Adults who don’t exercise: 29.4%
- Adult obesity rate: 40.5% — #25 out of 384 metro areas
- Adults in poor or fair health: 21.1% — #12 out of 384 metro areas
- Life expectancy: 80.5 years — #50 out of 384 metro areas
31. Sebring-Avon Park, Florida
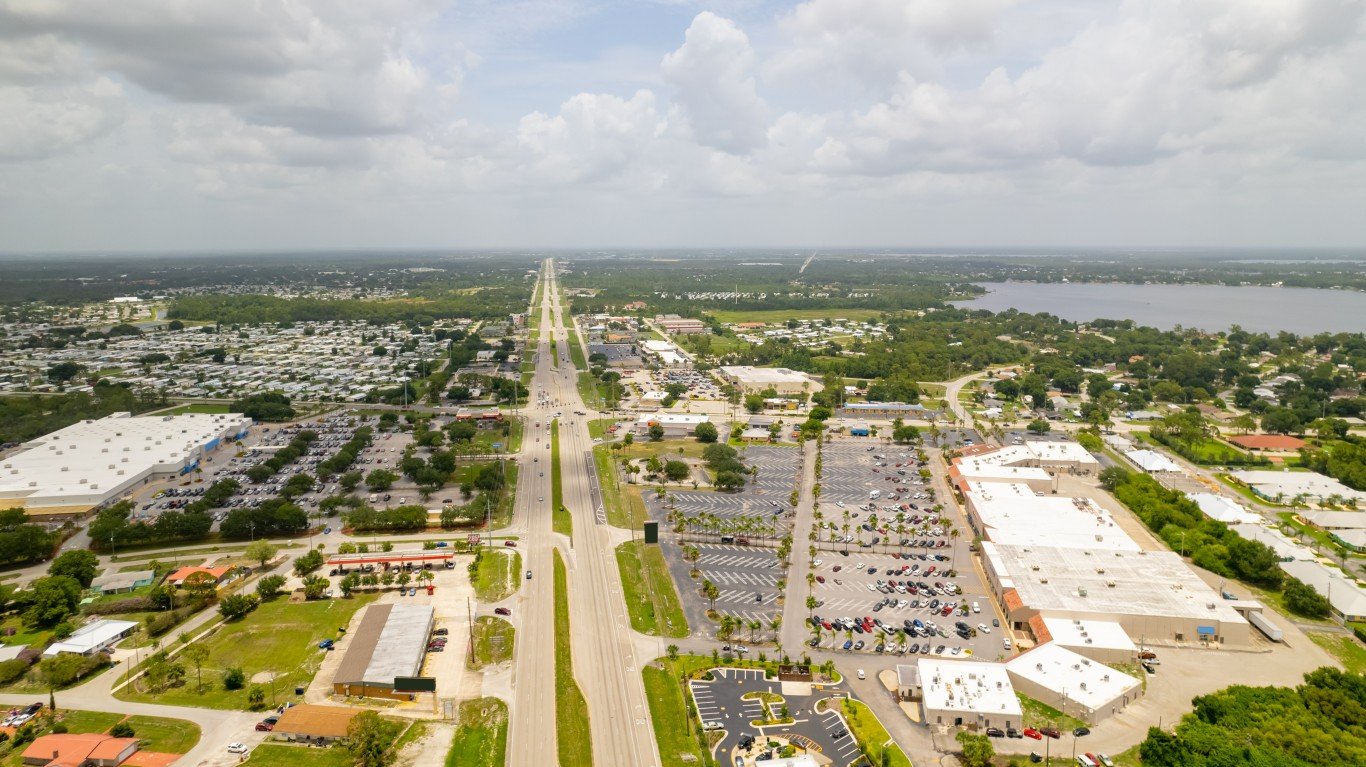
- Adults who don’t exercise: 29.6%
- Adult obesity rate: 39.1% — #51 out of 384 metro areas
- Adults in poor or fair health: 19.2% — #30 out of 384 metro areas
- Life expectancy: 77.8 years — #193 out of 384 metro areas
30. Enid, Oklahoma
- Adults who don’t exercise: 29.6%
- Adult obesity rate: 37.9% — #89 out of 384 metro areas
- Adults in poor or fair health: 16.4% — #110 out of 384 metro areas
- Life expectancy: 75.0 years — #341 out of 384 metro areas
29. Valdosta, Georgia
- Adults who don’t exercise: 29.6%
- Adult obesity rate: 39.6% — #34 out of 384 metro areas
- Adults in poor or fair health: 18.9% — #42 out of 384 metro areas
- Life expectancy: 75.3 years — #330 out of 384 metro areas
28. Albany, Georgia
- Adults who don’t exercise: 29.6%
- Adult obesity rate: 41.4% — #14 out of 384 metro areas
- Adults in poor or fair health: 20.0% — #20 out of 384 metro areas
- Life expectancy: 73.6 years — #375 out of 384 metro areas
27. Sumter, South Carolina

- Adults who don’t exercise: 29.6%
- Adult obesity rate: 41.3% — #15 out of 384 metro areas
- Adults in poor or fair health: 18.8% — #44 out of 384 metro areas
- Life expectancy: 74.3 years — #363 out of 384 metro areas
26. Huntington-Ashland, West Virginia-Kentucky-Ohio

- Adults who don’t exercise: 29.7%
- Adult obesity rate: 39.1% — #45 out of 384 metro areas
- Adults in poor or fair health: 19.4% — #27 out of 384 metro areas
- Life expectancy: 73.3 years — #378 out of 384 metro areas
25. Tuscaloosa, Alabama
- Adults who don’t exercise: 30.0%
- Adult obesity rate: 42.2% — #9 out of 384 metro areas
- Adults in poor or fair health: 19.1% — #37 out of 384 metro areas
- Life expectancy: 75.4 years — #323 out of 384 metro areas
24. Rome, Georgia
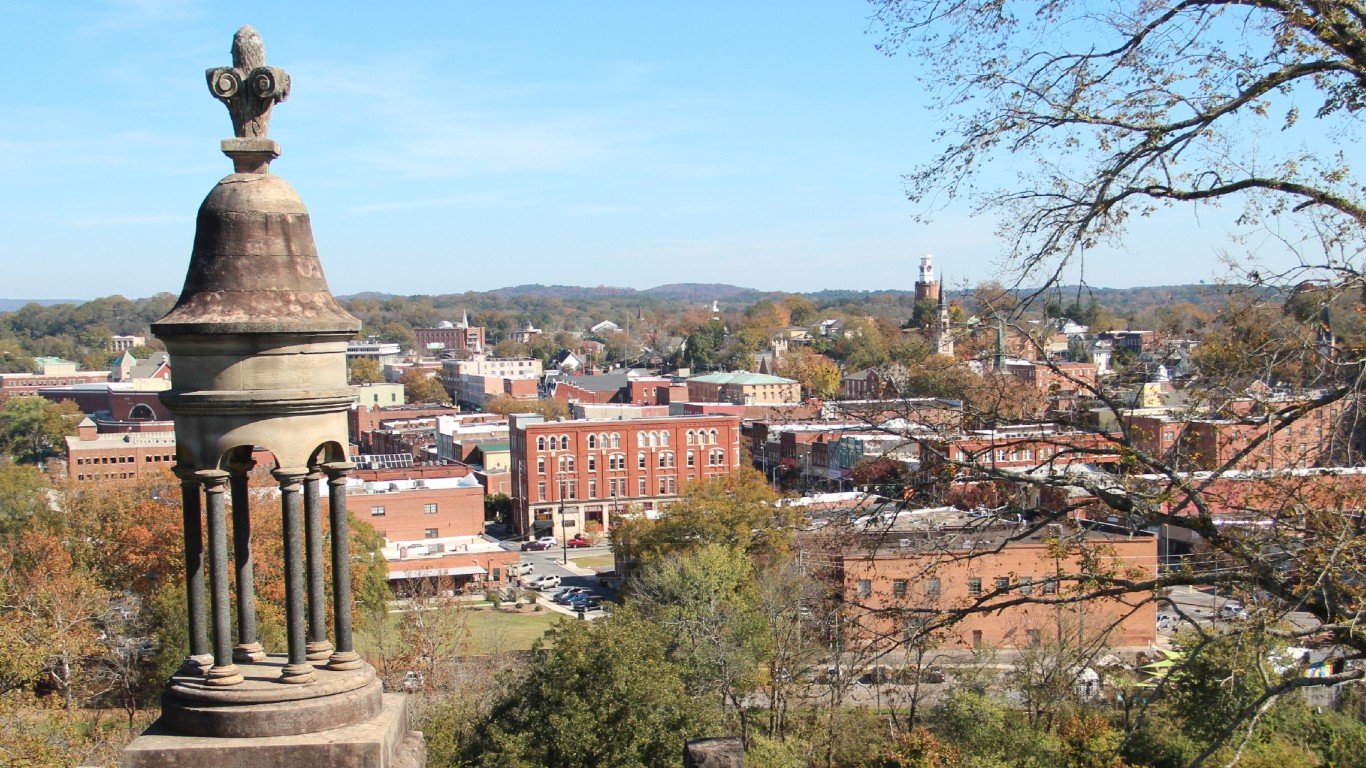
- Adults who don’t exercise: 30.1%
- Adult obesity rate: 38.1% — #81 out of 384 metro areas
- Adults in poor or fair health: 18.3% — #54 out of 384 metro areas
- Life expectancy: 74.2 years — #365 out of 384 metro areas
23. El Paso, Texas

- Adults who don’t exercise: 30.3%
- Adult obesity rate: 37.7% — #92 out of 384 metro areas
- Adults in poor or fair health: 22.8% — #5 out of 384 metro areas
- Life expectancy: 78.1 years — #171 out of 384 metro areas
22. Beckley, West Virginia
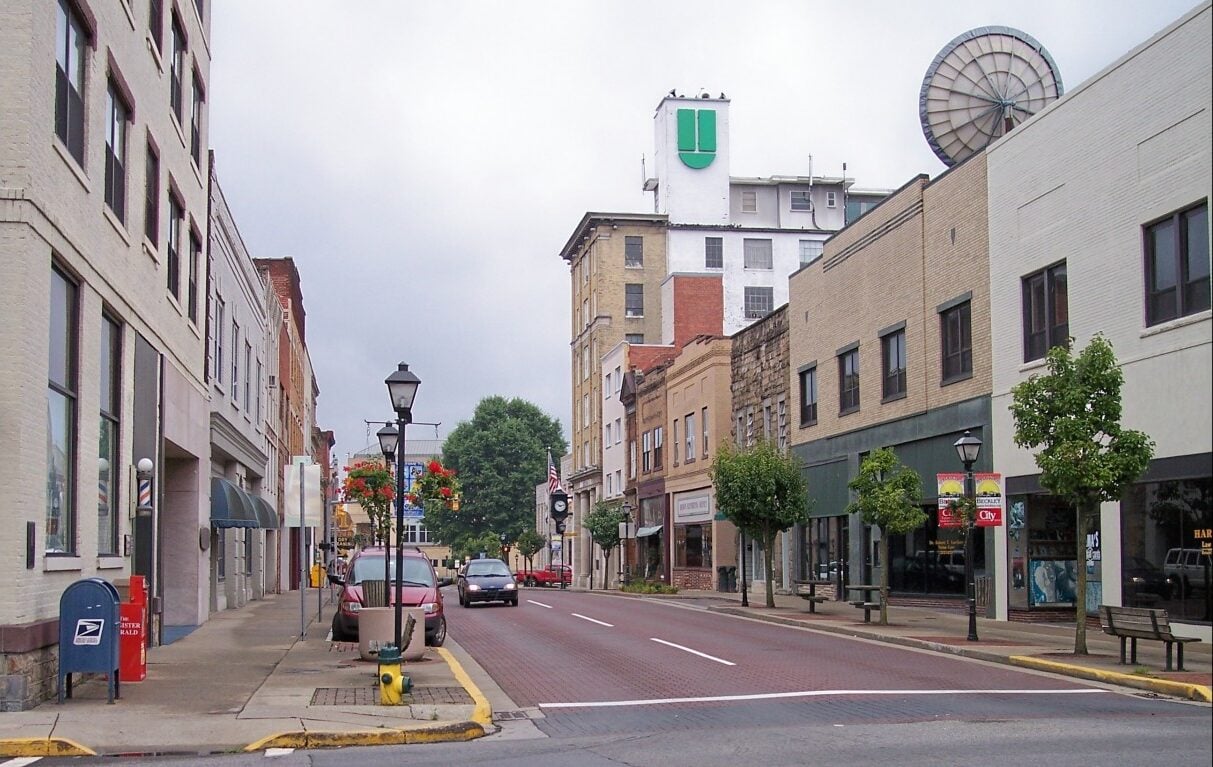
- Adults who don’t exercise: 30.5%
- Adult obesity rate: 41.8% — #12 out of 384 metro areas
- Adults in poor or fair health: 21.7% — #8 out of 384 metro areas
- Life expectancy: 71.9 years — #384 out of 384 metro areas
21. Charleston, West Virginia

- Adults who don’t exercise: 30.5%
- Adult obesity rate: 39.0% — #54 out of 384 metro areas
- Adults in poor or fair health: 19.7% — #23 out of 384 metro areas
- Life expectancy: 72.6 years — #381 out of 384 metro areas
20. Bowling Green, Kentucky
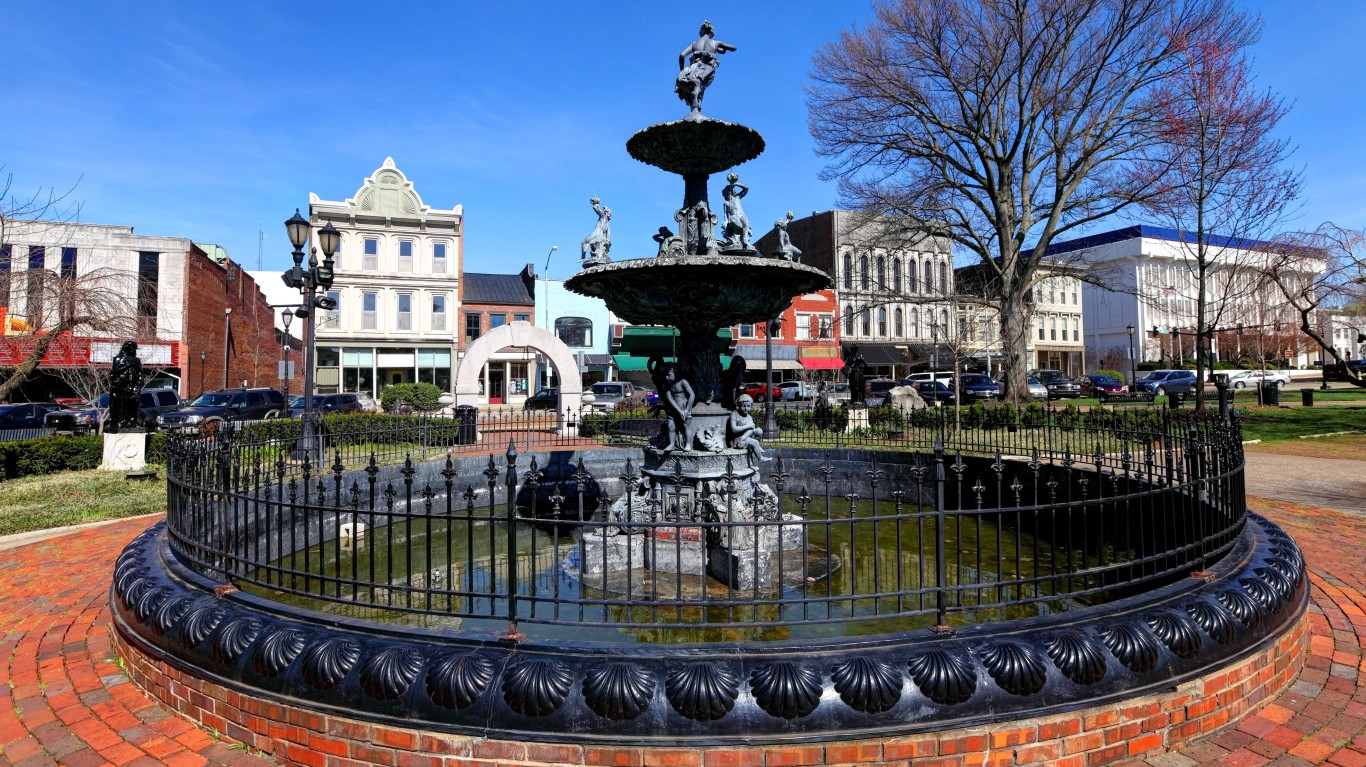
- Adults who don’t exercise: 30.6%
- Adult obesity rate: 37.6% — #95 out of 384 metro areas
- Adults in poor or fair health: 18.9% — #40 out of 384 metro areas
- Life expectancy: 76.2 years — #288 out of 384 metro areas
19. Lake Charles, Louisiana
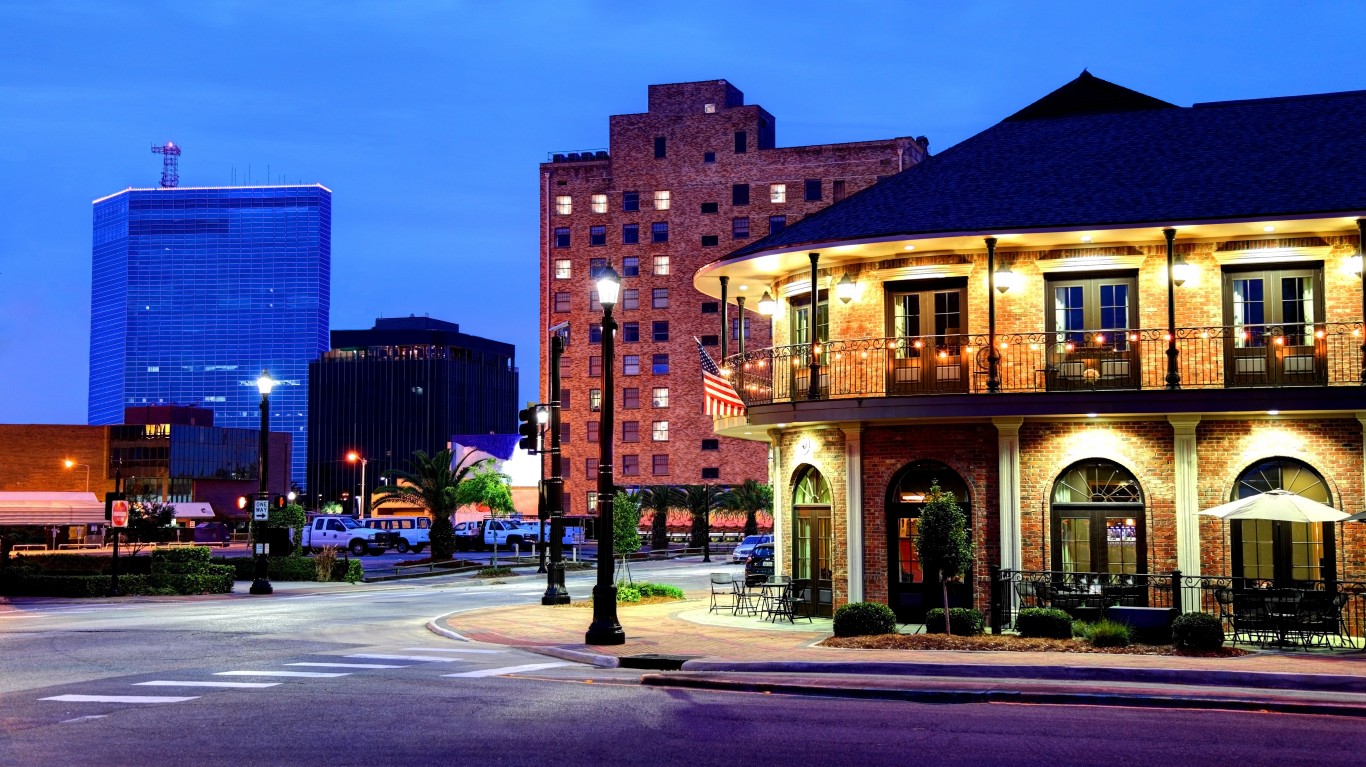
- Adults who don’t exercise: 30.7%
- Adult obesity rate: 38.4% — #70 out of 384 metro areas
- Adults in poor or fair health: 17.7% — #71 out of 384 metro areas
- Life expectancy: 74.5 years — #355 out of 384 metro areas
18. Vineland-Bridgeton, New Jersey

- Adults who don’t exercise: 30.8%
- Adult obesity rate: 35.7% — #159 out of 384 metro areas
- Adults in poor or fair health: 17.8% — #63 out of 384 metro areas
- Life expectancy: 74.6 years — #353 out of 384 metro areas
17. Fort Smith, Arkansas-Oklahoma
- Adults who don’t exercise: 30.8%
- Adult obesity rate: 36.8% — #116 out of 384 metro areas
- Adults in poor or fair health: 20.1% — #18 out of 384 metro areas
- Life expectancy: 75.4 years — #326 out of 384 metro areas
16. Florence, South Carolina
- Adults who don’t exercise: 30.8%
- Adult obesity rate: 41.7% — #13 out of 384 metro areas
- Adults in poor or fair health: 18.4% — #51 out of 384 metro areas
- Life expectancy: 72.6 years — #382 out of 384 metro areas
15. Odessa, Texas
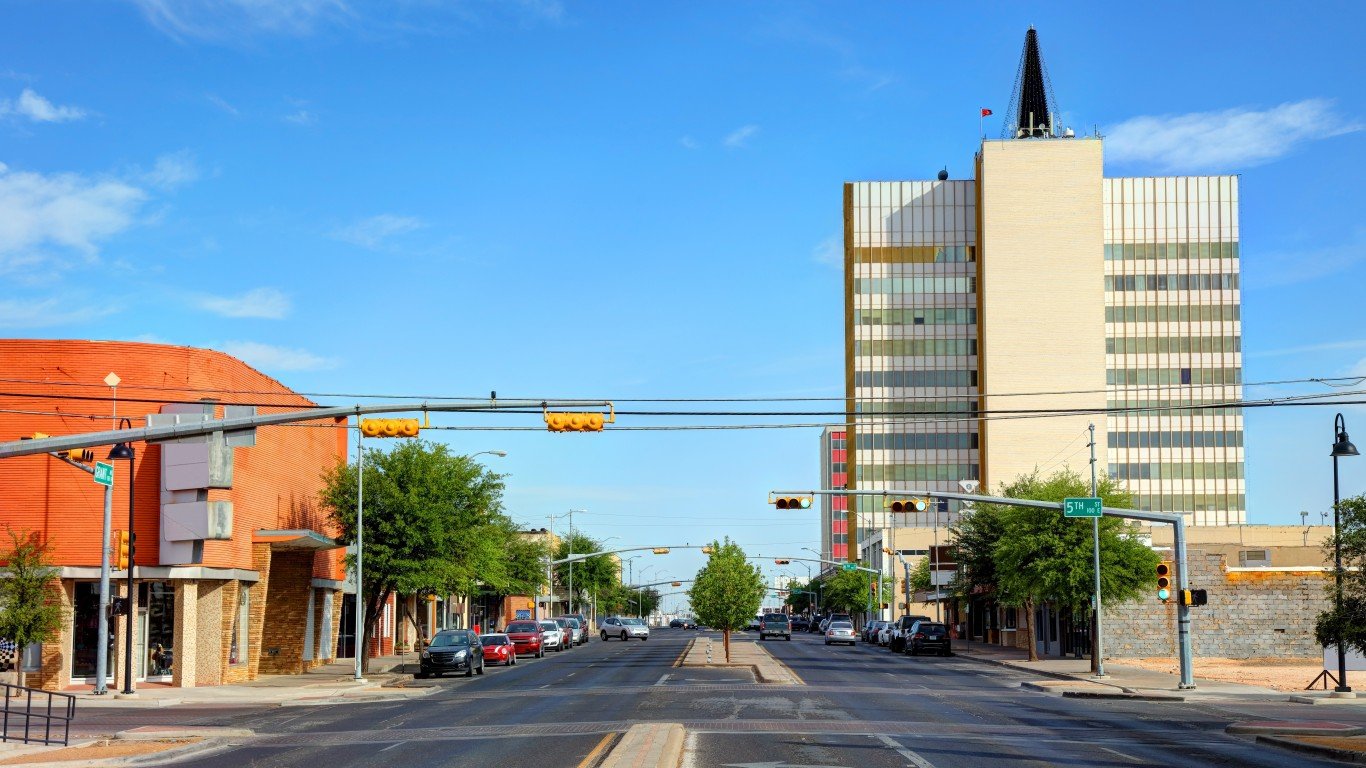
- Adults who don’t exercise: 31.1%
- Adult obesity rate: 39.6% — #33 out of 384 metro areas
- Adults in poor or fair health: 20.4% — #15 out of 384 metro areas
- Life expectancy: 73.8 years — #374 out of 384 metro areas
14. Lawton, Oklahoma

- Adults who don’t exercise: 31.2%
- Adult obesity rate: 39.4% — #36 out of 384 metro areas
- Adults in poor or fair health: 18.0% — #60 out of 384 metro areas
- Life expectancy: 75.4 years — #324 out of 384 metro areas
13. Shreveport-Bossier City, Louisiana
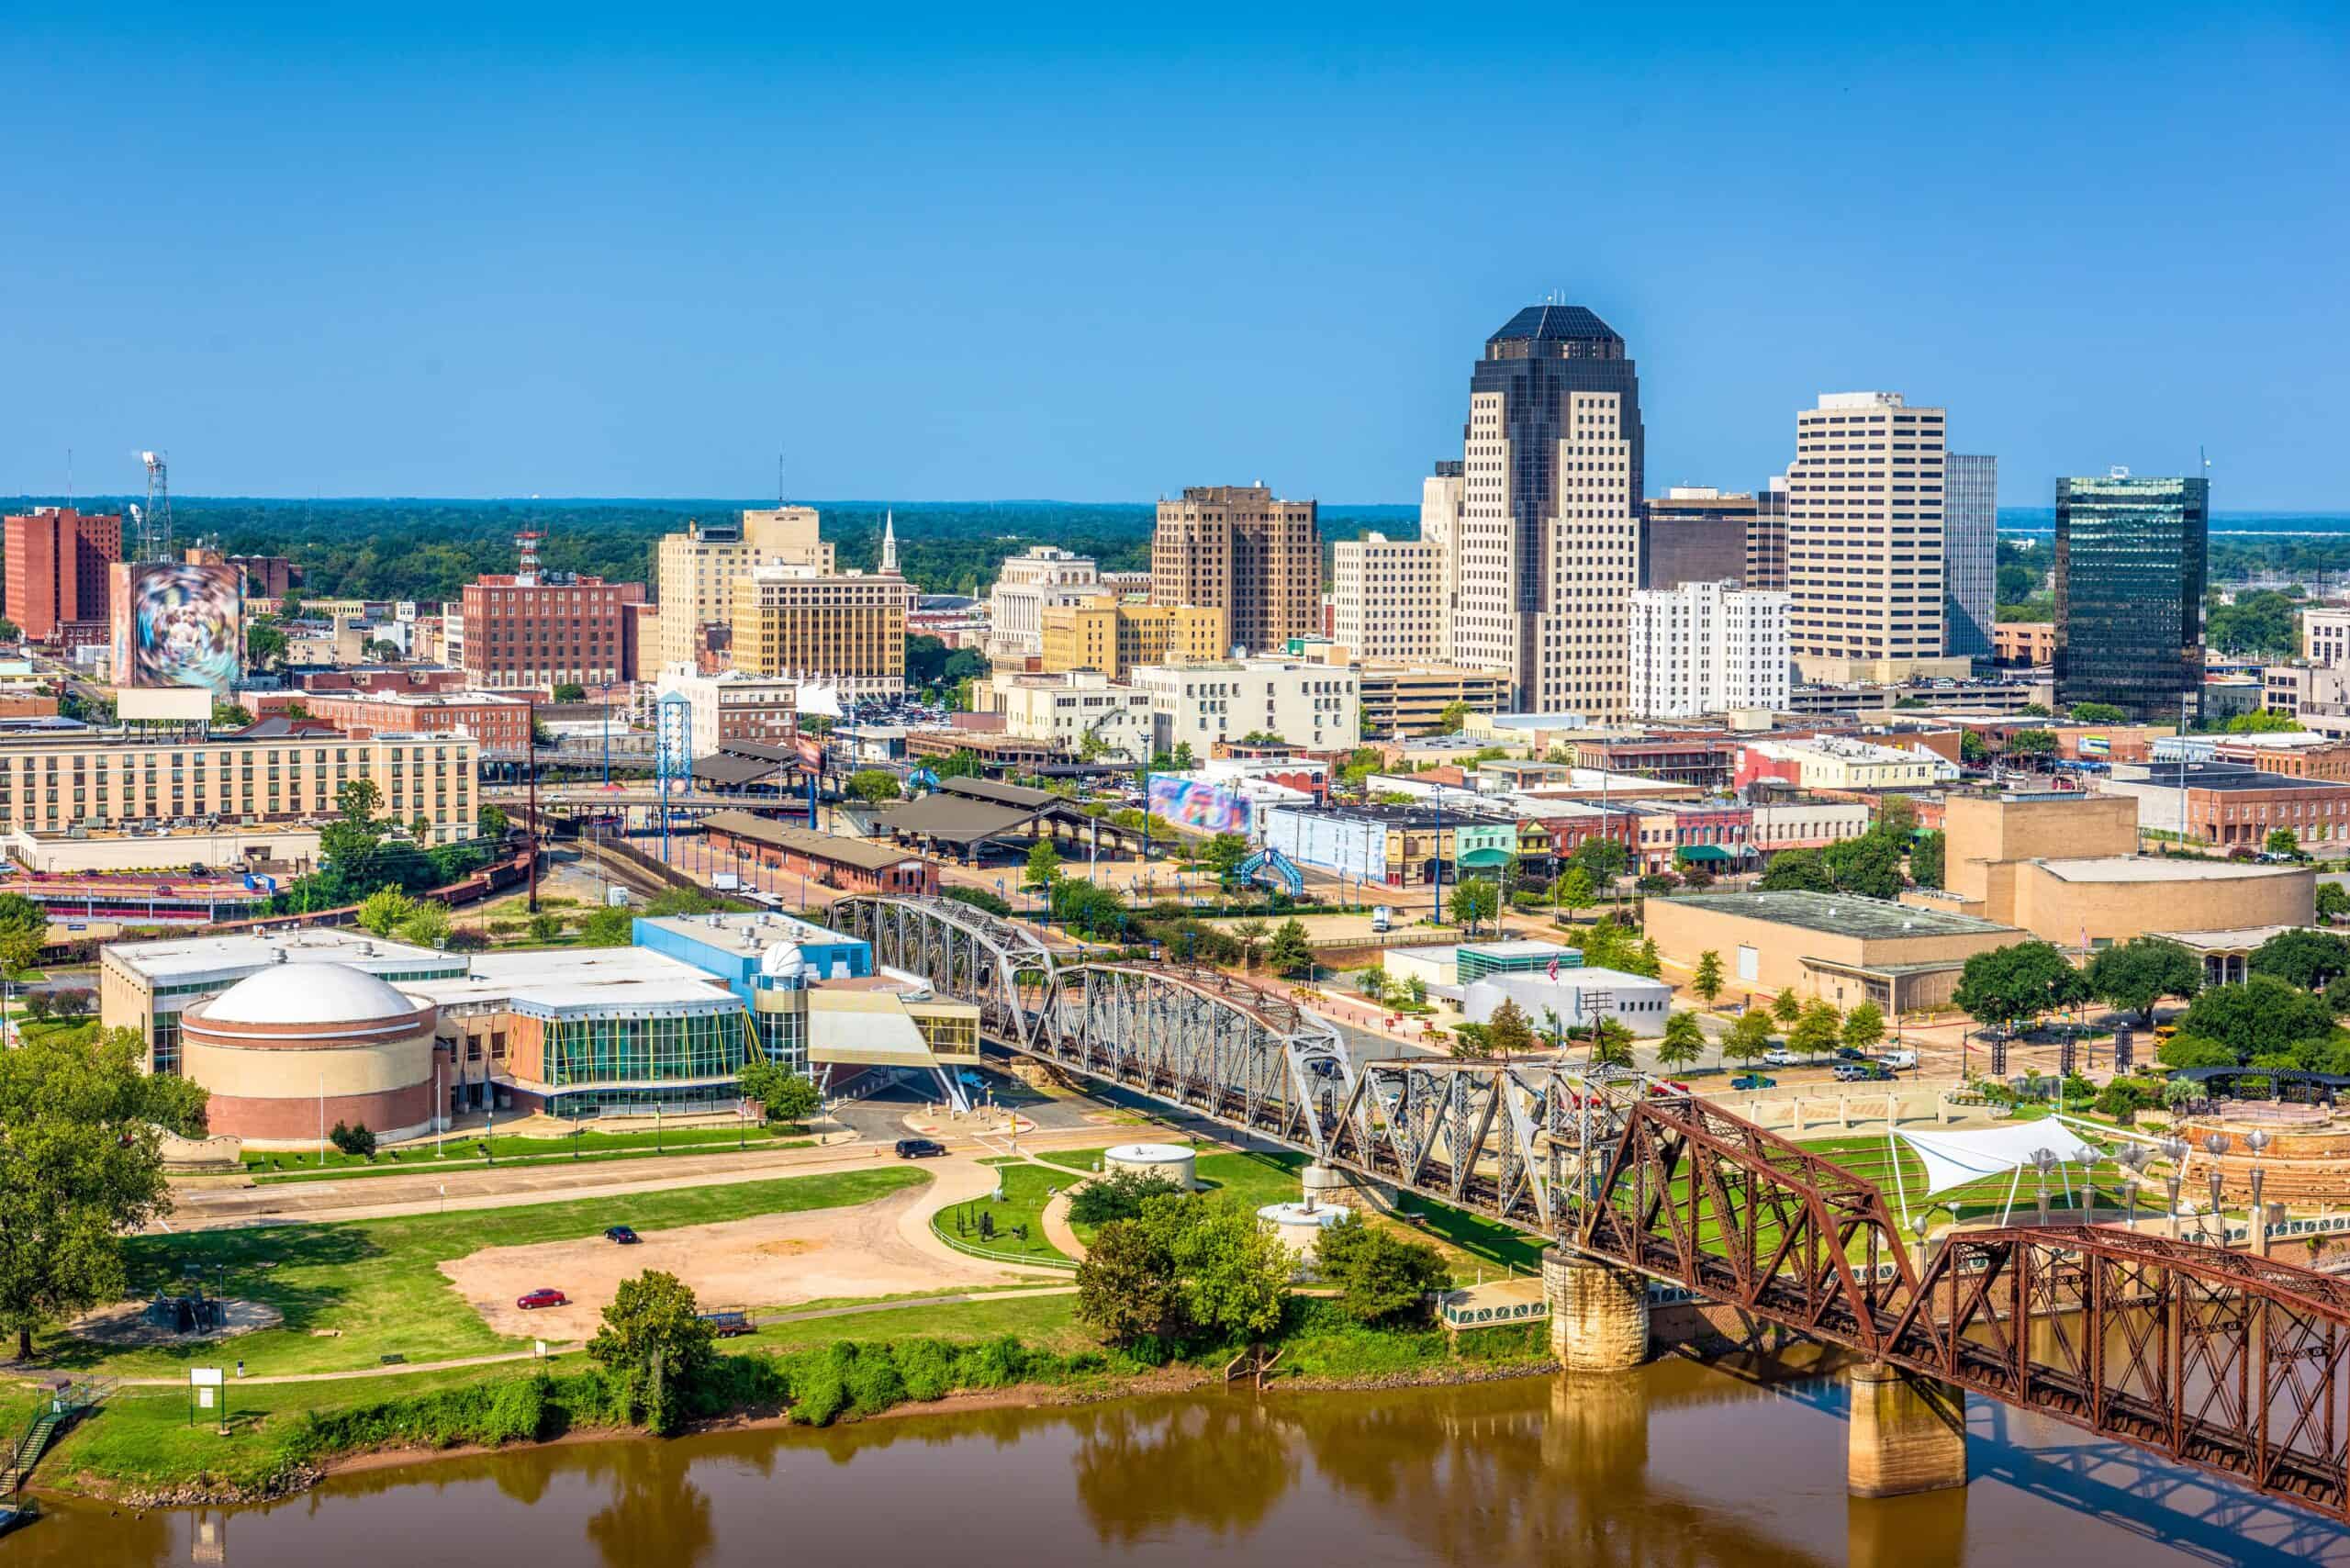
- Adults who don’t exercise: 31.6%
- Adult obesity rate: 42.0% — #11 out of 384 metro areas
- Adults in poor or fair health: 19.4% — #28 out of 384 metro areas
- Life expectancy: 74.9 years — #344 out of 384 metro areas
12. Houma-Thibodaux, Louisiana

- Adults who don’t exercise: 31.6%
- Adult obesity rate: 40.3% — #27 out of 384 metro areas
- Adults in poor or fair health: 19.6% — #25 out of 384 metro areas
- Life expectancy: 75.9 years — #297 out of 384 metro areas
11. Dothan, Alabama
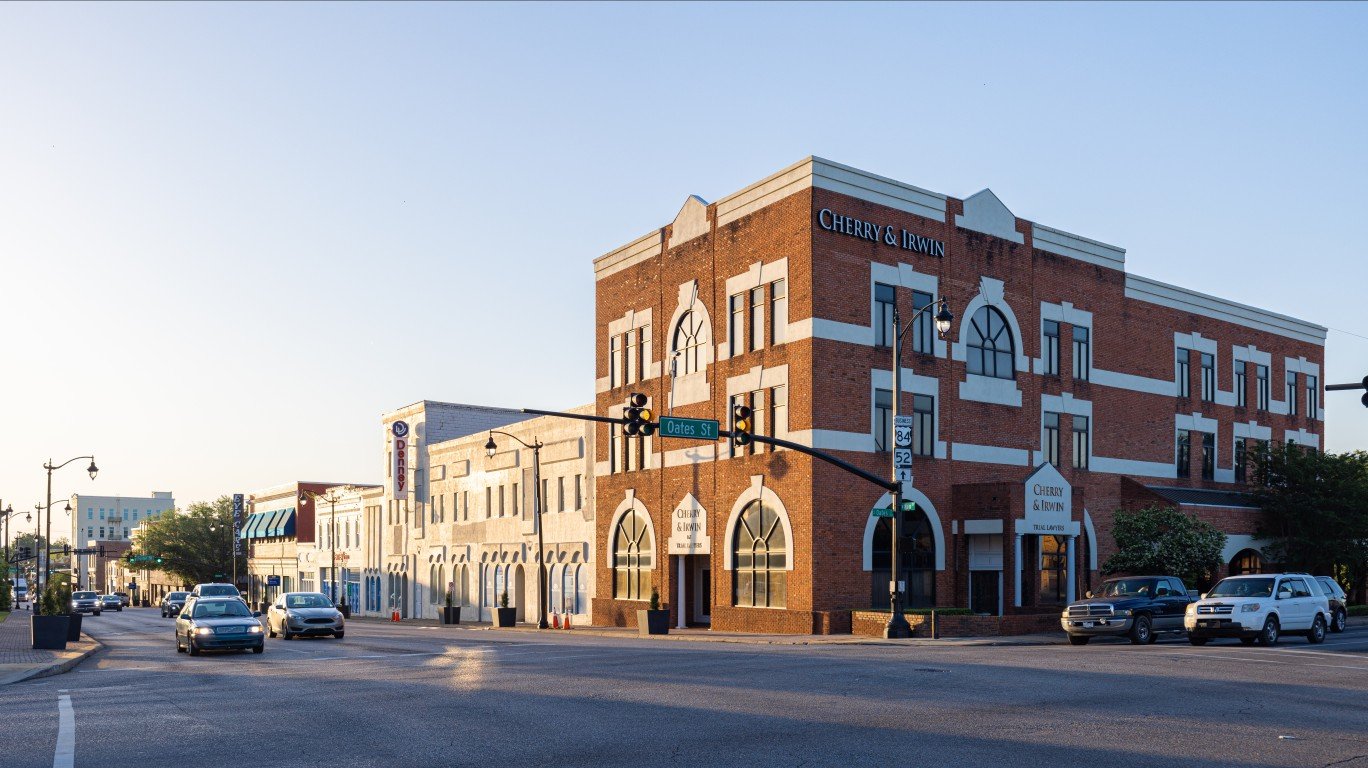
- Adults who don’t exercise: 31.7%
- Adult obesity rate: 39.3% — #42 out of 384 metro areas
- Adults in poor or fair health: 20.2% — #16 out of 384 metro areas
- Life expectancy: 75.1 years — #338 out of 384 metro areas
10. El Centro, California
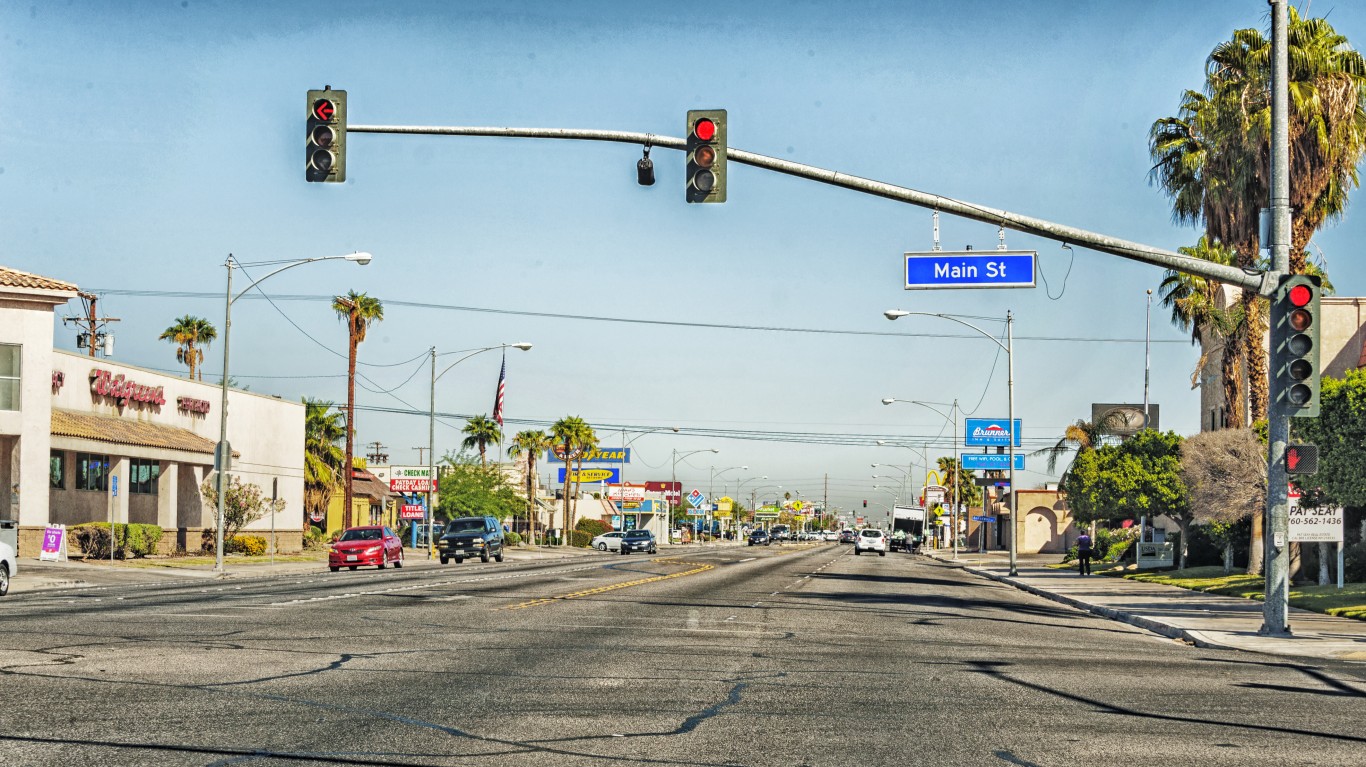
- Adults who don’t exercise: 31.7%
- Adult obesity rate: 36.2% — #138 out of 384 metro areas
- Adults in poor or fair health: 24.0% — #4 out of 384 metro areas
- Life expectancy: 79.0 years — #115 out of 384 metro areas
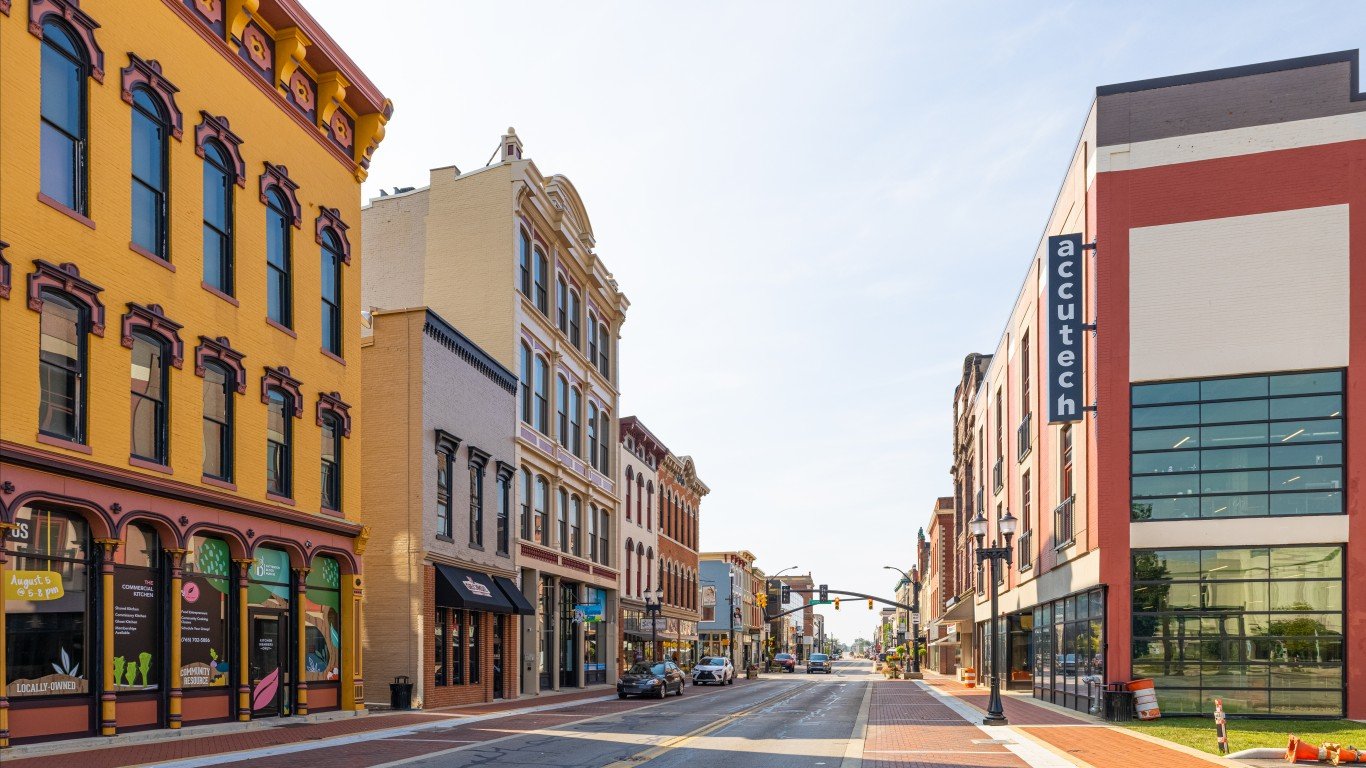
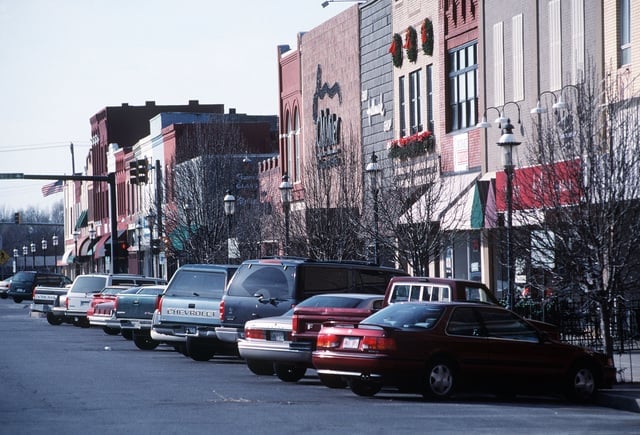
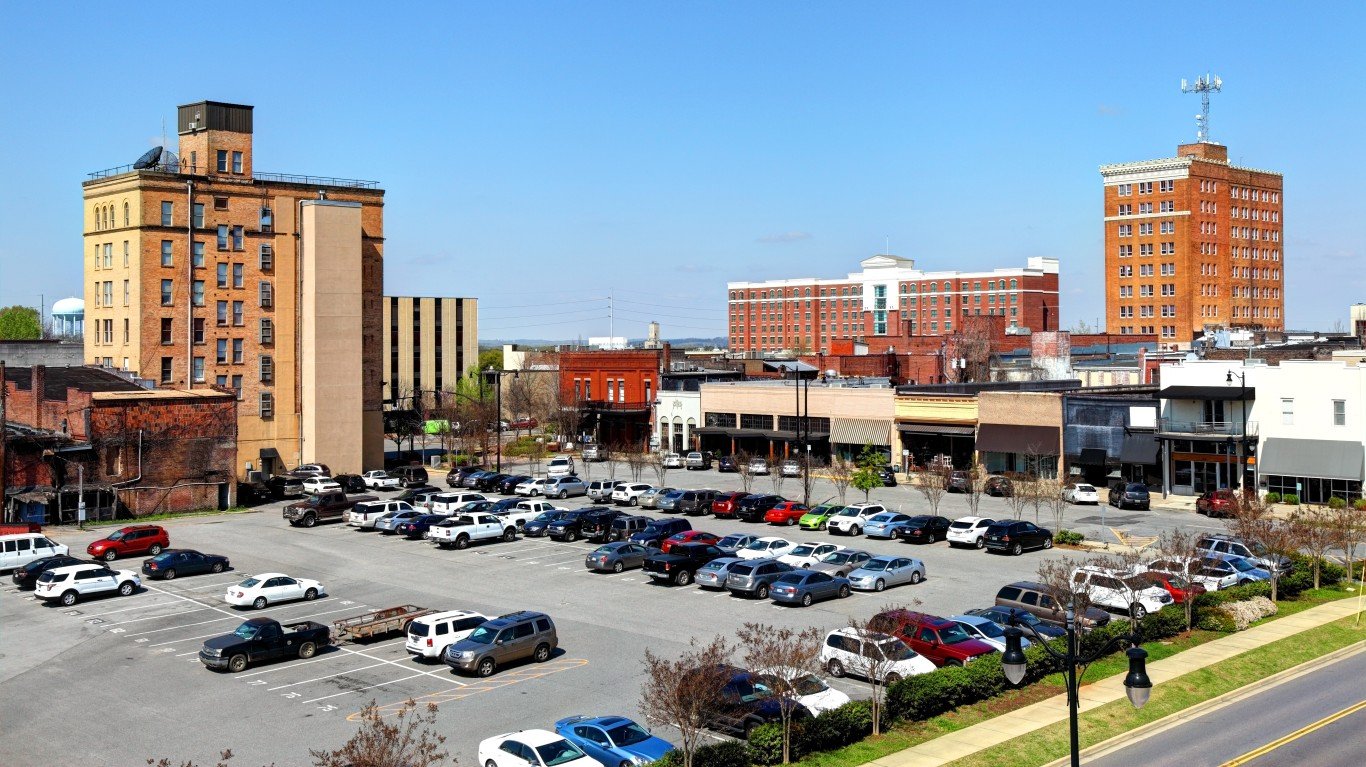
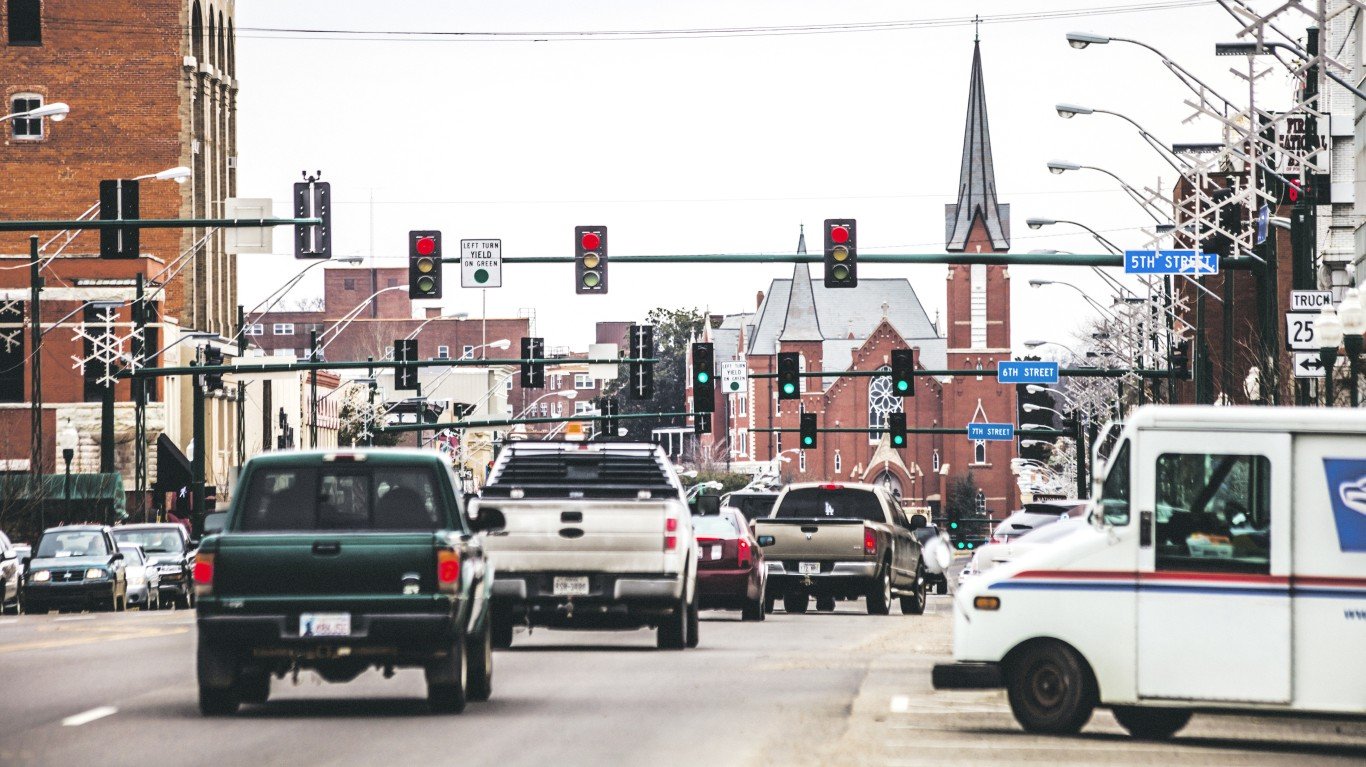
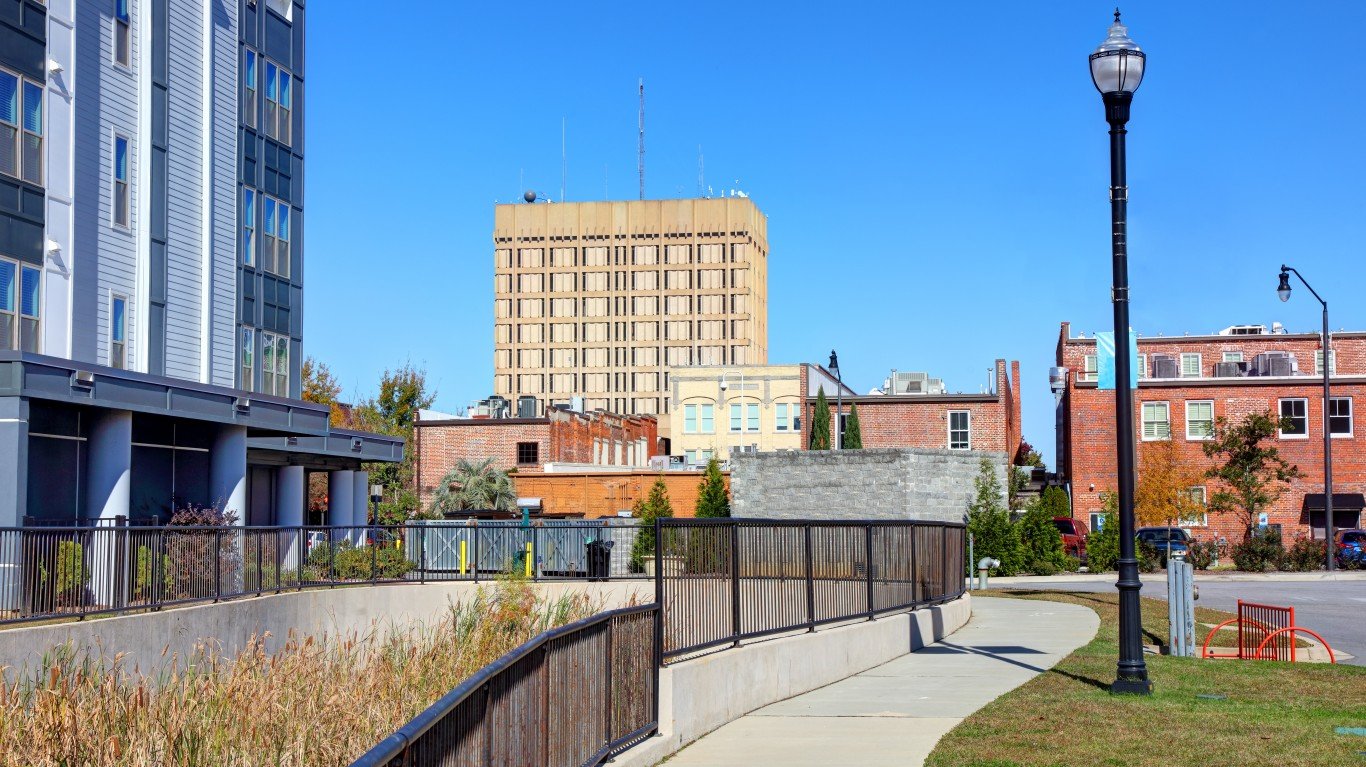
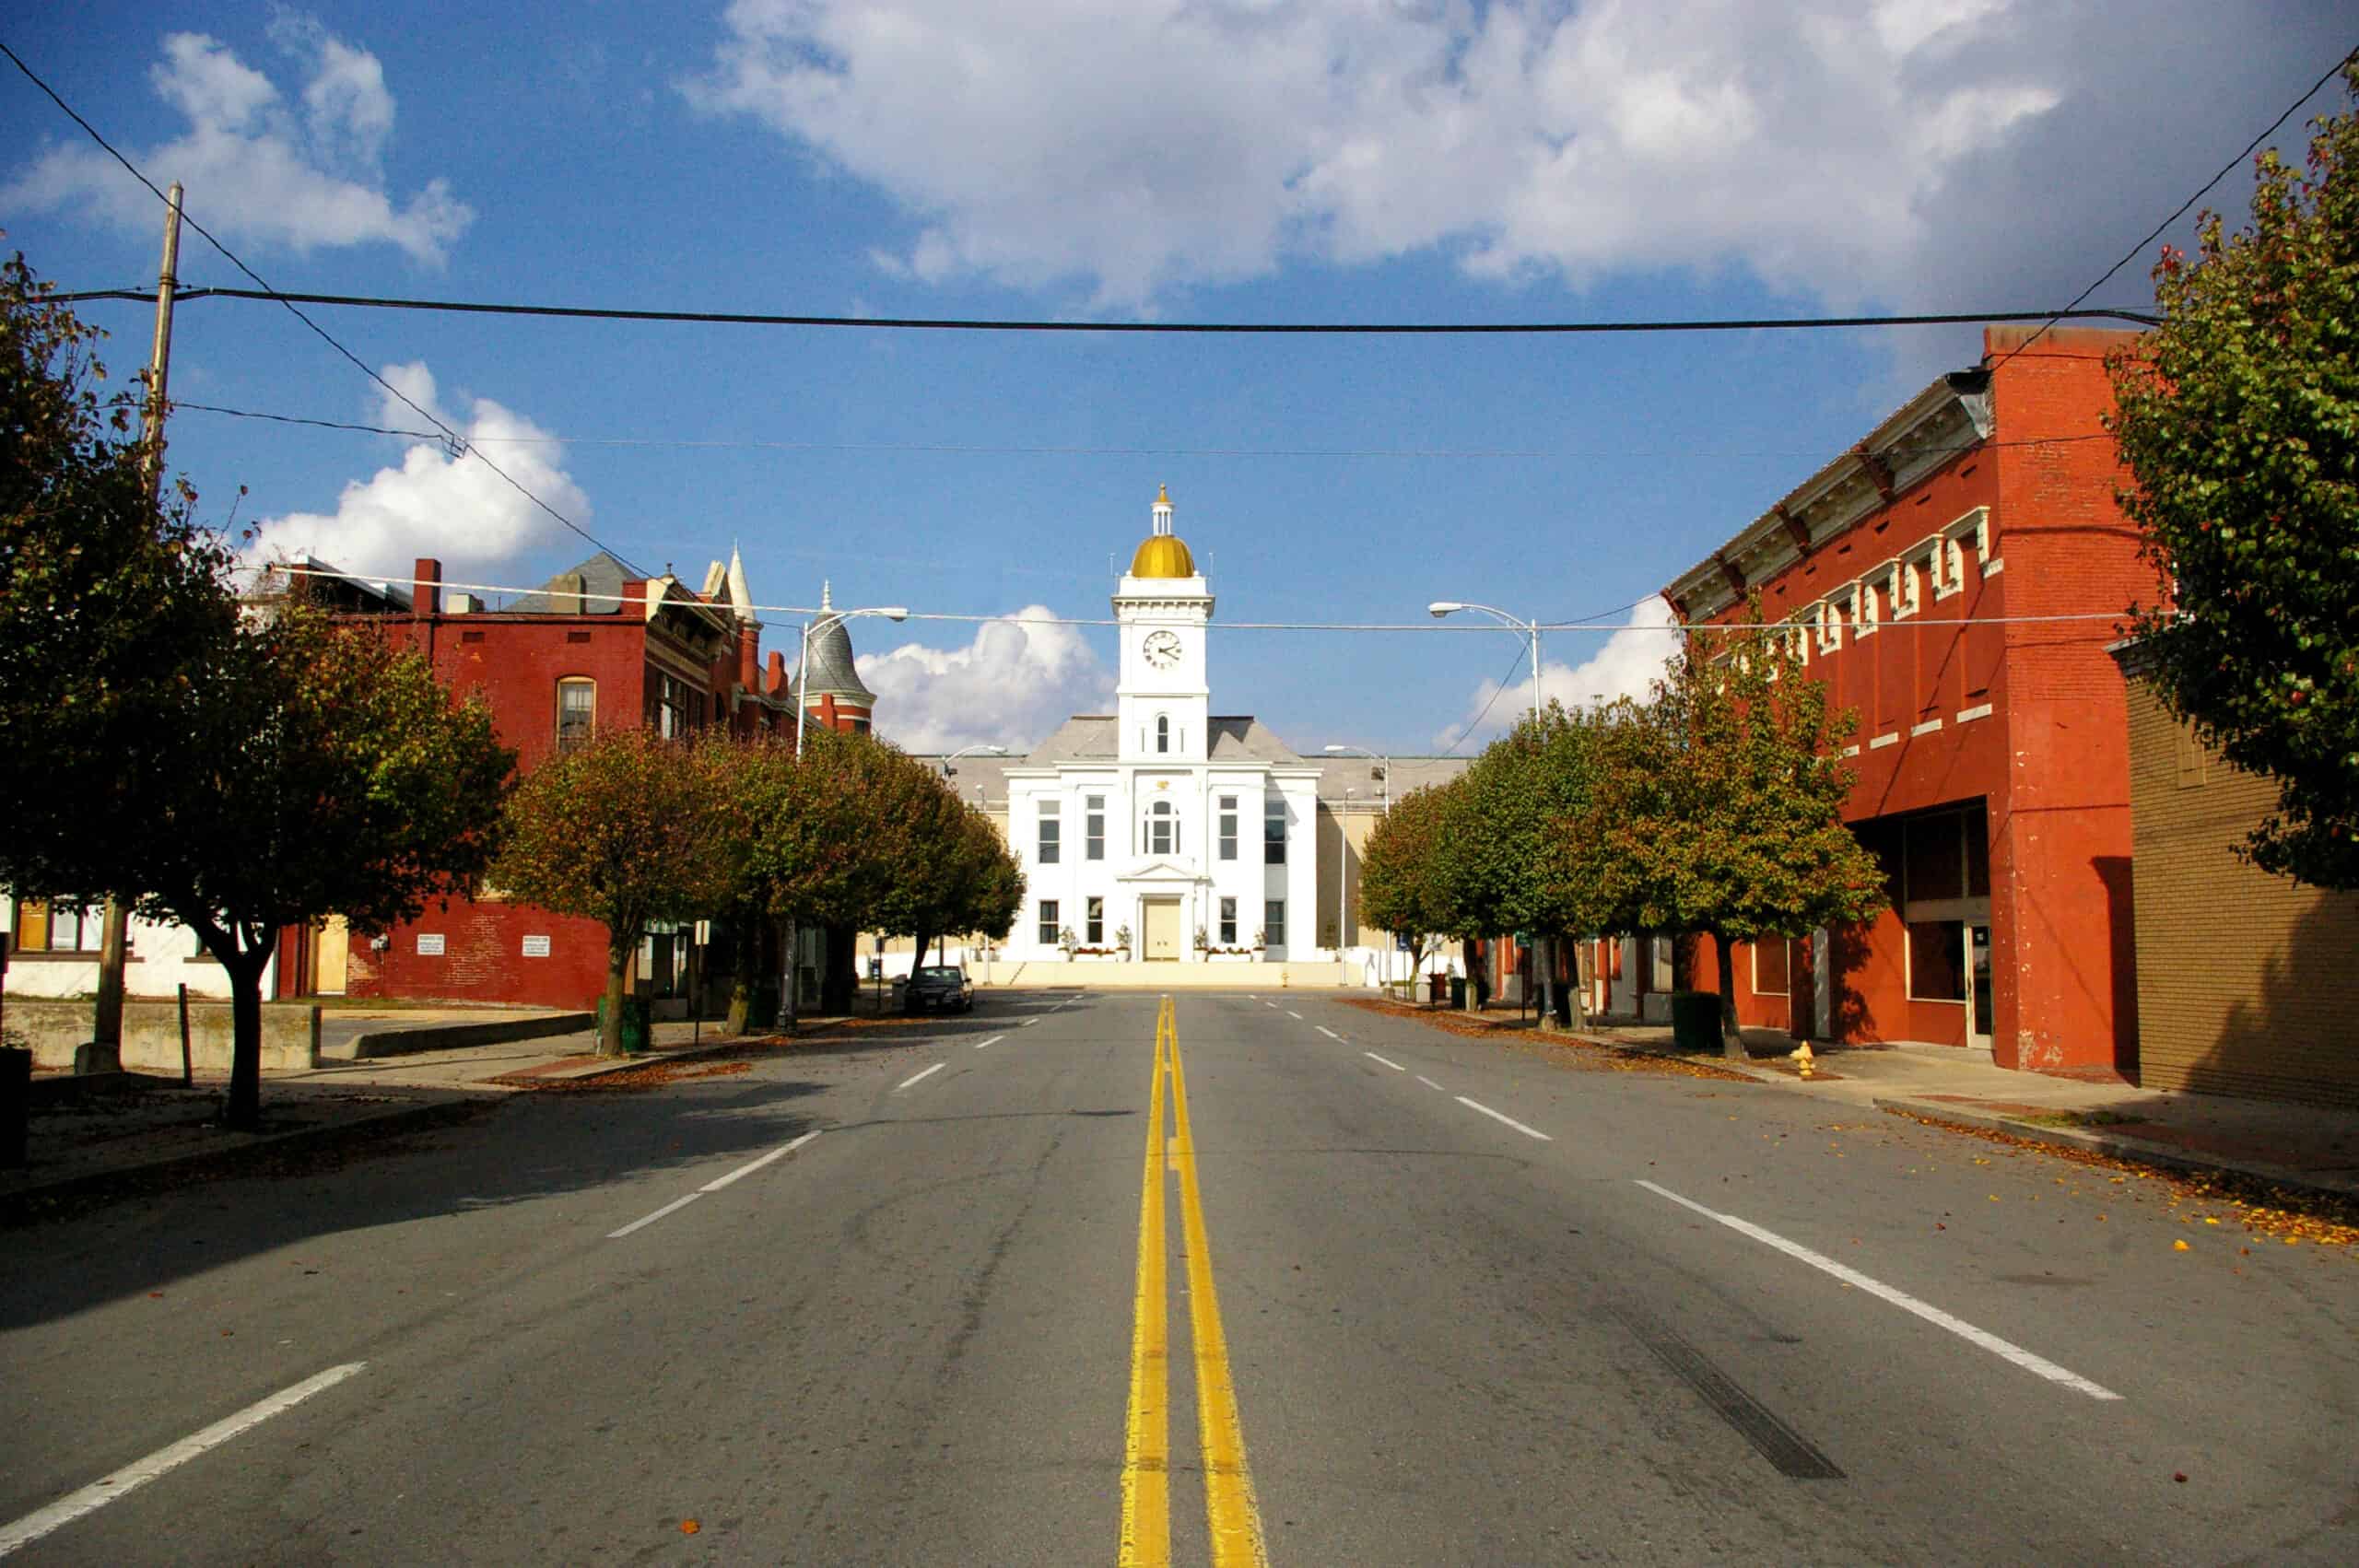
9. Dalton, Georgia
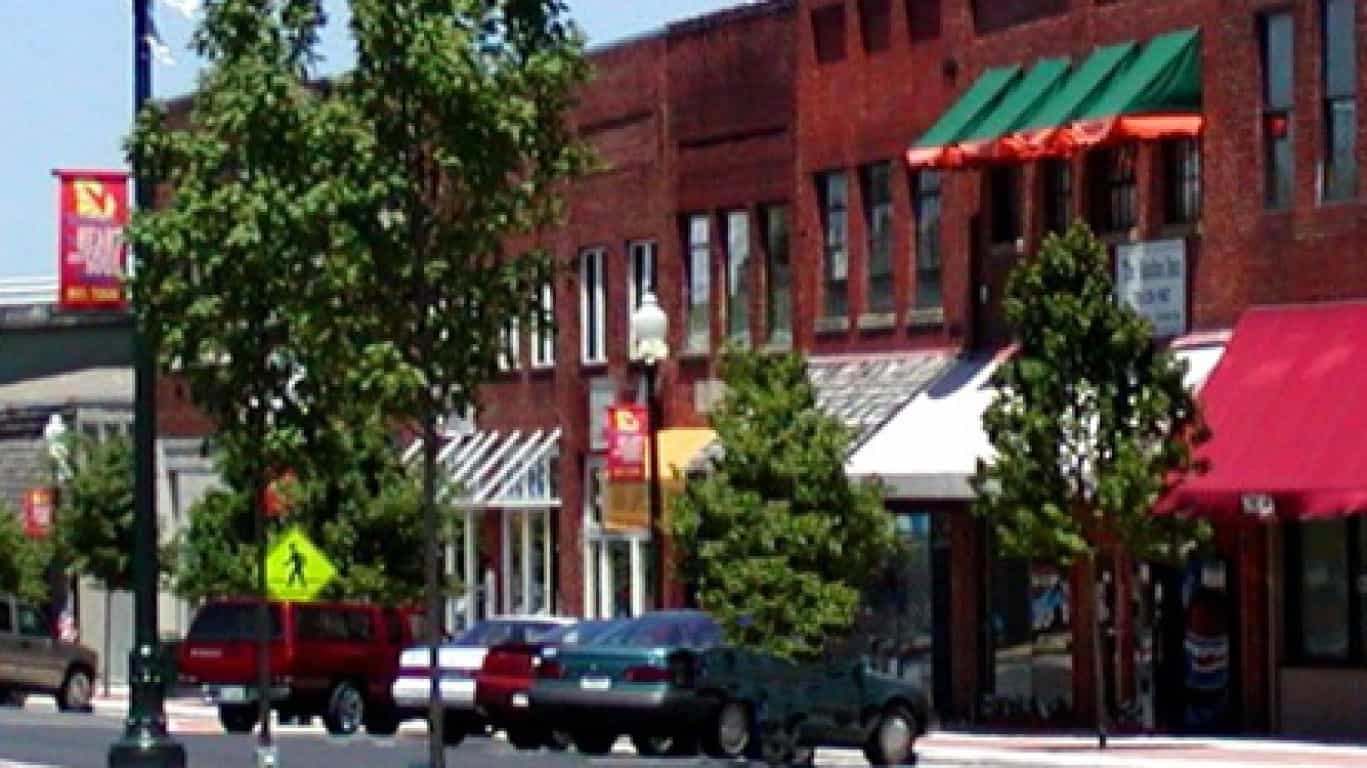
Downtown Dalton, Georgia
- Adults who don’t exercise: 32.0%
- Adult obesity rate: 39.0% — #53 out of 384 metro areas
- Adults in poor or fair health: 19.9% — #22 out of 384 metro areas
- Life expectancy: 76.6 years — #264 out of 384 metro areas
8. Corpus Christi, Texas

- Adults who don’t exercise: 32.1%
- Adult obesity rate: 40.6% — #24 out of 384 metro areas
- Adults in poor or fair health: 21.1% — #13 out of 384 metro areas
- Life expectancy: 77.1 years — #236 out of 384 metro areas
7. Alexandria, Louisiana
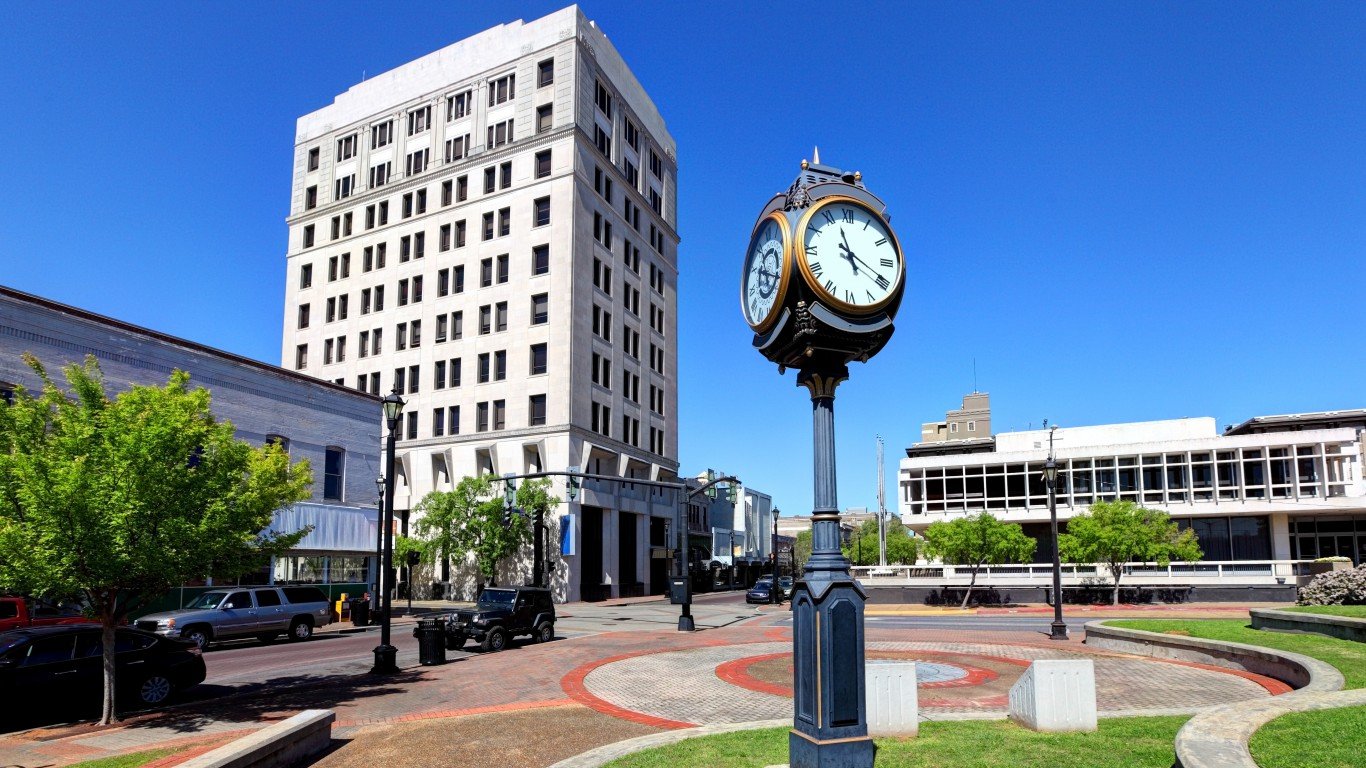
- Adults who don’t exercise: 32.3%
- Adult obesity rate: 43.2% — #3 out of 384 metro areas
- Adults in poor or fair health: 18.6% — #46 out of 384 metro areas
- Life expectancy: 73.5 years — #376 out of 384 metro areas
6. Monroe, Louisiana
- Adults who don’t exercise: 33.0%
- Adult obesity rate: 42.4% — #8 out of 384 metro areas
- Adults in poor or fair health: 20.8% — #14 out of 384 metro areas
- Life expectancy: 73.3 years — #377 out of 384 metro areas
5. Brownsville-Harlingen, Texas
- Adults who don’t exercise: 33.1%
- Adult obesity rate: 42.7% — #7 out of 384 metro areas
- Adults in poor or fair health: 28.2% — #2 out of 384 metro areas
- Life expectancy: 78.8 years — #131 out of 384 metro areas
4. McAllen-Edinburg-Mission, Texas
- Adults who don’t exercise: 33.4%
- Adult obesity rate: 42.9% — #5 out of 384 metro areas
- Adults in poor or fair health: 28.3% — #1 out of 384 metro areas
- Life expectancy: 79.5 years — #91 out of 384 metro areas
3. Hammond, Louisiana
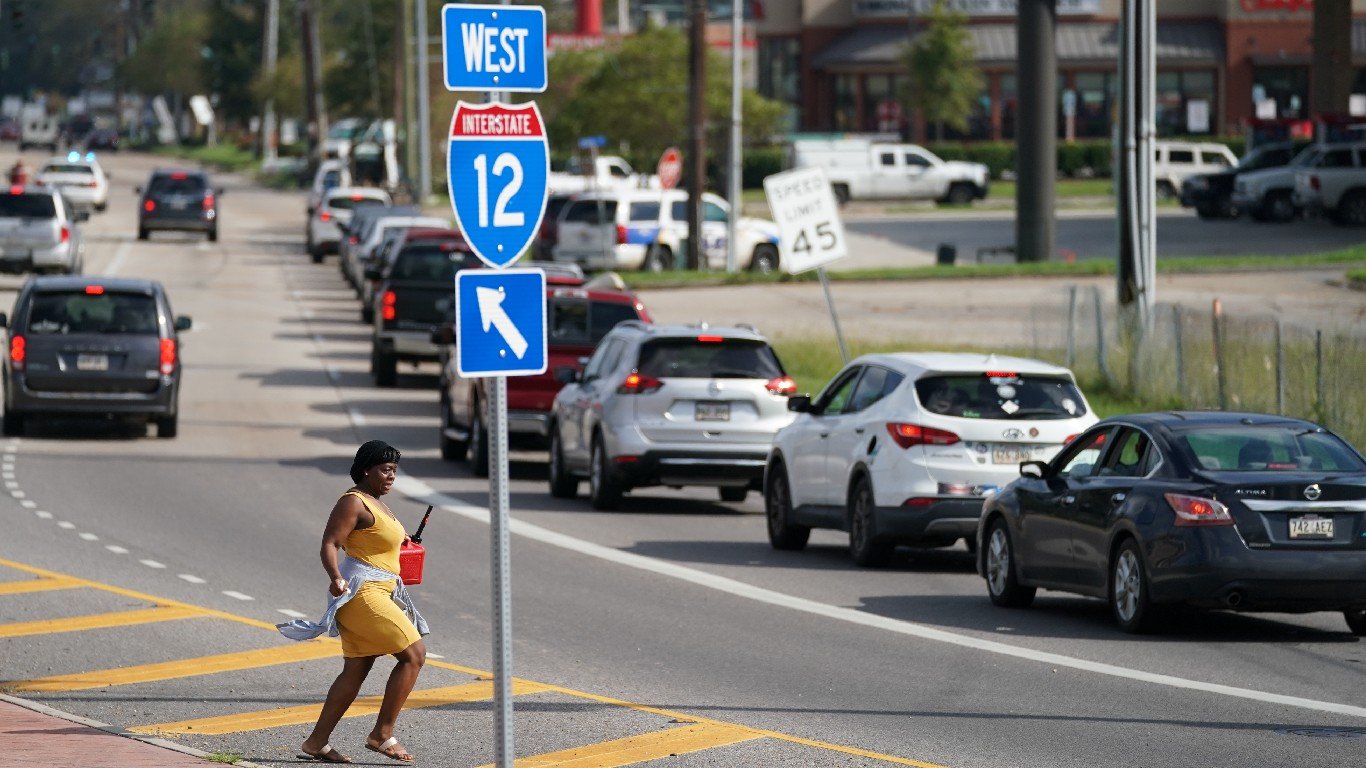
- Adults who don’t exercise: 33.4%
- Adult obesity rate: 40.8% — #19 out of 384 metro areas
- Adults in poor or fair health: 19.5% — #26 out of 384 metro areas
- Life expectancy: 74.6 years — #352 out of 384 metro areas
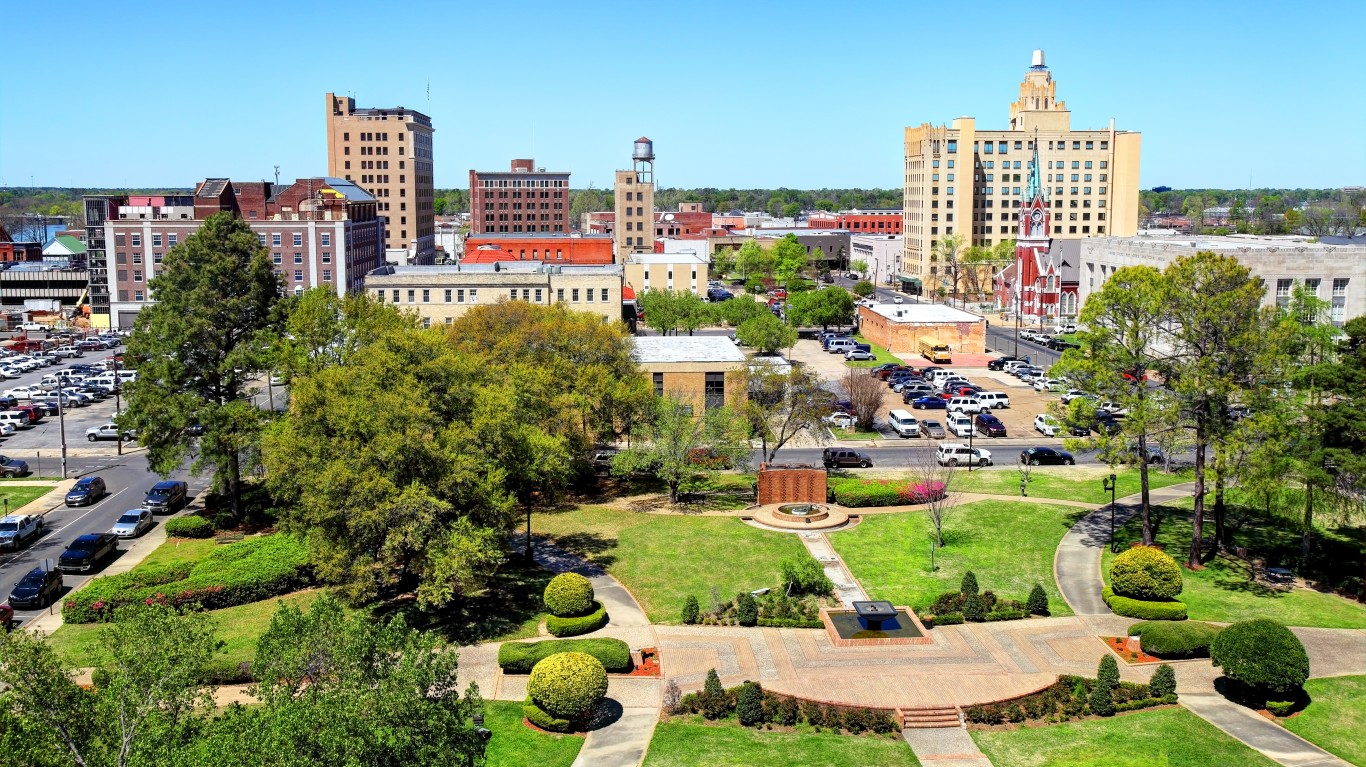
2. Pine Bluff, Arkansas
- Adults who don’t exercise: 33.7%
- Adult obesity rate: 42.9% — #6 out of 384 metro areas
- Adults in poor or fair health: 22.8% — #6 out of 384 metro areas
- Life expectancy: 72.9 years — #379 out of 384 metro areas
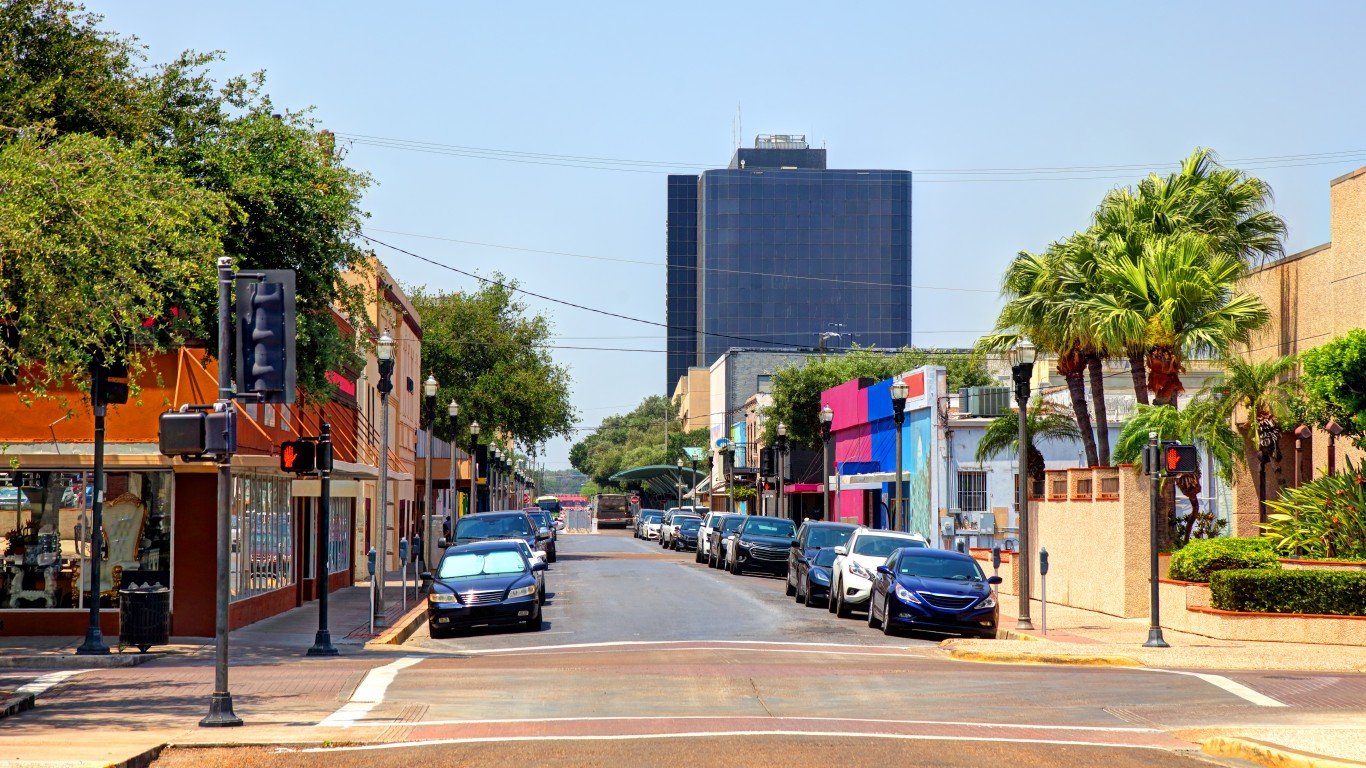
1. Laredo, Texas

- Adults who don’t exercise: 38.0%
- Adult obesity rate: 44.6% — #1 out of 384 metro areas
- Adults in poor or fair health: 27.4% — #3 out of 384 metro areas
- Life expectancy: 78.5 years — #143 out of 384 metro areas
(Take a look at the healthiest cities in the U.S.)