
From coast to coast, millions of Americans lack adequate health insurance. But certain cities stand out for their high rates of uninsured and underinsured residents. An analysis of government data reveals the metropolitan areas where health coverage lags furthest behind state and national levels.
To determine the city with the worst health insurance coverage in every state, 24/7 Tempo reviewed data on the health insurance coverage for the noninstitutionalized civilian population from the U.S. Census Bureau’s 2022 American Community Survey.
The results depict a patchwork of underserved communities. In Lake Worth Beach, Florida, more than 36% of adults under 65 — more than double the statewide rate — lack insurance of any kind. Almost as bad is the border city of Pharr, Texas, where the rate is 35.3%.
Rates of employer-provided plans also lag in many locales, leaving many to rely on Medicaid instead. For example, in San Luis, Arizona, just over 25% of those under 65 have workplace policies, while 42% are on Medicaid. Gaps emerge even in states known for robust health care like Massachusetts, where the city of Everett sees higher uninsurance and Medicaid usage than state averages.
The causes for lack of health insurance are complex, among them job instability, immigration status, and insurance costs. But the consequences are clear — limited preventive care, untreated chronic illness, and people declaring bankruptcy over medical bills. (See the health conditions with soaring medical costs in the U.S.)
Methodology
To determine the cities with the worst health insurance coverage in every state, 24/7 Tempo reviewed data on the health insurance coverage for the noninstitutionalized civilian population from the U.S. Census Bureau’s 2022 American Community Survey. Cities, towns, villages, and Census-designated places were ranked based on the percentage of the population 65 and under that does not have health insurance. We looked at the population under 65 because Americans 65 and older are automatically entitled to Medicare benefits. While the vast majority of those qualified for Medicare are 65 or older, people under 65 are entitled to Medicare if they have certain disabilities or are afflicted with permanent kidney failure or amyotrophic lateral sclerosis (ALS, or Lou Gehrig’s disease). Only cities with at least 25,000 residents were considered. It should be noted that Burlington is the only city in Vermont that meets the population requirements and therefore is the least insured city in the state by default, despite having a population that is relatively highly insured.
Alabama: Gadsden

- Adults under 65, no health insurance: 21.5% (state: 11.6%)
- Adults under 65, employer-based insurance: 37.1% (state: 52.1%)
- Adults under 65, direct-purchase insurance: 5.6% (state: 6.8%)
- Adults under 65, Medicare coverage: 2.2% (state: 1.7%)
- Adults under 65, Medicaid coverage: 21.9% (state: 16.5%)
- Adults under 65, TRICARE/military insurance: 0.7% (state: 1.8%)
- Adults under 65, VA coverage: 0.4% (state: 0.4%)
Alaska: Anchorage

- Adults under 65, no health insurance: 11.8% (state: 13.8%)
- Adults under 65, employer-based insurance: 49.3% (state: 46.2%)
- Adults under 65, direct-purchase insurance: 4.1% (state: 4.2%)
- Adults under 65, Medicare coverage: 0.5% (state: 0.5%)
- Adults under 65, Medicaid coverage: 15.9% (state: 18.5%)
- Adults under 65, TRICARE/military insurance: 6.0% (state: 5.3%)
- Adults under 65, VA coverage: 0.7% (state: 0.7%)
Arizona: San Luis

- Adults under 65, no health insurance: 23.5% (state: 12.8%)
- Adults under 65, employer-based insurance: 25.5% (state: 51.8%)
- Adults under 65, direct-purchase insurance: 2.2% (state: 6.6%)
- Adults under 65, Medicare coverage: 0.3% (state: 0.9%)
- Adults under 65, Medicaid coverage: 42.0% (state: 19.3%)
- Adults under 65, TRICARE/military insurance: 0.2% (state: 1.2%)
- Adults under 65, VA coverage: 0.0% (state: 0.4%)
Arkansas: Springdale

- Adults under 65, no health insurance: 20.2% (state: 10.3%)
- Adults under 65, employer-based insurance: 45.6% (state: 46.7%)
- Adults under 65, direct-purchase insurance: 4.8% (state: 6.9%)
- Adults under 65, Medicare coverage: 0.9% (state: 1.7%)
- Adults under 65, Medicaid coverage: 21.7% (state: 24.3%)
- Adults under 65, TRICARE/military insurance: 0.4% (state: 1.1%)
- Adults under 65, VA coverage: 0.3% (state: 0.5%)
California: Huntington Park

- Adults under 65, no health insurance: 21.1% (state: 8.2%)
- Adults under 65, employer-based insurance: 29.2% (state: 52.2%)
- Adults under 65, direct-purchase insurance: 3.6% (state: 8.3%)
- Adults under 65, Medicare coverage: 0.6% (state: 0.7%)
- Adults under 65, Medicaid coverage: 42.4% (state: 23.1%)
- Adults under 65, TRICARE/military insurance: 0.0% (state: 0.7%)
- Adults under 65, VA coverage: 0.1% (state: 0.2%)
Colorado: Aurora

- Adults under 65, no health insurance: 13.3% (state: 9.1%)
- Adults under 65, employer-based insurance: 50.9% (state: 56.5%)
- Adults under 65, direct-purchase insurance: 5.6% (state: 8.3%)
- Adults under 65, Medicare coverage: 0.9% (state: 0.6%)
- Adults under 65, Medicaid coverage: 20.2% (state: 16.0%)
- Adults under 65, TRICARE/military insurance: 1.3% (state: 2.0%)
- Adults under 65, VA coverage: 0.4% (state: 0.3%)
Connecticut: Norwalk

- Adults under 65, no health insurance: 16.0% (state: 6.1%)
- Adults under 65, employer-based insurance: 54.1% (state: 60.4%)
- Adults under 65, direct-purchase insurance: 7.2% (state: 6.8%)
- Adults under 65, Medicare coverage: 0.7% (state: 0.7%)
- Adults under 65, Medicaid coverage: 16.6% (state: 19.1%)
- Adults under 65, TRICARE/military insurance: 0.1% (state: 0.5%)
- Adults under 65, VA coverage: 0.2% (state: 0.2%)
Delaware: Dover

- Adults under 65, no health insurance: 7.2% (state: 7.1%)
- Adults under 65, employer-based insurance: 45.3% (state: 57.1%)
- Adults under 65, direct-purchase insurance: 5.8% (state: 6.0%)
- Adults under 65, Medicare coverage: 0.8% (state: 1.0%)
- Adults under 65, Medicaid coverage: 27.8% (state: 18.1%)
- Adults under 65, TRICARE/military insurance: 3.9% (state: 1.2%)
- Adults under 65, VA coverage: 0.5% (state: 0.2%)
Florida: Lake Worth Beach
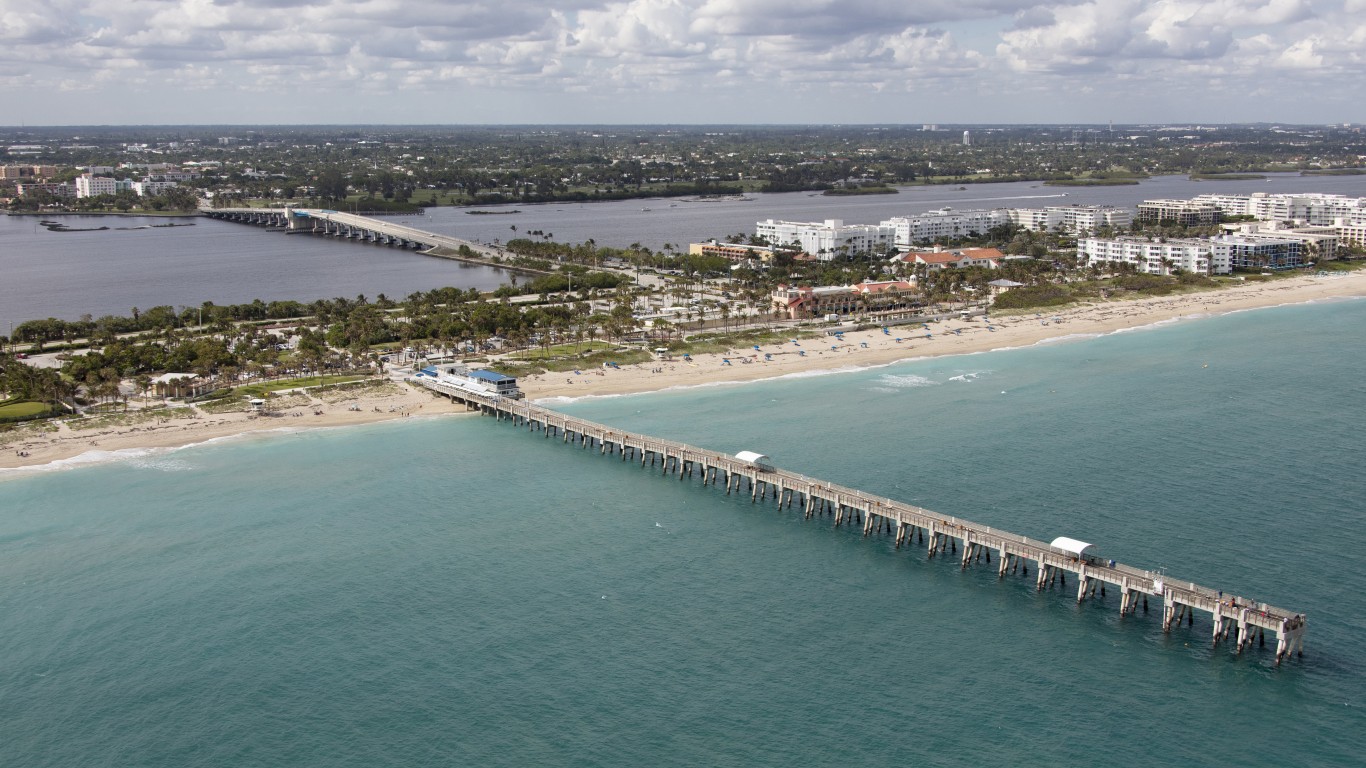
- Adults under 65, no health insurance: 36.2% (state: 15.6%)
- Adults under 65, employer-based insurance: 27.6% (state: 47.1%)
- Adults under 65, direct-purchase insurance: 8.1% (state: 12.2%)
- Adults under 65, Medicare coverage: 0.8% (state: 1.1%)
- Adults under 65, Medicaid coverage: 22.3% (state: 15.1%)
- Adults under 65, TRICARE/military insurance: 0.2% (state: 1.5%)
- Adults under 65, VA coverage: 0.5% (state: 0.4%)
Georgia: Chamblee
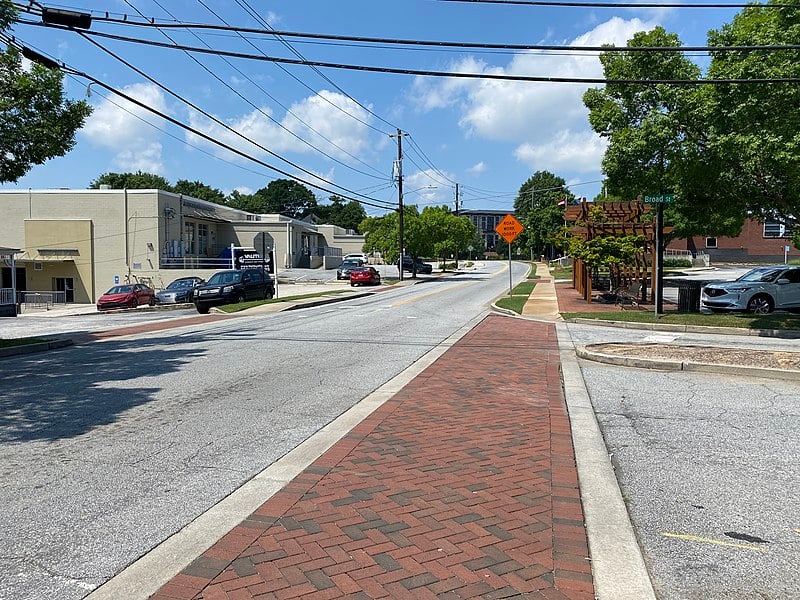
- Adults under 65, no health insurance: 28.1% (state: 15.1%)
- Adults under 65, employer-based insurance: 49.2% (state: 52.5%)
- Adults under 65, direct-purchase insurance: 5.3% (state: 7.1%)
- Adults under 65, Medicare coverage: 0.4% (state: 1.1%)
- Adults under 65, Medicaid coverage: 13.4% (state: 14.4%)
- Adults under 65, TRICARE/military insurance: 0.3% (state: 1.8%)
- Adults under 65, VA coverage: 0.1% (state: 0.4%)
Hawaii: Kahului
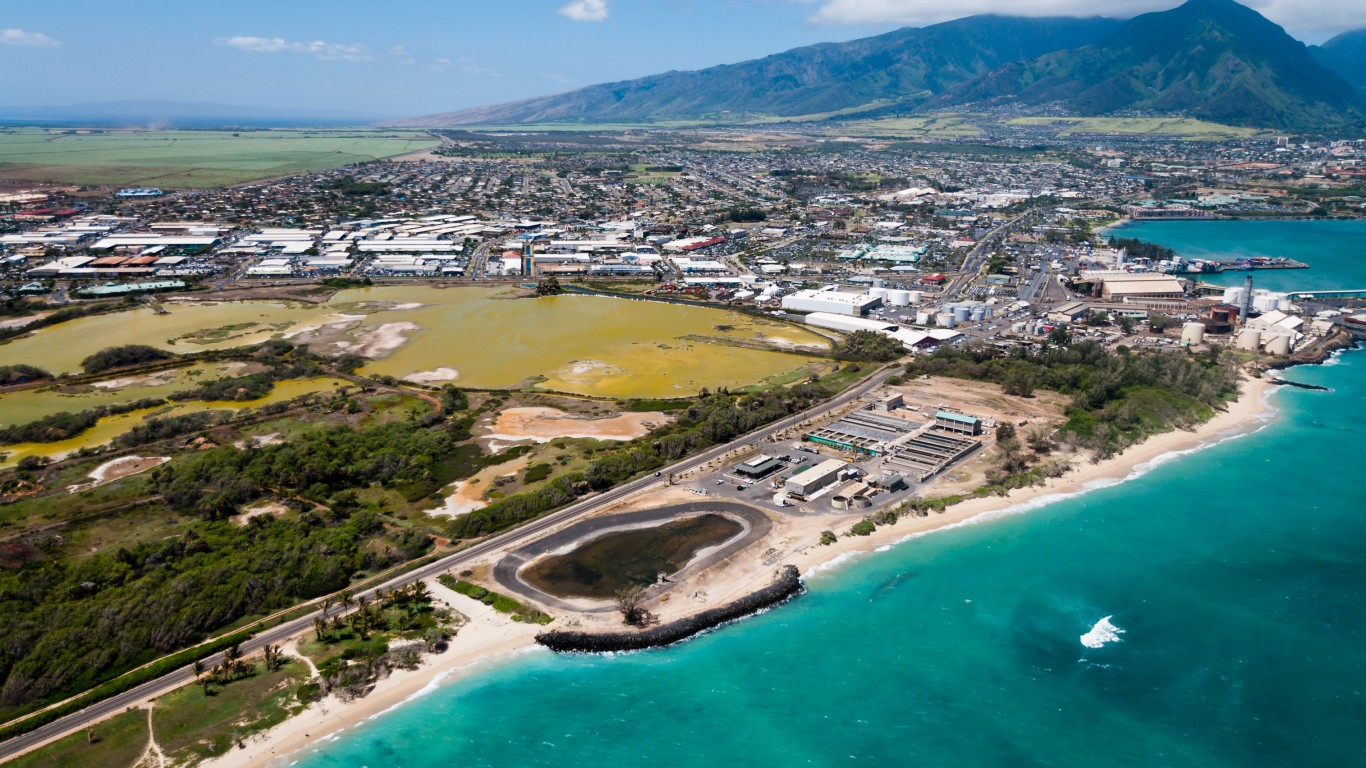
- Adults under 65, no health insurance: 7.0% (state: 4.8%)
- Adults under 65, employer-based insurance: 64.3% (state: 56.4%)
- Adults under 65, direct-purchase insurance: 4.7% (state: 5.8%)
- Adults under 65, Medicare coverage: 0.2% (state: 0.5%)
- Adults under 65, Medicaid coverage: 11.7% (state: 16.1%)
- Adults under 65, TRICARE/military insurance: 0.3% (state: 4.9%)
- Adults under 65, VA coverage: 0.1% (state: 0.2%)
Idaho: Caldwell

- Adults under 65, no health insurance: 14.2% (state: 12.0%)
- Adults under 65, employer-based insurance: 47.2% (state: 53.1%)
- Adults under 65, direct-purchase insurance: 5.3% (state: 9.8%)
- Adults under 65, Medicare coverage: 0.6% (state: 0.7%)
- Adults under 65, Medicaid coverage: 22.1% (state: 14.7%)
- Adults under 65, TRICARE/military insurance: 0.5% (state: 1.3%)
- Adults under 65, VA coverage: 0.4% (state: 0.4%)
Illinois: Cicero town

- Adults under 65, no health insurance: 19.9% (state: 8.1%)
- Adults under 65, employer-based insurance: 40.4% (state: 60.5%)
- Adults under 65, direct-purchase insurance: 3.3% (state: 6.5%)
- Adults under 65, Medicare coverage: 0.7% (state: 0.9%)
- Adults under 65, Medicaid coverage: 31.4% (state: 17.6%)
- Adults under 65, TRICARE/military insurance: 0.1% (state: 0.4%)
- Adults under 65, VA coverage: 0.3% (state: 0.2%)
Indiana: Goshen

- Adults under 65, no health insurance: 16.1% (state: 9.3%)
- Adults under 65, employer-based insurance: 52.9% (state: 59.9%)
- Adults under 65, direct-purchase insurance: 3.4% (state: 5.7%)
- Adults under 65, Medicare coverage: 0.2% (state: 1.1%)
- Adults under 65, Medicaid coverage: 21.6% (state: 16.1%)
- Adults under 65, TRICARE/military insurance: 0.0% (state: 0.6%)
- Adults under 65, VA coverage: 0.1% (state: 0.3%)
Iowa: Marshalltown
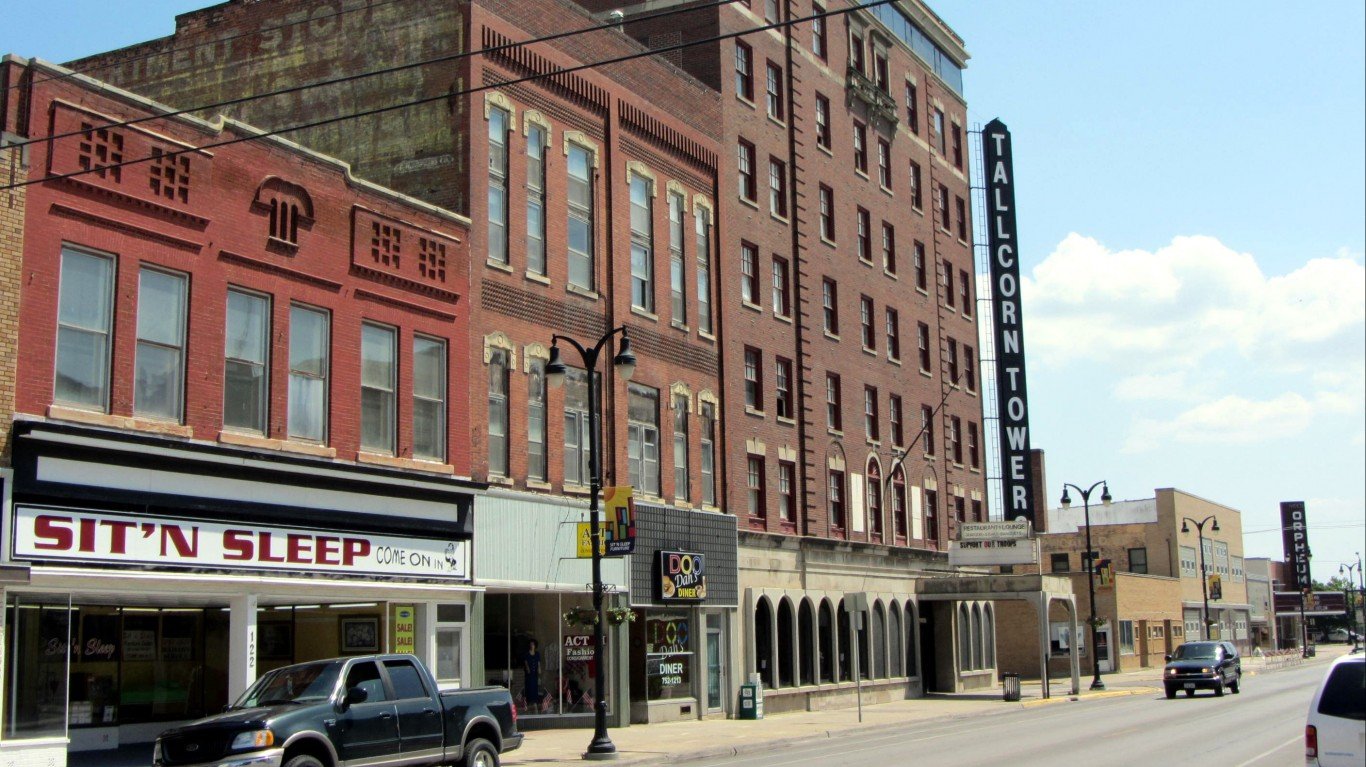
- Adults under 65, no health insurance: 8.2% (state: 5.8%)
- Adults under 65, employer-based insurance: 47.5% (state: 61.3%)
- Adults under 65, direct-purchase insurance: 4.8% (state: 6.7%)
- Adults under 65, Medicare coverage: 1.5% (state: 0.6%)
- Adults under 65, Medicaid coverage: 29.6% (state: 16.6%)
- Adults under 65, TRICARE/military insurance: 0.2% (state: 0.6%)
- Adults under 65, VA coverage: 0.2% (state: 0.3%)
Kansas: Kansas City

- Adults under 65, no health insurance: 20.1% (state: 10.5%)
- Adults under 65, employer-based insurance: 44.5% (state: 59.8%)
- Adults under 65, direct-purchase insurance: 4.2% (state: 7.5%)
- Adults under 65, Medicare coverage: 1.0% (state: 0.8%)
- Adults under 65, Medicaid coverage: 22.9% (state: 11.2%)
- Adults under 65, TRICARE/military insurance: 0.5% (state: 1.9%)
- Adults under 65, VA coverage: 0.5% (state: 0.3%)
Kentucky: Covington

- Adults under 65, no health insurance: 10.1% (state: 6.9%)
- Adults under 65, employer-based insurance: 46.0% (state: 52.1%)
- Adults under 65, direct-purchase insurance: 4.5% (state: 5.2%)
- Adults under 65, Medicare coverage: 1.3% (state: 1.7%)
- Adults under 65, Medicaid coverage: 28.4% (state: 24.1%)
- Adults under 65, TRICARE/military insurance: 0.5% (state: 1.1%)
- Adults under 65, VA coverage: 0.6% (state: 0.3%)
Louisiana: Terrytown

- Adults under 65, no health insurance: 21.5% (state: 9.7%)
- Adults under 65, employer-based insurance: 37.1% (state: 46.4%)
- Adults under 65, direct-purchase insurance: 3.8% (state: 6.0%)
- Adults under 65, Medicare coverage: 0.7% (state: 1.3%)
- Adults under 65, Medicaid coverage: 30.5% (state: 26.5%)
- Adults under 65, TRICARE/military insurance: 1.1% (state: 1.1%)
- Adults under 65, VA coverage: 0.2% (state: 0.4%)
Maine: Lewiston

- Adults under 65, no health insurance: 10.2% (state: 9.2%)
- Adults under 65, employer-based insurance: 50.5% (state: 56.5%)
- Adults under 65, direct-purchase insurance: 5.6% (state: 8.3%)
- Adults under 65, Medicare coverage: 1.3% (state: 0.9%)
- Adults under 65, Medicaid coverage: 21.6% (state: 14.0%)
- Adults under 65, TRICARE/military insurance: 1.1% (state: 1.3%)
- Adults under 65, VA coverage: 0.5% (state: 0.5%)
Maryland: Chillum

- Adults under 65, no health insurance: 23.9% (state: 6.9%)
- Adults under 65, employer-based insurance: 34.5% (state: 60.1%)
- Adults under 65, direct-purchase insurance: 7.4% (state: 6.3%)
- Adults under 65, Medicare coverage: 0.7% (state: 0.9%)
- Adults under 65, Medicaid coverage: 28.8% (state: 16.2%)
- Adults under 65, TRICARE/military insurance: 0.2% (state: 1.7%)
- Adults under 65, VA coverage: 0.1% (state: 0.2%)
Massachusetts: Everett

- Adults under 65, no health insurance: 9.5% (state: 3.2%)
- Adults under 65, employer-based insurance: 36.8% (state: 62.0%)
- Adults under 65, direct-purchase insurance: 7.0% (state: 7.2%)
- Adults under 65, Medicare coverage: 0.2% (state: 0.5%)
- Adults under 65, Medicaid coverage: 36.5% (state: 18.6%)
- Adults under 65, TRICARE/military insurance: 0.0% (state: 0.4%)
- Adults under 65, VA coverage: 0.0% (state: 0.1%)
Michigan: Pontiac

- Adults under 65, no health insurance: 15.2% (state: 6.3%)
- Adults under 65, employer-based insurance: 34.4% (state: 58.4%)
- Adults under 65, direct-purchase insurance: 3.4% (state: 6.2%)
- Adults under 65, Medicare coverage: 1.1% (state: 0.9%)
- Adults under 65, Medicaid coverage: 37.7% (state: 19.4%)
- Adults under 65, TRICARE/military insurance: 0.2% (state: 0.4%)
- Adults under 65, VA coverage: 0.2% (state: 0.2%)
Minnesota: Brooklyn Center

- Adults under 65, no health insurance: 11.1% (state: 5.4%)
- Adults under 65, employer-based insurance: 45.4% (state: 64.2%)
- Adults under 65, direct-purchase insurance: 4.0% (state: 6.5%)
- Adults under 65, Medicare coverage: 0.8% (state: 0.6%)
- Adults under 65, Medicaid coverage: 31.9% (state: 15.9%)
- Adults under 65, TRICARE/military insurance: 0.2% (state: 0.5%)
- Adults under 65, VA coverage: 0.3% (state: 0.2%)
Mississippi: Gulfport
- Adults under 65, no health insurance: 20.4% (state: 14.3%)
- Adults under 65, employer-based insurance: 35.2% (state: 47.1%)
- Adults under 65, direct-purchase insurance: 4.0% (state: 6.5%)
- Adults under 65, Medicare coverage: 1.3% (state: 1.4%)
- Adults under 65, Medicaid coverage: 23.7% (state: 19.8%)
- Adults under 65, TRICARE/military insurance: 4.1% (state: 1.6%)
- Adults under 65, VA coverage: 0.9% (state: 0.3%)
Missouri: Grandview

- Adults under 65, no health insurance: 20.4% (state: 11.3%)
- Adults under 65, employer-based insurance: 44.4% (state: 59.1%)
- Adults under 65, direct-purchase insurance: 6.4% (state: 7.4%)
- Adults under 65, Medicare coverage: 2.2% (state: 1.4%)
- Adults under 65, Medicaid coverage: 16.6% (state: 12.4%)
- Adults under 65, TRICARE/military insurance: 0.8% (state: 1.0%)
- Adults under 65, VA coverage: 0.9% (state: 0.4%)
Montana: Great Falls

- Adults under 65, no health insurance: 9.1% (state: 10.4%)
- Adults under 65, employer-based insurance: 43.2% (state: 48.9%)
- Adults under 65, direct-purchase insurance: 5.6% (state: 10.0%)
- Adults under 65, Medicare coverage: 0.7% (state: 0.9%)
- Adults under 65, Medicaid coverage: 24.2% (state: 19.5%)
- Adults under 65, TRICARE/military insurance: 6.1% (state: 1.5%)
- Adults under 65, VA coverage: 0.4% (state: 0.5%)
Nebraska: Grand Island

- Adults under 65, no health insurance: 15.0% (state: 9.4%)
- Adults under 65, employer-based insurance: 53.4% (state: 60.9%)
- Adults under 65, direct-purchase insurance: 5.9% (state: 8.6%)
- Adults under 65, Medicare coverage: 0.5% (state: 0.6%)
- Adults under 65, Medicaid coverage: 16.3% (state: 10.9%)
- Adults under 65, TRICARE/military insurance: 0.4% (state: 1.6%)
- Adults under 65, VA coverage: 0.2% (state: 0.3%)
Nevada: Winchester

- Adults under 65, no health insurance: 23.4% (state: 13.2%)
- Adults under 65, employer-based insurance: 33.6% (state: 53.6%)
- Adults under 65, direct-purchase insurance: 5.8% (state: 6.4%)
- Adults under 65, Medicare coverage: 1.2% (state: 1.0%)
- Adults under 65, Medicaid coverage: 28.4% (state: 16.8%)
- Adults under 65, TRICARE/military insurance: 0.9% (state: 1.3%)
- Adults under 65, VA coverage: 0.3% (state: 0.5%)
New Hampshire: Manchester

- Adults under 65, no health insurance: 10.4% (state: 7.1%)
- Adults under 65, employer-based insurance: 56.1% (state: 65.8%)
- Adults under 65, direct-purchase insurance: 5.0% (state: 6.8%)
- Adults under 65, Medicare coverage: 1.4% (state: 1.3%)
- Adults under 65, Medicaid coverage: 19.8% (state: 11.7%)
- Adults under 65, TRICARE/military insurance: 1.0% (state: 0.8%)
- Adults under 65, VA coverage: 0.4% (state: 0.3%)
New Jersey: Union City

- Adults under 65, no health insurance: 27.9% (state: 8.8%)
- Adults under 65, employer-based insurance: 31.7% (state: 62.3%)
- Adults under 65, direct-purchase insurance: 4.7% (state: 6.8%)
- Adults under 65, Medicare coverage: 0.5% (state: 0.9%)
- Adults under 65, Medicaid coverage: 30.5% (state: 15.3%)
- Adults under 65, TRICARE/military insurance: 0.1% (state: 0.4%)
- Adults under 65, VA coverage: 0.1% (state: 0.1%)
New Mexico: Santa Fe

- Adults under 65, no health insurance: 16.0% (state: 11.5%)
- Adults under 65, employer-based insurance: 40.7% (state: 39.9%)
- Adults under 65, direct-purchase insurance: 8.5% (state: 5.2%)
- Adults under 65, Medicare coverage: 0.5% (state: 1.1%)
- Adults under 65, Medicaid coverage: 26.2% (state: 31.0%)
- Adults under 65, TRICARE/military insurance: 0.4% (state: 1.6%)
- Adults under 65, VA coverage: 0.2% (state: 0.3%)
New York: Spring Valley

- Adults under 65, no health insurance: 15.0% (state: 6.2%)
- Adults under 65, employer-based insurance: 24.4% (state: 54.7%)
- Adults under 65, direct-purchase insurance: 5.7% (state: 7.5%)
- Adults under 65, Medicare coverage: 0.5% (state: 0.7%)
- Adults under 65, Medicaid coverage: 47.4% (state: 22.7%)
- Adults under 65, TRICARE/military insurance: 0.6% (state: 0.3%)
- Adults under 65, VA coverage: 0.1% (state: 0.1%)
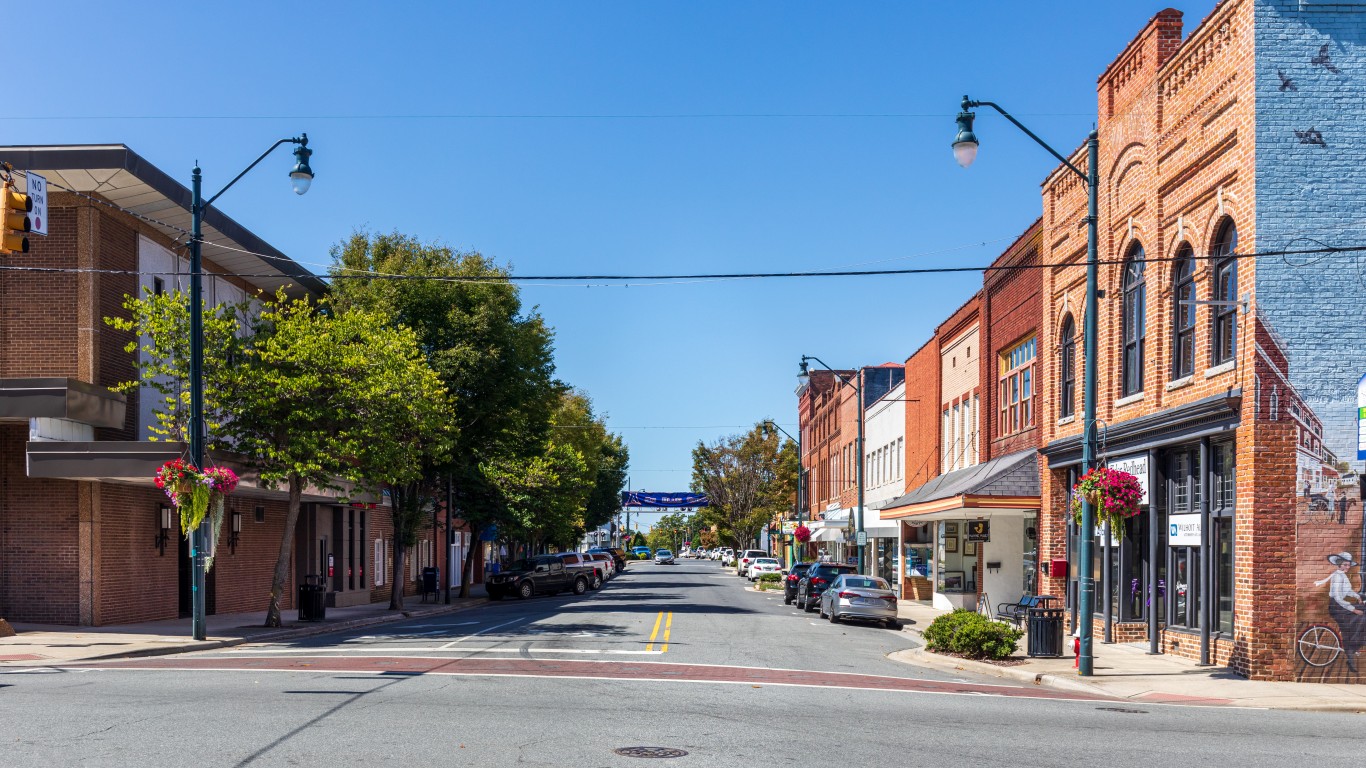
North Carolina: Asheboro
- Adults under 65, no health insurance: 21.4% (state: 12.7%)
- Adults under 65, employer-based insurance: 36.0% (state: 51.7%)
- Adults under 65, direct-purchase insurance: 3.5% (state: 8.4%)
- Adults under 65, Medicare coverage: 1.3% (state: 1.2%)
- Adults under 65, Medicaid coverage: 30.2% (state: 15.7%)
- Adults under 65, TRICARE/military insurance: 0.6% (state: 2.2%)
- Adults under 65, VA coverage: 0.6% (state: 0.4%)
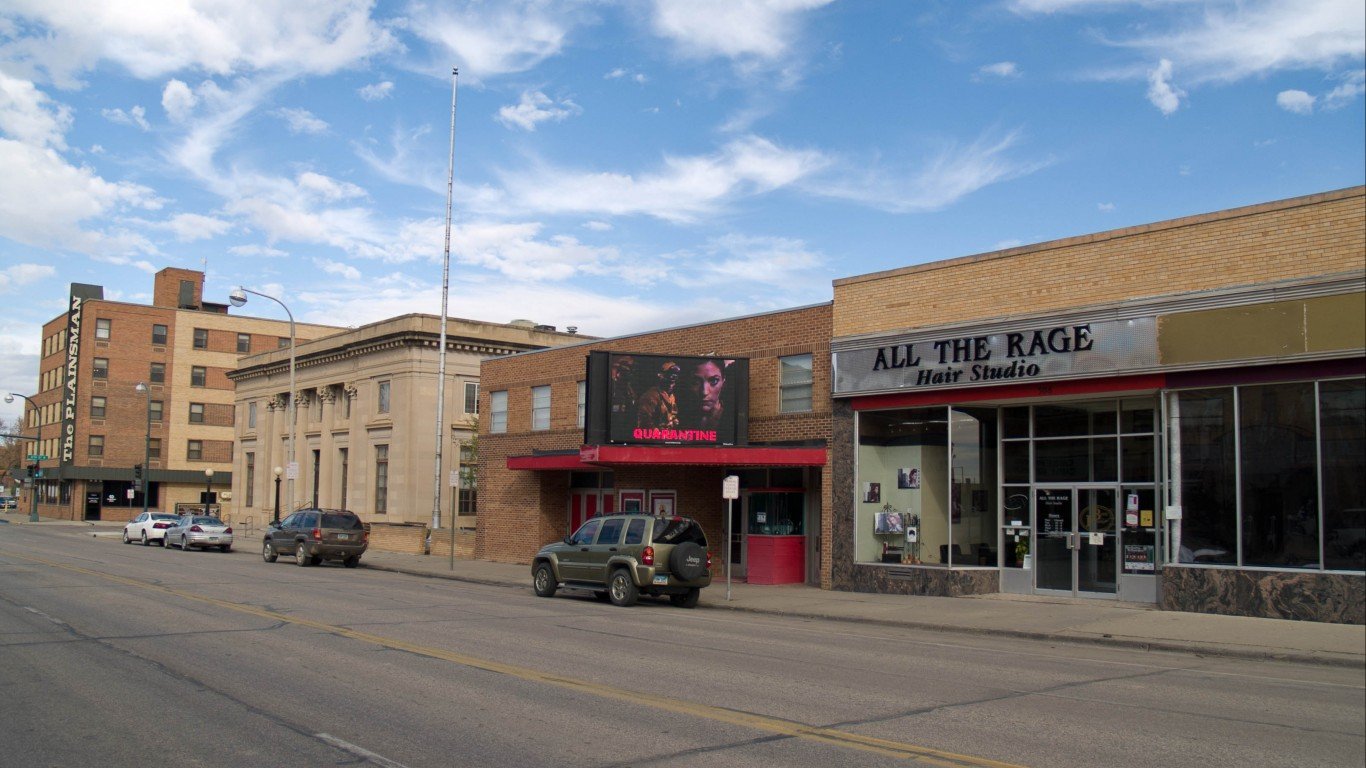
North Dakota: Williston
- Adults under 65, no health insurance: 14.4% (state: 8.8%)
- Adults under 65, employer-based insurance: 70.6% (state: 61.8%)
- Adults under 65, direct-purchase insurance: 3.5% (state: 9.8%)
- Adults under 65, Medicare coverage: 0.7% (state: 0.6%)
- Adults under 65, Medicaid coverage: 5.1% (state: 9.3%)
- Adults under 65, TRICARE/military insurance: 0.3% (state: 1.8%)
- Adults under 65, VA coverage: 0.4% (state: 0.2%)
Ohio: Middletown

- Adults under 65, no health insurance: 12.8% (state: 7.5%)
- Adults under 65, employer-based insurance: 42.2% (state: 59.2%)
- Adults under 65, direct-purchase insurance: 3.3% (state: 5.4%)
- Adults under 65, Medicare coverage: 1.3% (state: 1.1%)
- Adults under 65, Medicaid coverage: 31.5% (state: 18.9%)
- Adults under 65, TRICARE/military insurance: 0.3% (state: 0.6%)
- Adults under 65, VA coverage: 0.4% (state: 0.3%)
Oklahoma: Enid

- Adults under 65, no health insurance: 19.6% (state: 16.8%)
- Adults under 65, employer-based insurance: 45.5% (state: 49.0%)
- Adults under 65, direct-purchase insurance: 5.4% (state: 6.9%)
- Adults under 65, Medicare coverage: 1.0% (state: 1.6%)
- Adults under 65, Medicaid coverage: 16.9% (state: 15.7%)
- Adults under 65, TRICARE/military insurance: 3.6% (state: 1.6%)
- Adults under 65, VA coverage: 0.5% (state: 0.5%)
Oregon: Woodburn

- Adults under 65, no health insurance: 15.8% (state: 8.0%)
- Adults under 65, employer-based insurance: 38.8% (state: 55.3%)
- Adults under 65, direct-purchase insurance: 3.5% (state: 7.4%)
- Adults under 65, Medicare coverage: 2.6% (state: 0.8%)
- Adults under 65, Medicaid coverage: 35.5% (state: 19.7%)
- Adults under 65, TRICARE/military insurance: 0.1% (state: 0.5%)
- Adults under 65, VA coverage: 0.3% (state: 0.4%)
Pennsylvania: Hazleton

- Adults under 65, no health insurance: 15.8% (state: 6.7%)
- Adults under 65, employer-based insurance: 34.4% (state: 59.9%)
- Adults under 65, direct-purchase insurance: 5.0% (state: 6.7%)
- Adults under 65, Medicare coverage: 2.5% (state: 0.9%)
- Adults under 65, Medicaid coverage: 35.4% (state: 16.9%)
- Adults under 65, TRICARE/military insurance: 0.0% (state: 0.4%)
- Adults under 65, VA coverage: 0.2% (state: 0.2%)
Rhode Island: Providence

- Adults under 65, no health insurance: 7.5% (state: 5.2%)
- Adults under 65, employer-based insurance: 42.2% (state: 58.3%)
- Adults under 65, direct-purchase insurance: 8.9% (state: 7.6%)
- Adults under 65, Medicare coverage: 1.0% (state: 0.9%)
- Adults under 65, Medicaid coverage: 31.8% (state: 18.7%)
- Adults under 65, TRICARE/military insurance: 0.1% (state: 0.6%)
- Adults under 65, VA coverage: 0.2% (state: 0.2%)
South Carolina: Myrtle Beach

- Adults under 65, no health insurance: 23.5% (state: 12.6%)
- Adults under 65, employer-based insurance: 35.4% (state: 50.8%)
- Adults under 65, direct-purchase insurance: 11.4% (state: 7.7%)
- Adults under 65, Medicare coverage: 1.8% (state: 1.3%)
- Adults under 65, Medicaid coverage: 22.3% (state: 16.8%)
- Adults under 65, TRICARE/military insurance: 0.5% (state: 1.8%)
- Adults under 65, VA coverage: 0.3% (state: 0.4%)
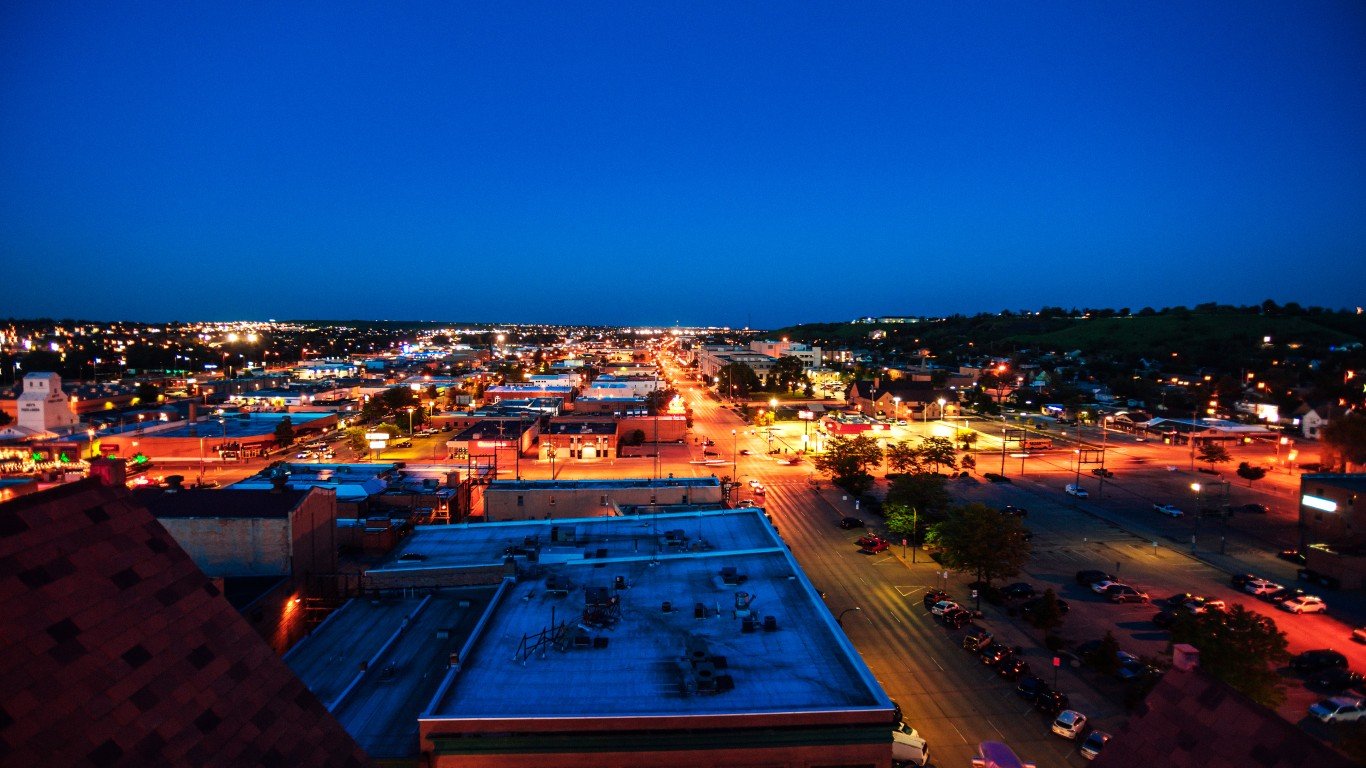
South Dakota: Rapid City
- Adults under 65, no health insurance: 14.2% (state: 11.4%)
- Adults under 65, employer-based insurance: 50.5% (state: 56.6%)
- Adults under 65, direct-purchase insurance: 6.7% (state: 9.8%)
- Adults under 65, Medicare coverage: 0.7% (state: 0.8%)
- Adults under 65, Medicaid coverage: 13.4% (state: 11.3%)
- Adults under 65, TRICARE/military insurance: 4.2% (state: 1.9%)
- Adults under 65, VA coverage: 0.4% (state: 0.4%)
Tennessee: Morristown

- Adults under 65, no health insurance: 18.4% (state: 11.9%)
- Adults under 65, employer-based insurance: 31.7% (state: 52.7%)
- Adults under 65, direct-purchase insurance: 5.7% (state: 6.9%)
- Adults under 65, Medicare coverage: 2.5% (state: 1.2%)
- Adults under 65, Medicaid coverage: 33.9% (state: 16.6%)
- Adults under 65, TRICARE/military insurance: 0.2% (state: 1.4%)
- Adults under 65, VA coverage: 0.2% (state: 0.4%)
Texas: Pharr

- Adults under 65, no health insurance: 35.3% (state: 19.8%)
- Adults under 65, employer-based insurance: 24.3% (state: 50.7%)
- Adults under 65, direct-purchase insurance: 5.1% (state: 6.8%)
- Adults under 65, Medicare coverage: 4.1% (state: 0.8%)
- Adults under 65, Medicaid coverage: 25.5% (state: 14.1%)
- Adults under 65, TRICARE/military insurance: 0.0% (state: 1.3%)
- Adults under 65, VA coverage: 0.5% (state: 0.4%)
Utah: Kearns

- Adults under 65, no health insurance: 20.5% (state: 10.0%)
- Adults under 65, employer-based insurance: 56.2% (state: 64.5%)
- Adults under 65, direct-purchase insurance: 5.1% (state: 10.3%)
- Adults under 65, Medicare coverage: 0.4% (state: 0.4%)
- Adults under 65, Medicaid coverage: 12.9% (state: 7.7%)
- Adults under 65, TRICARE/military insurance: 0.4% (state: 1.0%)
- Adults under 65, VA coverage: 0.1% (state: 0.1%)
Vermont: Burlington

- Adults under 65, no health insurance: 3.3% (state: 5.0%)
- Adults under 65, employer-based insurance: 61.8% (state: 56.1%)
- Adults under 65, direct-purchase insurance: 11.6% (state: 7.6%)
- Adults under 65, Medicare coverage: 0.5% (state: 1.1%)
- Adults under 65, Medicaid coverage: 15.5% (state: 21.6%)
- Adults under 65, TRICARE/military insurance: 0.4% (state: 0.7%)
- Adults under 65, VA coverage: 0.0% (state: 0.2%)
Virginia: Woodbridge

- Adults under 65, no health insurance: 20.2% (state: 9.2%)
- Adults under 65, employer-based insurance: 48.4% (state: 58.4%)
- Adults under 65, direct-purchase insurance: 5.6% (state: 6.6%)
- Adults under 65, Medicare coverage: 0.5% (state: 1.1%)
- Adults under 65, Medicaid coverage: 13.1% (state: 11.5%)
- Adults under 65, TRICARE/military insurance: 2.7% (state: 4.3%)
- Adults under 65, VA coverage: 0.3% (state: 0.5%)
Washington: Yakima

- Adults under 65, no health insurance: 14.4% (state: 7.4%)
- Adults under 65, employer-based insurance: 38.9% (state: 57.8%)
- Adults under 65, direct-purchase insurance: 3.1% (state: 6.4%)
- Adults under 65, Medicare coverage: 1.1% (state: 0.7%)
- Adults under 65, Medicaid coverage: 34.9% (state: 17.8%)
- Adults under 65, TRICARE/military insurance: 0.4% (state: 1.8%)
- Adults under 65, VA coverage: 0.1% (state: 0.3%)
West Virginia: Huntington

- Adults under 65, no health insurance: 10.8% (state: 7.9%)
- Adults under 65, employer-based insurance: 41.9% (state: 50.7%)
- Adults under 65, direct-purchase insurance: 5.2% (state: 3.8%)
- Adults under 65, Medicare coverage: 2.2% (state: 1.8%)
- Adults under 65, Medicaid coverage: 29.4% (state: 24.6%)
- Adults under 65, TRICARE/military insurance: 0.5% (state: 0.8%)
- Adults under 65, VA coverage: 0.6% (state: 0.5%)
Wisconsin: Milwaukee

- Adults under 65, no health insurance: 10.3% (state: 6.5%)
- Adults under 65, employer-based insurance: 44.5% (state: 64.1%)
- Adults under 65, direct-purchase insurance: 4.5% (state: 6.6%)
- Adults under 65, Medicare coverage: 0.9% (state: 0.7%)
- Adults under 65, Medicaid coverage: 31.8% (state: 13.8%)
- Adults under 65, TRICARE/military insurance: 0.2% (state: 0.5%)
- Adults under 65, VA coverage: 0.3% (state: 0.3%)
Wyoming: Casper
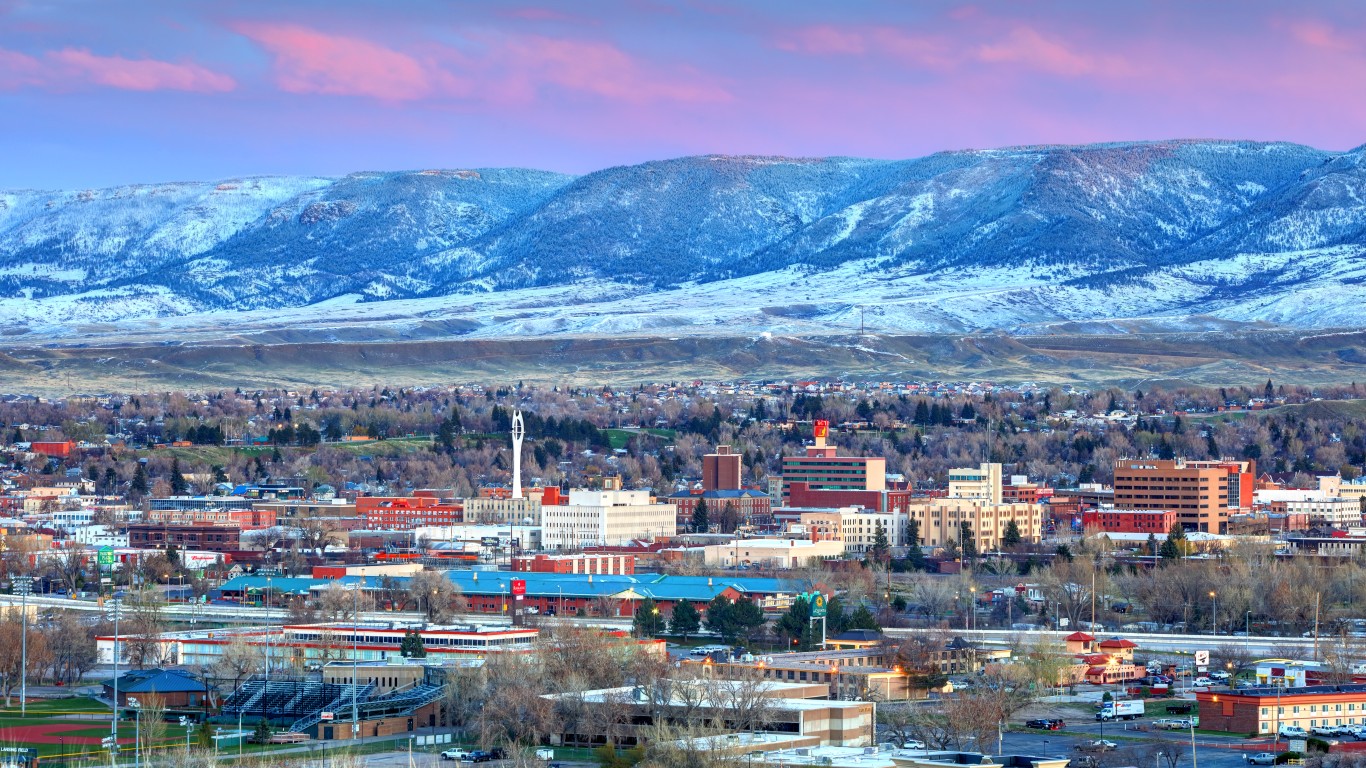
- Adults under 65, no health insurance: 13.6% (state: 14.0%)
- Adults under 65, employer-based insurance: 60.8% (state: 58.7%)
- Adults under 65, direct-purchase insurance: 6.8% (state: 8.5%)
- Adults under 65, Medicare coverage: 0.3% (state: 0.7%)
- Adults under 65, Medicaid coverage: 10.5% (state: 8.9%)
- Adults under 65, TRICARE/military insurance: 0.8% (state: 1.6%)
- Adults under 65, VA coverage: 0.6% (state: 0.4%)