The story of American immigration is the story of the unique experiment called the United States. About 14% of U.S. residents were born outside of the country, and 94% identify with an ancestry other than American.
In its annual American Community Survey, the U.S. Census Bureau asks Americans to identify their ancestry. Ancestry refers to a person’s lineage or ethnic origin. Ethnic composition varies heavily across the United States and is often a reflection of centuries-old migration patterns. Every state has a unique ethnic community whose history can in many cases be traced back hundreds of years.
To determine the most unusual ancestry in every state, 24/7 Wall St. reviewed data from the ACS on the 106 most commonly reported ancestries. The ancestry with the largest share of respondents in a state relative to the national share — a calculation known as the location quotient — was defined as the most unusual ancestry.
The United States has never had a consistent immigration policy. Early waves of immigrants — from the 17th century to the mid-19th century — flowed into the country seeking religious freedom and economic opportunity mostly from European countries. In an act of xenophobia, America slammed the door shut on Chinese immigrants with the 1882 Chinese Exclusion Act. The opening of Ellis Island in New York in 1892 helped process the tide of immigrants from Europe who filled the ranks of factory workers as the country’s economic expansion accelerated. The nation changed its immigration laws in 1965 to end a quota-based system that favored immigrants from Europe, leading to greater numbers from Asian and Latin American countries.
According to the Migration Policy Institute, immigrants coming to the United States today are more likely to be from Asia than any other world region. U.S. Department of Homeland Security statistics show that more than one in three individuals who obtain lawful permanent resident status in 2018 were from Asia. Immigrants today are also on average more educated than previous generations of migrants to the U.S. Nearly one-third of adult immigrants had a college degree or more in 2018, an almost identical percentage to native-born Americans. Each wave of immigrants enriches American culture and creates unique neighborhoods and enclaves. Here are America’s melting pot cities.
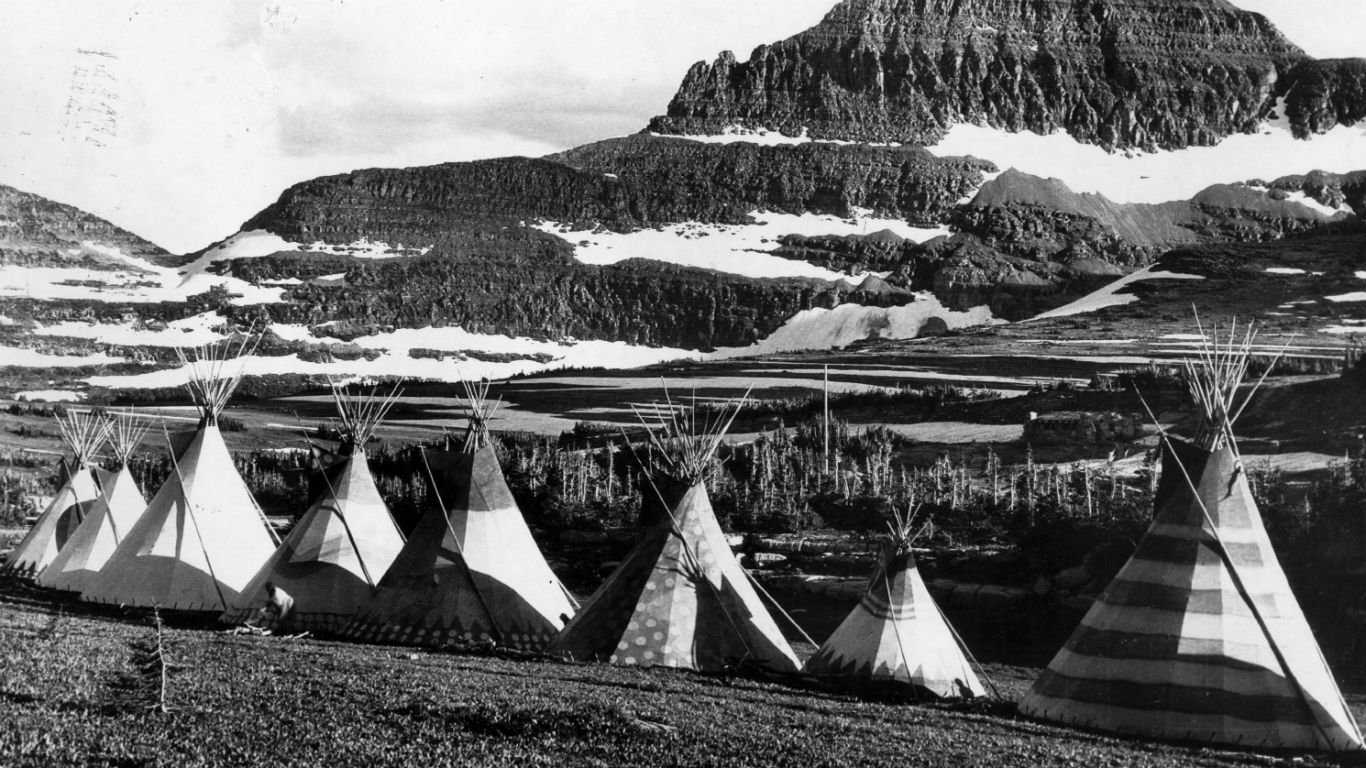
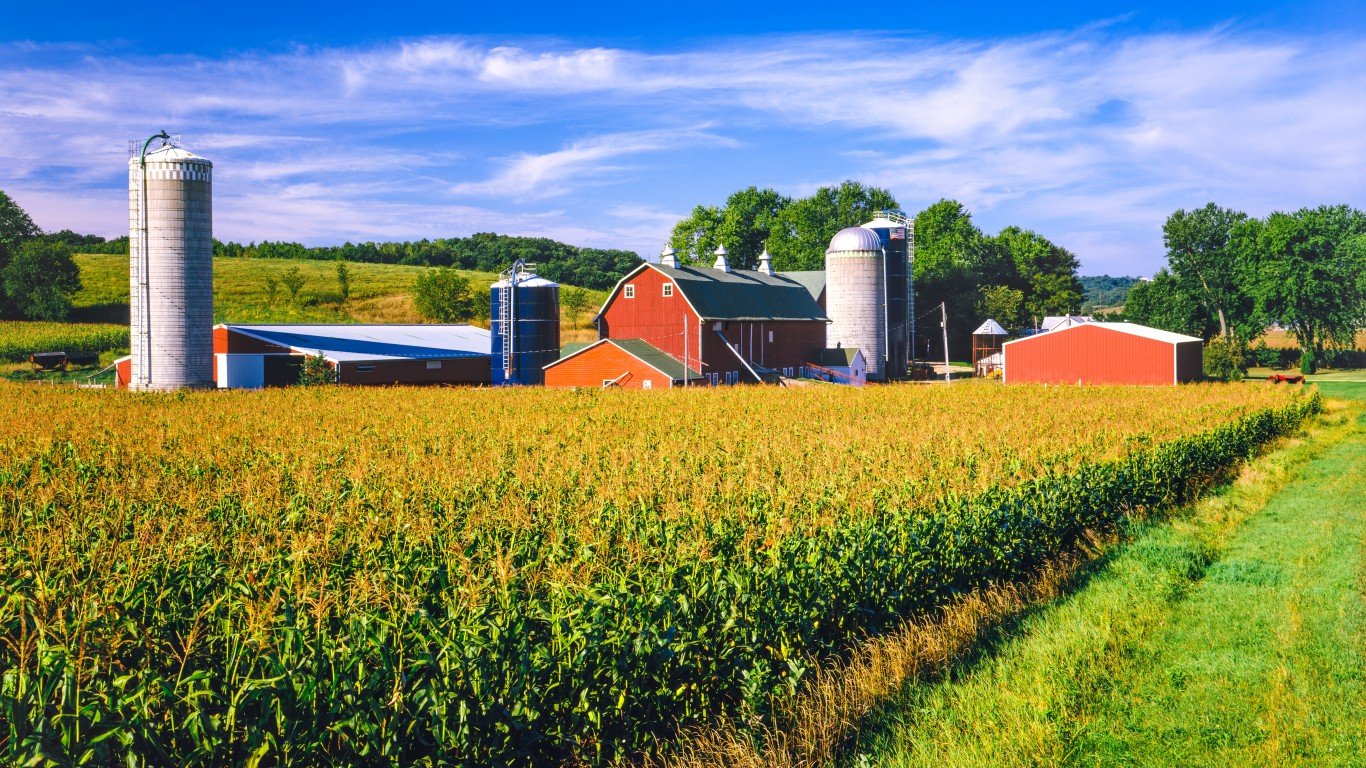
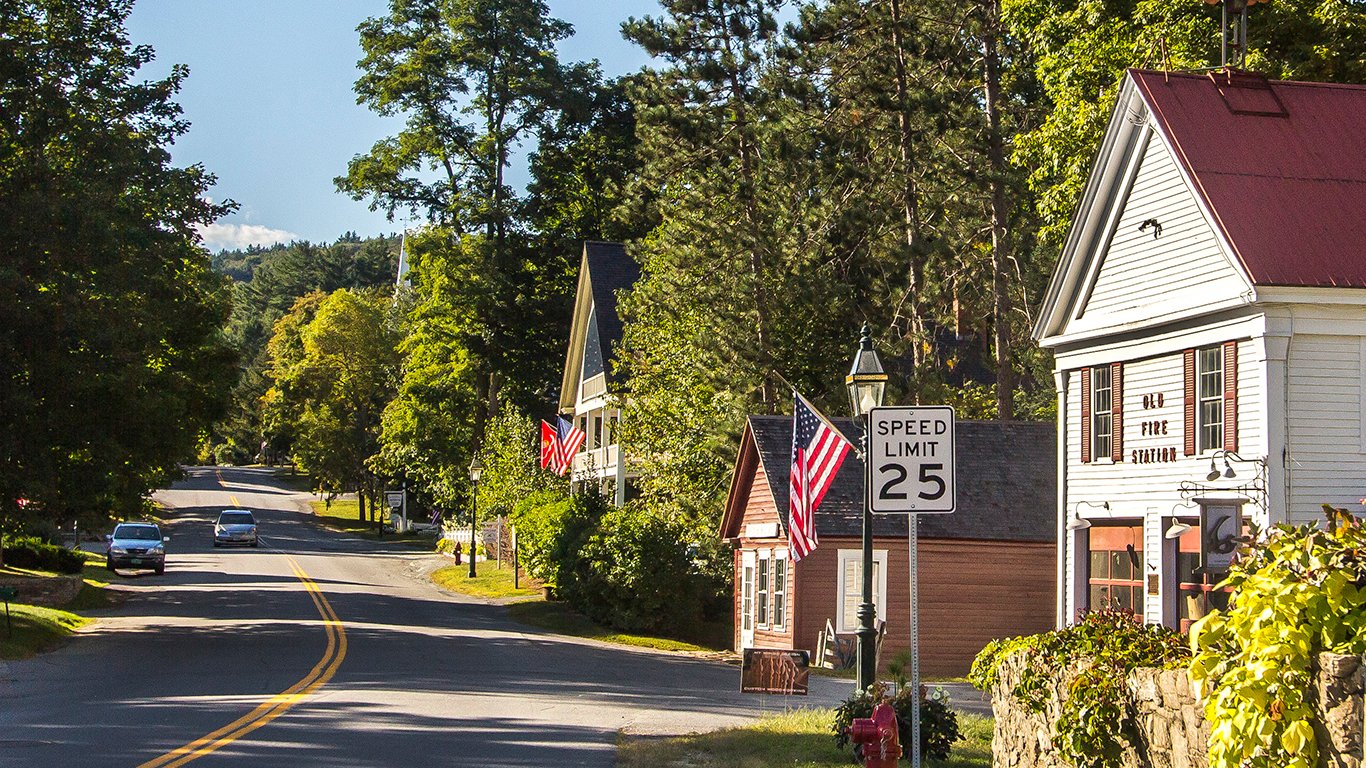
Alabama
> Most unusual ancestry: American
> Concentration in Alabama of residents with American ancestry: 2.6 times higher than share of U.S. population
> Share of Alabama residents identifying as having American ancestry: 16.36% (Total: 796,096)
> Share of US pop. identifying as having American ancestry: 6.40% (total: 20,678,613)
> Share of all US residents identifying as having American ancestry living in Alabama: 3.85%
The concentration of those identifying as having American ancestry in Alabama is 2.6 times the concentration of American ancestry in the U.S. population. Many people who identify as American are at least fourth generation Americans, whose grandparents or great-grandparents were born in the United States. Many are also white Americans living in Southern states.
Alaska
> Most unusual ancestry: Sudanese
> Concentration in Alaska of residents with Sudanese ancestry: 7.1 times higher than share of U.S. population
> Share of Alaska residents identifying as having Sudanese ancestry: 0.12% (Total: 920)
> Share of US pop. identifying as having Sudanese ancestry: 0.02% (total: 56,988)
> Share of all US residents identifying as having Sudanese ancestry living in Alaska: 1.61%
Immigrants from the African nation of Sudan are the most unique ancestry in Alaska, with a concentration in the nation’s largest state more than seven times the concentration in the U.S. population.
Alaska’s Bureau of Land Management has hosted events such as an explorer camp to help newly arrived refugees and immigrants adjust to their new home.
Arizona
> Most unusual ancestry: Iraqi
> Concentration in Arizona of residents with Iraqi ancestry: 2.4 times higher than share of U.S. population
> Share of Arizona residents identifying as having Iraqi ancestry: 0.11% (Total: 7,664)
> Share of US pop. identifying as having Iraqi ancestry: 0.05% (total: 145,539)
> Share of all US residents identifying as having Iraqi ancestry living in Arizona: 5.27%
Arizona took in 3,858 refugees in 2015, the fifth most of any state after Florida, Texas, California, or New York. Some 717 of these refugees were from Iraq, the most of any country. The concentration in Arizona of residents with Iraqi ancestry is 2.4 times higher than the concentration in the U.S. population, and is the second highest of any state. Today, 0.1% of Arizona residents identify as having Iraqi ancestry.
On June 22, President Donald Trump, citing the pandemic and high unemployment, announced new limits on visas that allow immigrants to temporarily work in the United States, marking the latest effort to limit the entry of immigrants — among them those from Iraq — to the U.S.
Arkansas
> Most unusual ancestry: Dutch West Indian
> Concentration in Arkansas of residents with Dutch West Indian ancestry: 5.2 times higher than share of U.S. population
> Share of Arkansas residents identifying as having Dutch West Indian ancestry: 0.07% (Total: 2,005)
> Share of US pop. identifying as having Dutch West Indian ancestry: 0.01% (total: 41,368)
> Share of all US residents identifying as having Dutch West Indian ancestry living in Arkansas: 4.85%
Dutch West Indian Americans are descendants of the Netherlands Antilles, a former country that consisted of a series of islands in the Caribbean under Dutch rule for approximately four centuries.
A total of 2,005 Arkansas residents identify as Dutch West Indian, and the 0.07% share of respondents claiming Dutch West Indian ancestry in Arkansas is more than five times the 0.01% national share, the highest concentration relative to the nation of any ancestry in the state.
California
> Most unusual ancestry: Armenian
> Concentration in California of residents with Armenian ancestry: 4.5 times higher than share of U.S. population
> Share of California residents identifying as having Armenian ancestry: 0.65% (Total: 252,679)
> Share of US pop. identifying as having Armenian ancestry: 0.14% (total: 462,137)
> Share of all US residents identifying as having Armenian ancestry living in California: 54.68%
Some 252,679 ACS respondents in California identify as Armenian, the most of any state and 54.7% of the total U.S. Armenian population.
The first Armenians settled in California in 1874, just 24 years after the state joined the Union. The area is notable for its large agricultural output and ethnic diversity among its farmers. More Armenians migrated to the area in the 1920s, following the 1915 Armenian Genocide. California’s large Armenian population was able to help some refugees of the genocide receive reparations.
Colorado
> Most unusual ancestry: German Russian
> Concentration in Colorado of residents with German Russian ancestry: 3.2 times higher than share of U.S. population
> Share of Colorado residents identifying as having German Russian ancestry: 0.02% (Total: 1,362)
> Share of US pop. identifying as having German Russian ancestry: 0.01% (total: 24,617)
> Share of all US residents identifying as having German Russian ancestry living in Colorado: 5.53%
German Russian people are descendants of German settlers who immigrated to the Russian steppes in the mid-18th century. One of the largest waves of German Russian immigration to the state began in the 1870s, when a group of German Russians facing economic hardship in Russia settled in the sugar beet farming region of northeast Colorado. The share of Colorado residents identifying as having German Russian ancestry of 0.02%, or a total population of 1,362, is more than three times the share of the U.S. population identifying as having German Russian ancestry.
Connecticut
> Most unusual ancestry: Albanian
> Concentration in Connecticut of residents with Albanian ancestry: 4.8 times higher than share of U.S. population
> Share of Connecticut residents identifying as having Albanian ancestry: 0.29% (Total: 10,225)
> Share of US pop. identifying as having Albanian ancestry: 0.06% (total: 191,264)
> Share of all US residents identifying as having Albanian ancestry living in Connecticut: 5.35%
Some 0.29% of ACS respondents in Connecticut, or 10,255 people, identified as Albanian, about five times the 0.06% of Americans who identify as Albanians nationwide and the highest concentration of any ancestry in the state relative to the nation. About 191,000 people in the U.S. identify as Albanian.
Other states with high concentrations of Albanians include Massachusetts, Michigan, and New York. The first Albanian immigrated to America in 1884 and settled in Boston. One of the first major waves of Albanian immigrants to America was during World War II, when Albania came under communist control and a sect of Albanians living in Greece were forcibly expelled from the country.
Delaware
> Most unusual ancestry: Bermudan
> Concentration in Delaware of residents with Bermudan ancestry: 6.2 times higher than share of U.S. population
> Share of Delaware residents identifying as having Bermudan ancestry: 0.01% (Total: 112)
> Share of US pop. identifying as having Bermudan ancestry: 0.00% (total: 6,146)
> Share of all US residents identifying as having Bermudan ancestry living in Delaware: 1.82%
The concentration in Delaware of residents with Bermudan ancestry is 6.2 times higher than the concentration of residents with Bermudan ancestry in the U.S. population. The share of Delaware residents identifying as having Bermudan ancestry is 0.01%, or 112 residents.

Florida
> Most unusual ancestry: Bahamian
> Concentration in Florida of residents with Bahamian ancestry: 9.5 times higher than share of U.S. population
> Share of Florida residents identifying as having Bahamian ancestry: 0.16% (Total: 32,959)
> Share of US pop. identifying as having Bahamian ancestry: 0.02% (total: 54,128)
> Share of all US residents identifying as having Bahamian ancestry living in Florida: 60.89%
Some 32,959 ACS respondents in Florida identify as Bahamian, approximately 61% of the total U.S. population who identify as having Bahamian ancestry. Bahamians comprise 0.16% of the Florida population, more than nine times the 0.02% national concentration and the most of any ancestry in Florida relative to the U.S. as a whole.
Florida’s east coast is just a 50-mile boat trip from the western islands of the Bahamas. Bahamians began visiting the Florida Keys in large groups in the early 19th century to salvage cargo from sunken ships. More settled in Florida as economic opportunities for immigrants expanded.
Georgia
> Most unusual ancestry: U.S. Virgin Islander
> Concentration in Georgia of residents with U.S. Virgin Islander ancestry: 3.5 times higher than share of U.S. population
> Share of Georgia residents identifying as having U.S. Virgin Islander ancestry: 0.02% (Total: 2,191)
> Share of US pop. identifying as having U.S. Virgin Islander ancestry: 0.01% (total: 19,498)
> Share of all US residents identifying as having U.S. Virgin Islander ancestry living in Georgia: 11.24%
Some 0.02%, or 2,191 of Georgia residents, identify as having U.S. Virgin Islander ancestry, which is more than three times the share of those identifying as having U.S. Virgin Islander ancestry in the U.S. population. Hurricanes Irma and Maria in 2017 forced many U.S. Virgin Islanders to flee the islands and go to Georgia.
Hawaii
> Most unusual ancestry: Portuguese
> Concentration in Hawaii of residents with Portuguese ancestry: 8.0 times higher than share of U.S. population
> Share of Hawaii residents identifying as having Portuguese ancestry: 3.38% (Total: 48,129)
> Share of US pop. identifying as having Portuguese ancestry: 0.42% (total: 1,358,190)
> Share of all US residents identifying as having Portuguese ancestry living in Hawaii: 3.54%
The Portuguese began to immigrate to Hawaii in the late 19th century, when sugarcane plantations offered economic opportunities to skilled laborers from the Madeira and Azores Islands of Portugal.
Today, some 48,129 Hawaiians identify as Portuguese, 3.54% of the 1.4 million Americans who claim the ancestry nationwide. Portuguese Hawaiians make up 3.38% of the state’s population, eight times the 0.42% of Americans who identify as Portuguese nationwide.
Idaho
> Most unusual ancestry: Basque
> Concentration in Idaho of residents with Basque ancestry: 23.9 times higher than share of U.S. population
> Share of Idaho residents identifying as having Basque ancestry: 0.45% (Total: 7,667)
> Share of US pop. identifying as having Basque ancestry: 0.02% (total: 61,264)
> Share of all US residents identifying as having Basque ancestry living in Idaho: 12.51%
Some 7,667 Americans in Idaho identify as Basque — or 0.45% of the state’s population — the highest Basque concentration of any state. Americans with Basque heritage trace their roots to a region along the Spanish and French border. Early Basque immigrants largely came to the United States through South America during the California gold rush in the mid-19th century.
Today, Americans of Basque descent are heavily concentrated western states such as California, Nevada, and Oregon. Cities in Idaho with high concentrations of people who identify as Basque include Shoshone, Cascade, and Rupert.

Illinois
> Most unusual ancestry: Bulgarian
> Concentration in Illinois of residents with Bulgarian ancestry: 3.5 times higher than share of U.S. population
> Share of Illinois residents identifying as having Bulgarian ancestry: 0.11% (Total: 13,952)
> Share of US pop. identifying as having Bulgarian ancestry: 0.03% (total: 101,027)
> Share of all US residents identifying as having Bulgarian ancestry living in Illinois: 13.81%
In Illinois, 13,952 residents identify as having Bulgarian ancestry, or 0.11%, which is almost four times the share of residents identifying as having Bulgarian ancestry in the overall U.S. population.
One major wave of Bulgarian immigration to Illinois began in the early 20th century, when Bulgarians came to work in factories in cities like Granite City, Madison, and Venice, as they fled the political upheaval in the Balkans at that time.

Indiana
> Most unusual ancestry: Macedonian
> Concentration in Indiana of residents with Macedonian ancestry: 3.8 times higher than share of U.S. population
> Share of Indiana residents identifying as having Macedonian ancestry: 0.07% (Total: 4,837)
> Share of US pop. identifying as having Macedonian ancestry: 0.02% (total: 61,976)
> Share of all US residents identifying as having Macedonian ancestry living in Indiana: 7.80%
Macedonian Americans are descendants of an ethnic group who came from the Balkan Peninsula. Currently, some 61,976 Americans claim Macedonian heritage â and about 1 in every 13 of them live in Indiana.
The largest waves of Macedonian immigration to the United States took place in the early 20th century, before the outbreak of World War I and again in the 1990s. Poor economic conditions in the Balkans and economic opportunity in the United States largely explain the mass migration.
Iowa
> Most unusual ancestry: Luxembourger
> Concentration in Iowa of residents with Luxembourger ancestry: 11.7 times higher than share of U.S. population
> Share of Iowa residents identifying as having Luxembourger ancestry: 0.15% (Total: 4,666)
> Share of US pop. identifying as having Luxembourger ancestry: 0.01% (total: 40,979)
> Share of all US residents identifying as having Luxembourger ancestry living in Iowa: 11.39%
Though Luxembourgers, who come from one of the world’s smallest countries, can trace their ethnicity’s presence in the United States as far back as 1630, the first major wave of immigrants from Luxembourg was in the 1830s and 1840s, after many faced difficulty attempting to settle in South America.
Driven by economic opportunity — inexpensive Midwestern farmland in particular — immigration from the landlocked Western European country to the United States continued through the later half of the 19th century. The looming threat of fascism and ethnic cleansing in Europe drove several hundred Jewish Luxembourgers to the United States in the early 20th century. Currently, about one in every nine Americans claiming to be of Luxembourger descent live in Iowa.

Kansas
> Most unusual ancestry: German Russian
> Concentration in Kansas of residents with German Russian ancestry: 5.7 times higher than share of U.S. population
> Share of Kansas residents identifying as having German Russian ancestry: 0.04% (Total: 1,272)
> Share of US pop. identifying as having German Russian ancestry: 0.01% (total: 24,617)
> Share of all US residents identifying as having German Russian ancestry living in Kansas: 5.17%
Kansas is one of three states where German Russian is the most unusual ancestry. There are 1,272 people in Kansas who identify as German Russian, or 0.04% of the state population. This share is approximately six times the share of those who identify as German Russian in the overall U.S. population.
A large wave of German Russians immigrated to Kansas in the 1870s. Large settlements of German Russians emerged in Russell County and Topeka.
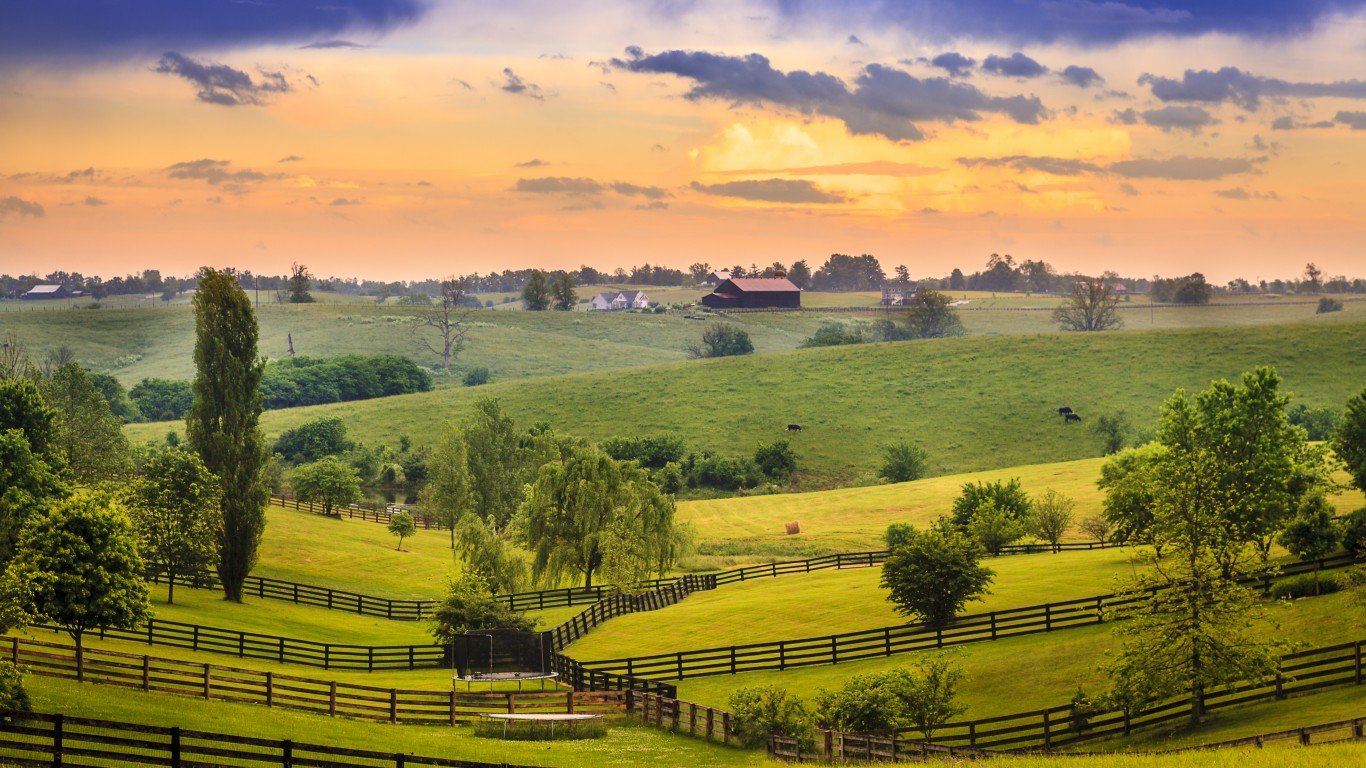
Kentucky
> Most unusual ancestry: American
> Concentration in Kentucky of residents with American ancestry: 2.5 times higher than share of U.S. population
> Share of Kentucky residents identifying as having American ancestry: 16.11% (Total: 715,314)
> Share of US pop. identifying as having American ancestry: 6.40% (total: 20,678,613)
> Share of all US residents identifying as having American ancestry living in Kentucky: 3.46%
Some 16.1% of Kentucky residents, or 715,314 people, identify as having American ancestry, more than double the share of the U.S. population identifying as having American ancestry.
Individuals who claim American ancestry are often fourth-generation Americans whose grandparents or great-grandparents were born here. Many are also white Americans who live in the South. An estimated 84.5% of the Kentucky population is white, far more than the 60.2% share of Americans nationwide and among the most of any state.
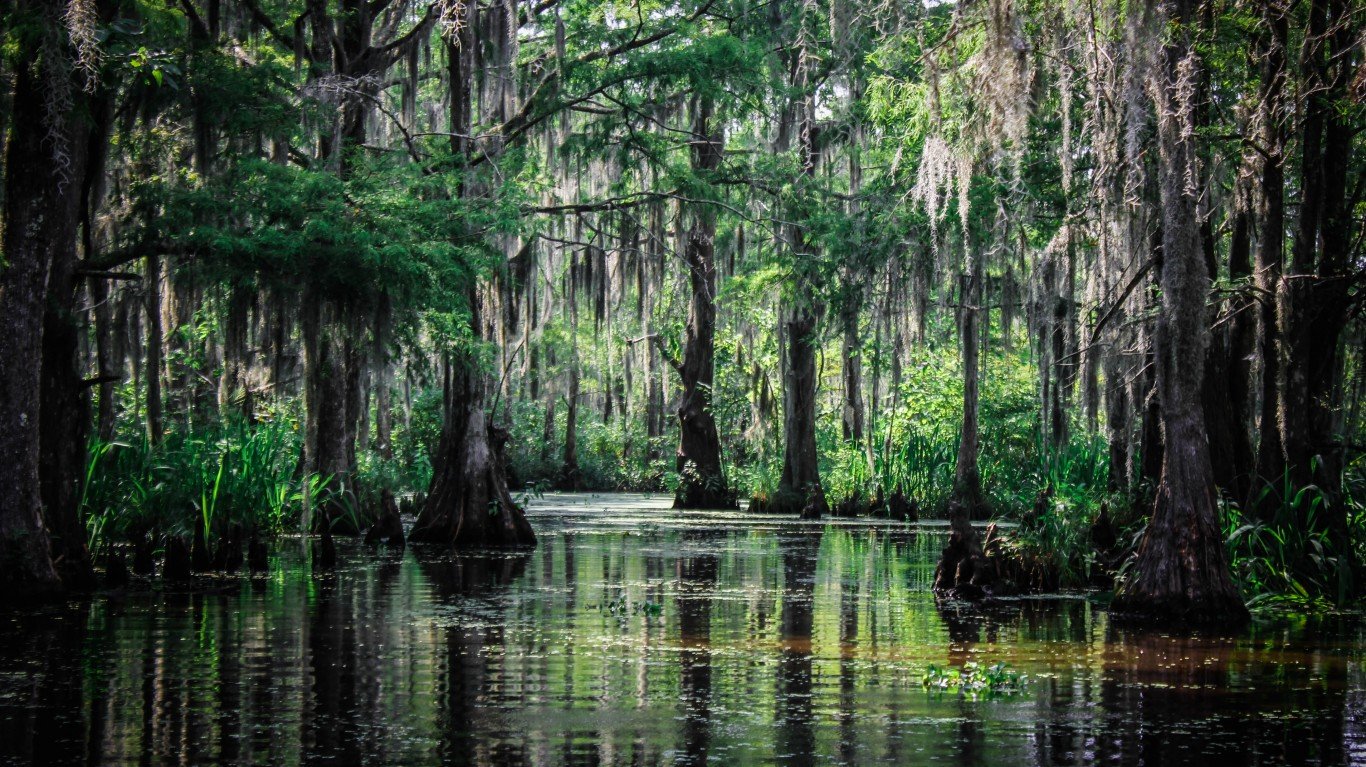
Louisiana
> Most unusual ancestry: Cajun
> Concentration in Louisiana of residents with Cajun ancestry: 34.5 times higher than share of U.S. population
> Share of Louisiana residents identifying as having Cajun ancestry: 1.21% (Total: 56,338)
> Share of US pop. identifying as having Cajun ancestry: 0.04% (total: 113,065)
> Share of all US residents identifying as having Cajun ancestry living in Louisiana: 49.83%
About half of all Americans who claim Cajun heritage live in Louisiana. The share of Louisiana residents identifying as having Cajun ancestry is 1.21%, 30 times the share in the U.S. of 0.04%.
The roots of most Cajun people in Louisiana trace back nearly half a millenium to the Acadians â people of French heritage who settled along Canada’s eastern coast. Historically neutral in French and English conflicts in the New World, the Acadians were driven from their home when the British demanded their loyalty in 1754. Acadians who refused to pledge loyalty to the Crown were killed or arrested, but many escaped. By 1784, thousands of Acadians were estimated to have settled in Louisiana, then a Spanish colony.

Maine
> Most unusual ancestry: French Canadian
> Concentration in Maine of residents with French Canadian ancestry: 12.2 times higher than share of U.S. population
> Share of Maine residents identifying as having French Canadian ancestry: 7.95% (Total: 105,930)
> Share of US pop. identifying as having French Canadian ancestry: 0.65% (total: 2,095,503)
> Share of all US residents identifying as having French Canadian ancestry living in Maine: 5.06%
Almost 8% of Maine residents identify as French Canadian, 12 times the 0.7% share of Americans nationwide who claim French Canadian ancestry. Due to their proximity to their ancestral homeland of eastern Canada — Maine and Quebec share a border — French Canadian Americans may have been able to preserve francophone culture in America to a greater degree than other ethnicities. Some 4.2% of Maine residents today speak French, the most of any language other than English and the largest share of French speakers in the country.
French Canadians are an ethnic group who descend from French colonists who settled in eastern Canada around the 17th century. French Canadians began to immigrate to New England in large numbers for textile and logging jobs in the 19th century, and today the largest shares of U.S. residents claiming French Canadian ancestry are in New Hampshire, Vermont, and Maine.
Maryland
> Most unusual ancestry: Sierra Leonean
> Concentration in Maryland of residents with Sierra Leonean ancestry: 14.9 times higher than share of U.S. population
> Share of Maryland residents identifying as having Sierra Leonean ancestry: 0.10% (Total: 5,812)
> Share of US pop. identifying as having Sierra Leonean ancestry: 0.01% (total: 21,003)
> Share of all US residents identifying as having Sierra Leonean ancestry living in Maryland: 27.67%
The share of Maryland residents identifying as having Sierra Leonean ancestry is 10 times the overall share of the U.S. population claiming ancestry from that African nation. Nearly 28% of all U.S. residents identifying as having Sierra Leonean ancestry live in Maryland.
Recent archaeological findings in Anne Arundel County uncovered DNA from former slave quarters that was linked to slaves who were brought to North America from Sierra Leone.
Massachusetts
> Most unusual ancestry: Cape Verdean
> Concentration in Massachusetts of residents with Cape Verdean ancestry: 29.8 times higher than share of U.S. population
> Share of Massachusetts residents identifying as having Cape Verdean ancestry: 1.04% (Total: 71,084)
> Share of US pop. identifying as having Cape Verdean ancestry: 0.03% (total: 112,715)
> Share of all US residents identifying as having Cape Verdean ancestry living in Massachusetts: 63.07%
Some 71,084 people in Massachusetts are from — or are descendants of people from — the African island nation of Cape Verde, or more than 63% of all U.S. residents identifying as having Cape Verdean ancestry.
Droughts and famines on the Cabo Verde first drove large waves of immigrants to the Americas in the late 19th and early 20th centuries. Many Cabo Verdeans settled in Massachusetts after finding employment on Massachusetts whaling ships that stopped at the island. Leading up to WWI, Cabo Verdeans continued to settle in Massachusetts, many finding work in cranberry bogs in Cape Cod.

Michigan
> Most unusual ancestry: Assyrian/Chaldean/Syriac
> Concentration in Michigan of residents with Assyrian/Chaldean/Syriac ancestry: 14.3 times higher than share of U.S. population
> Share of Michigan residents identifying as having Assyrian/Chaldean/Syriac ancestry: 0.46% (Total: 45,929)
> Share of US pop. identifying as having Assyrian/Chaldean/Syriac ancestry: 0.03% (total: 104,381)
> Share of all US residents identifying as having Assyrian/Chaldean/Syriac ancestry living in Michigan: 44.00%
About 44% of Assyrian, Chaldean, and Syriac Americans, or 45,929 people, live in Michigan today.
The first large wave of Assyrian immigration to Michigan was in the early 20th century, as Assyrians left the Middle East and found employment in Detroit’s growing automobile industry. More Assyrians followed their friends and family to Michigan in the 1970s as political turmoil in the Middle East drove large swaths of the population out of the region. The 1970s also created numerous economic opportunities for immigrants in Michigan as white residents left downtown Detroit following the 1967 riots and the decline of the auto industry. Residents of Assyrian descent took over the area’s grocery industry, and today they own an estimated 90% of the region’s food stores.
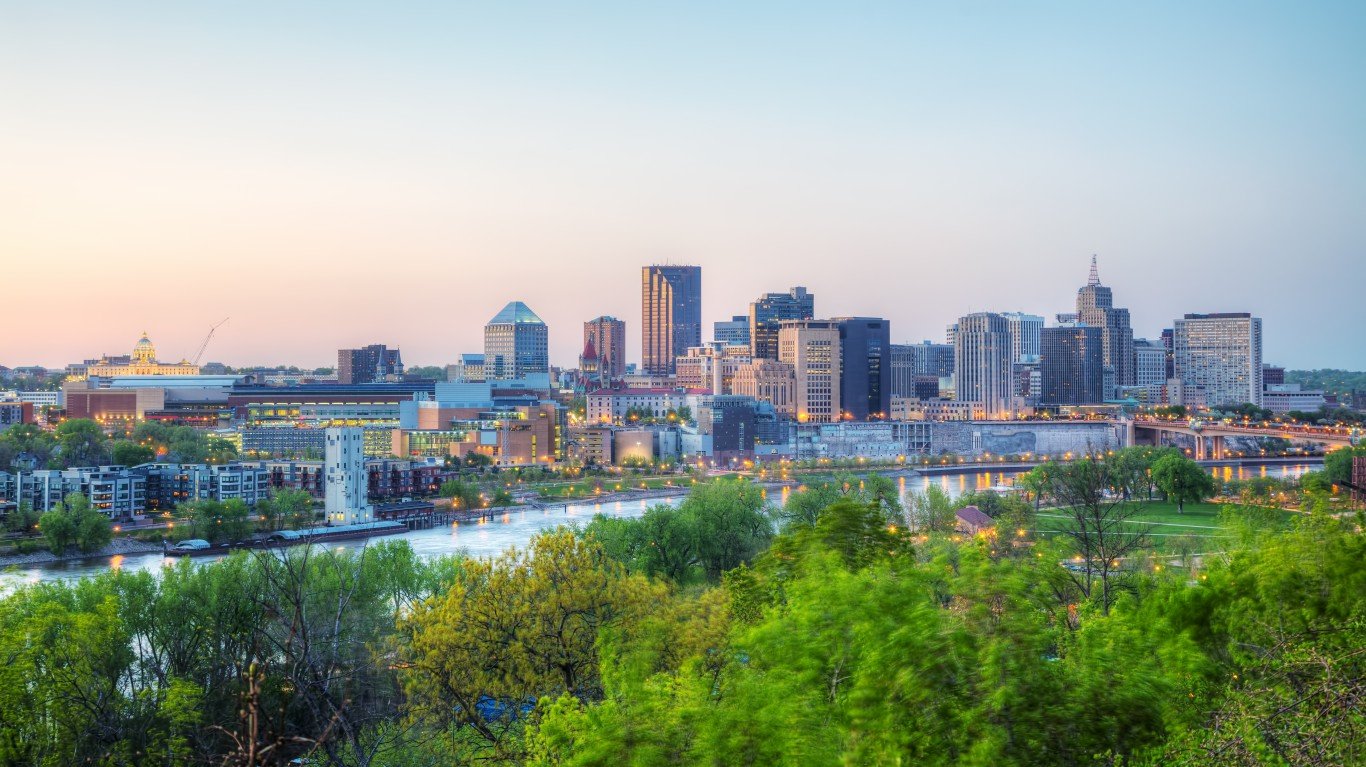
Minnesota
> Most unusual ancestry: Somali
> Concentration in Minnesota of residents with Somali ancestry: 21.6 times higher than share of U.S. population
> Share of Minnesota residents identifying as having Somali ancestry: 1.06% (Total: 58,844)
> Share of US pop. identifying as having Somali ancestry: 0.05% (total: 158,782)
> Share of all US residents identifying as having Somali ancestry living in Minnesota: 37.06%
The share of Minnesota residents identifying as having Somali ancestry is 1.06%, or 58,844 people, compared with 0.05% of the overall U.S. population identifying as having Somali ancestry. After a devastating famine swept Somalia between 2010 and 2012, many Somali refugees found new homes in Minnesota, adding to the population that had come throughout the 20th century as sailors, students, and war refugees.
Minnesota is an attractive part of the country for many people of Somali descent because of the availability of jobs and the presence of NGOs and nonprofits related to resettling refugees. One of the state’s most famous residents, Ilhan Omar, is the first Somali-American to serve in Congress as a representative.
Mississippi
> Most unusual ancestry: Cajun
> Concentration in Mississippi of residents with Cajun ancestry: 2.2 times higher than share of U.S. population
> Share of Mississippi residents identifying as having Cajun ancestry: 0.08% (Total: 2,279)
> Share of US pop. identifying as having Cajun ancestry: 0.04% (total: 113,065)
> Share of all US residents identifying as having Cajun ancestry living in Mississippi: 2.02%
Some 0.08% of Mississippi residents, or 2,279 people, identify as Cajun, more than twice the 0.04% national share. Cities with the largest shares of residents who claim Cajun descent in the state include Biloxi, Clarksdale, Pascagoula, and Gulfport.
Cajuns are largely the descendants of the Acadian people, French colonists from the Acadia colony in eastern Canada who were exiled from the region and forced to move to rural communities throughout the East Coast. Many migrated to port cities in the South and established small French-speaking communities. While roughly half of all Cajun Americans live in Louisiana today, there are significant populations in Southern states such as Florida, Arkansas, and Mississippi.
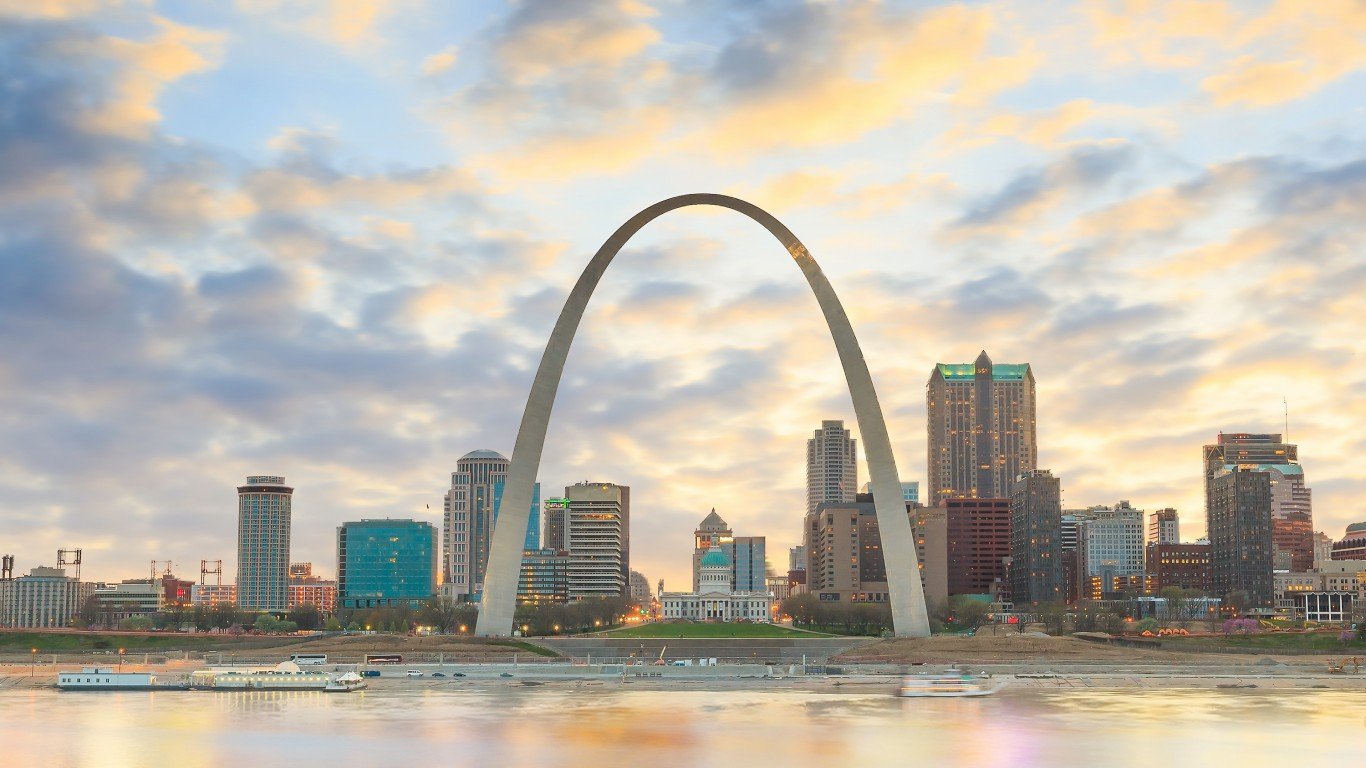
Missouri
> Most unusual ancestry: German
> Concentration in Missouri of residents with German ancestry: 1.7 times higher than share of U.S. population
> Share of Missouri residents identifying as having German ancestry: 23.23% (Total: 1,414,924)
> Share of US pop. identifying as having German ancestry: 13.68% (total: 44,164,758)
> Share of all US residents identifying as having German ancestry living in Missouri: 3.20%
Nearly one-fourth of Missouri residents, or 1,4 million people, identify as having German ancestry, about twice the overall share of the U.S. population claiming to have German ancestry. An area comprising 16 counties has been designated by the Missouri Humanities Council as the German Heritage Corridor..
The percentage of Germans in the Missouri population is not surprising. Germans have been coming to Missouri since the early 19th century because of the lure of cheap land, political turmoil in Germany, and industrialization.
Montana
> Most unusual ancestry: Norwegian
> Concentration in Montana of residents with Norwegian ancestry: 6.6 times higher than share of U.S. population
> Share of Montana residents identifying as having Norwegian ancestry: 9.05% (Total: 94,243)
> Share of US pop. identifying as having Norwegian ancestry: 1.36% (total: 4,403,008)
> Share of all US residents identifying as having Norwegian ancestry living in Montana: 2.14%
The first major wave of Norwegian immigration to the United States took place in the late 19th and early 20th centuries, largely for economic reasons as immigrants from the Nordic countries seeking homesteads and farmland settled throughout the Upper Midwest. Some 9.1% of Montana residents, or 94,243 people, identify as Norwegian, more than four times the 2.1% national figure.
Towns with the largest Norwegian populations in Montana include Scobey, Plentywood, and Glasgow.
Nebraska
> Most unusual ancestry: Czech
> Concentration in Nebraska of residents with Czech ancestry: 10.5 times higher than share of U.S. population
> Share of Nebraska residents identifying as having Czech ancestry: 4.51% (Total: 85,869)
> Share of US pop. identifying as having Czech ancestry: 0.43% (total: 1,382,835)
> Share of all US residents identifying as having Czech ancestry living in Nebraska: 6.21%
The share of Nebraska residents identifying as having Czech ancestry is 4.5%, or 85,869 people, compared with the overall percentage of the American population claiming Czech ancestry of 0.43%.
Czechs have been in Nebraska for at least since the mid-19th century. About 50,000 Czech immigrants fled what was the Austrian-Hungarian Empire to come to Nebraska between 1856 and the start of WWI, and by 1910 first and second generation Czechs made up about 14% of Nebraska’s foreign-born population. At the time, Nebraska had more first- and second-generation Czechs per capita than any other U.S. state.
Nevada
> Most unusual ancestry: Basque
> Concentration in Nevada of residents with Basque ancestry: 8.7 times higher than share of U.S. population
> Share of Nevada residents identifying as having Basque ancestry: 0.17% (Total: 4,852)
> Share of US pop. identifying as having Basque ancestry: 0.02% (total: 61,264)
> Share of all US residents identifying as having Basque ancestry living in Nevada: 7.92%
Nevada is another state where Basque Americans comprise the largest share of the population relative to their share nationwide. Basque Americans hail from Basque Country â a region that covers parts of northern Spain and southwestern France where the Basque language is primarily spoken. The first major wave of Basque immigrants to the United States came during the California gold rush in 1848. Many Basques found employment as sheepherders in northern Nevada, and today the state is home to one of the largest Basque American populations in the country.
Some 0.17% of Nevada ACS respondents identify as Basque, nearly 10 times the 0.02% national share.

New Hampshire
> Most unusual ancestry: French Canadian
> Concentration in New Hampshire of residents with French Canadian ancestry: 13.9 times higher than share of U.S. population
> Share of New Hampshire residents identifying as having French Canadian ancestry: 9.05% (Total: 121,596)
> Share of US pop. identifying as having French Canadian ancestry: 0.65% (total: 2,095,503)
> Share of all US residents identifying as having French Canadian ancestry living in New Hampshire: 5.80%
French Canadians are an ethnic group that descends from the French colonists who settled in eastern Canada around the 17th century. Large-scale immigration to the United States began in the 19th century, as groups of French Canadians found employment in textile mills and logging operations throughout New England. Today, some 9.05% of New Hampshire residents, or 121,596 people, identify as French Canadian, more than 13 times the 0.65% national share.
Some 2.4% of New Hampshire residents today speak French, the fifth largest share of any state.
New Jersey
> Most unusual ancestry: Egyptian
> Concentration in New Jersey of residents with Egyptian ancestry: 5.6 times higher than share of U.S. population
> Share of New Jersey residents identifying as having Egyptian ancestry: 0.44% (Total: 39,393)
> Share of US pop. identifying as having Egyptian ancestry: 0.08% (total: 254,257)
> Share of all US residents identifying as having Egyptian ancestry living in New Jersey: 15.49%
A majority of Egyptian Americans emigrated to the United States in the last 60 years as laws such as the Immigration and Nationality Act of 1965 and the Immigration Act of 1990 eased immigration quotas and requirements for underrepresented populations. Still, the Egyptian diaspora in America is one of the smallest national origin groups.
Approximately 254,257 Americans identify as Egyptian, just 0.08% of the U.S. population. Of that group, 15.49% live in New Jersey, more than in any state other than California. Egyptians comprise 0.44% of New Jersey’s population, or 39,393 people, almost six times the national share.

New Mexico
> Most unusual ancestry: Celtic
> Concentration in New Mexico of residents with Celtic ancestry: 3.0 times higher than share of U.S. population
> Share of New Mexico residents identifying as having Celtic ancestry: 0.05% (Total: 1,008)
> Share of US pop. identifying as having Celtic ancestry: 0.02% (total: 52,344)
> Share of all US residents identifying as having Celtic ancestry living in New Mexico: 1.93%
The share of those in New Mexico who claim Celtic ancestry is 0.05%, or 1,008 people, which is more than twice the share of the U.S. population identifying as having Celtic ancestry.
Although we associate the Celts with parts of Ireland, Scotland and Wales, Celtic tribes migrated to Spain and lived on the Iberian Peninsula during the Roman Empire. Some of the Spanish explorers who came to what is now New Mexico might have had Celtic ancestors.
New York
> Most unusual ancestry: Guyanese
> Concentration in New York of residents with Guyanese ancestry: 9.7 times higher than share of U.S. population
> Share of New York residents identifying as having Guyanese ancestry: 0.75% (Total: 147,522)
> Share of US pop. identifying as having Guyanese ancestry: 0.08% (total: 249,460)
> Share of all US residents identifying as having Guyanese ancestry living in New York: 59.14%
Nearly 60% of all American residents who claim to have Guyanese ancestry, or 147,522 people, live in New York. The share of those in New York identifying as having Guyanese ancestry is well above the national share.
The Richmond Hill section of Queens is also known as Little Guyana and is home to a large portion of Americans who identify as Guyanese. Guyanese began to come to New York City in the 1960s to escape repression in the Caribbean nation as well as to take advantage of a change in U.S. immigration laws that lifted immigration levels from those immigrating from the Southern Hemisphere.
North Carolina
> Most unusual ancestry: Scotch-Irish
> Concentration in North Carolina of residents with Scotch-Irish ancestry: 2.6 times higher than share of U.S. population
> Share of North Carolina residents identifying as having Scotch-Irish ancestry: 2.47% (Total: 251,319)
> Share of US pop. identifying as having Scotch-Irish ancestry: 0.94% (total: 3,021,077)
> Share of all US residents identifying as having Scotch-Irish ancestry living in North Carolina: 8.32%
The share of North Carolina residents identifying as having Scotch-Irish ancestry is 2.47%, or 251,319 people, almost three times the national share of 0.94%.
Scotch-Irish Americans are descendants of mostly Protestant immigrants who came to America primarily from the Ulster province of Ireland in the 18th century seeking religious freedom and economic opportunities. About 3 million Americans identify as Scotch-Irish, or 1% of the population. Other states with relatively large Scotch-Irish populations are Tennessee, West Virginia, and South Carolina. About one-third of U.S. presidents claim Scotch-Irish heritage.
North Dakota
> Most unusual ancestry: German Russian
> Concentration in North Dakota of residents with German Russian ancestry: 40.9 times higher than share of U.S. population
> Share of North Dakota residents identifying as having German Russian ancestry: 0.31% (Total: 2,344)
> Share of US pop. identifying as having German Russian ancestry: 0.01% (total: 24,617)
> Share of all US residents identifying as having German Russian ancestry living in North Dakota: 9.52%
In the 18th century, Catherine the Great of Russia encouraged Germans to settle in Russian territories on the Volga River and on the Black Sea, luring them with free land and religious freedom. A century later, these German Russians started moving to the United States, and about 70,000 of them made North Dakota their new home.
Today, nearly 25,000 Americans identify as German Russian, and about 9.52% of them live in North Dakota. German is even still spoken in some villages in the state. Other states that have a relatively high concentration of German Russian Americans include Kansas and Colorado.
Ohio
> Most unusual ancestry: Slovene
> Concentration in Ohio of residents with Slovene ancestry: 8.1 times higher than share of U.S. population
> Share of Ohio residents identifying as having Slovene ancestry: 0.44% (Total: 51,568)
> Share of US pop. identifying as having Slovene ancestry: 0.05% (total: 176,442)
> Share of all US residents identifying as having Slovene ancestry living in Ohio: 29.23%
Following the Civil War, there was a shift in the broader immigration patterns to the United States. If immigrants until then mostly came from England, Germany, and Ireland, after the war they came from Eastern European countries, including Slovenia. In 1900, fewer than 10,000 American Slovenes lived in Ohio. By 1910, over 14,000 American Slovenes lived in Cleveland alone. Slovenes were attracted to Cleveland by factory jobs and due to previous Slovene migration, which meant they could live around people with shared culture and beliefs.
Currently, close to one-third of the nearly 177,000 Americans with Slovene ancestry live in Ohio.

Oklahoma
> Most unusual ancestry: Dutch West Indian
> Concentration in Oklahoma of residents with Dutch West Indian ancestry: 30.3 times higher than share of U.S. population
> Share of Oklahoma residents identifying as having Dutch West Indian ancestry: 0.39% (Total: 15,192)
> Share of US pop. identifying as having Dutch West Indian ancestry: 0.01% (total: 41,368)
> Share of all US residents identifying as having Dutch West Indian ancestry living in Oklahoma: 36.72%
Dutch West Indian Americans are descendants of the Netherlands Antilles, a former country that consisted of a series of islands in the Caribbean under Dutch rule for approximately four centuries. The islands were conquered by settlers of the Dutch West India Company in the 17th century and were under Dutch rule until October 2010, when the five islands that comprised the Netherlands Antilles — Curacao, Sint Maarten, Bonaire, Saba, and Sint Eustatius — became fully autonomous territories.
Dutch West Indians comprise 0.39% of the Oklahoma population, about 30 times the 0.01% of Americans who claim Dutch West Indian ancestry.
Oregon
> Most unusual ancestry: Basque
> Concentration in Oregon of residents with Basque ancestry: 4.4 times higher than share of U.S. population
> Share of Oregon residents identifying as having Basque ancestry: 0.08% (Total: 3,380)
> Share of US pop. identifying as having Basque ancestry: 0.02% (total: 61,264)
> Share of all US residents identifying as having Basque ancestry living in Oregon: 5.52%
Basque Americans trace their roots to a region that covers parts of northern Spain and southwestern France where the Basque language is primarily spoken. Basque people first arrived in Oregon en masse in the late 1880s, many leaving California after the gold rush. Upon settling in Oregon, the Basque people spread across the state, and many became sheepherders. In addition to California, much of Oregon’s Basque population moved to the state from Nevada, which still has a relatively heavy concentration of Basque Americans.
Today, 5.5% of the 61,264 Americans who identify as Basque live in Oregon.
Pennsylvania
> Most unusual ancestry: Pennsylvania German
> Concentration in Pennsylvania of residents with Pennsylvania German ancestry: 12.4 times higher than share of U.S. population
> Share of Pennsylvania residents identifying as having Pennsylvania German ancestry: 1.17% (Total: 149,860)
> Share of US pop. identifying as having Pennsylvania German ancestry: 0.09% (total: 305,551)
> Share of all US residents identifying as having Pennsylvania German ancestry living in Pennsylvania: 49.05%
Pennsylvania Germans are the descendants of a group of southern German immigrants who settled in Pennsylvania in the 17th and 18th centuries. The immigrants established a unique dialect of German known as Pennsylvania Dutch that was spoken by more than a third of the state’s population by the time of the American Revolution.
Today, some 305,551 Americans identify as Pennsylvania German, about half of whom live in Pennsylvania. The ethnic group comprises 1.17% of the Pennsylvania population, more than 12 its 0.1% share in the U.S. population.

Rhode Island
> Most unusual ancestry: Cape Verdean
> Concentration in Rhode Island of residents with Cape Verdean ancestry: 57.2 times higher than share of U.S. population
> Share of Rhode Island residents identifying as having Cape Verdean ancestry: 2.00% (Total: 21,111)
> Share of US pop. identifying as having Cape Verdean ancestry: 0.03% (total: 112,715)
> Share of all US residents identifying as having Cape Verdean ancestry living in Rhode Island: 18.73%
Cape Verde is an island nation off the western coast of Africa. About 1 in every 5 Americans who identify Cabo Verdean as their primary ethnicity live in Rhode Island. Americans identifying as Cabo Verdeans often also have Portuguese ancestry as Portugal colonized the African island nation in the 1400s.
The Cabo Verdean people first arrived in New England after being employed on whaling ships — which often stopped at Cape Verde — from the northeastern United States. Another state with a relatively high concentration of Americans with Cabo Verdean ancestry is Massachusetts.

South Carolina
> Most unusual ancestry: Scotch-Irish
> Concentration in South Carolina of residents with Scotch-Irish ancestry: 2.5 times higher than share of U.S. population
> Share of South Carolina residents identifying as having Scotch-Irish ancestry: 2.34% (Total: 115,721)
> Share of US pop. identifying as having Scotch-Irish ancestry: 0.94% (total: 3,021,077)
> Share of all US residents identifying as having Scotch-Irish ancestry living in South Carolina: 3.83%
Scotch-Irish Americans are descendants of immigrants who came to America primarily from the Ulster province of Ireland in the 18th century seeking religious freedom and economic opportunities. They are one of the largest ethnic groups in the United States today.
Approximately 3 million Americans identify as Scotch-Irish, or 1% of the population. States with the largest shares of Scotch-Irish American residents include southeastern states such as Tennessee, West Virginia, and North and South Carolina. The Scotch-Irish comprise 2.34% of the South Carolina population, 2.5 times the national share.
South Dakota
> Most unusual ancestry: Norwegian
> Concentration in South Dakota of residents with Norwegian ancestry: 10.0 times higher than share of U.S. population
> Share of South Dakota residents identifying as having Norwegian ancestry: 13.60% (Total: 117,510)
> Share of US pop. identifying as having Norwegian ancestry: 1.36% (total: 4,403,008)
> Share of all US residents identifying as having Norwegian ancestry living in South Dakota: 2.67%
Some 13.6% of South Dakota’s population identifies as Norwegian compared to only 1.4% of the U.S. population. South Dakota is not the only state in the Upper Midwest with a high concentration of Norwegians. North Dakota, Minnesota, and Wisconsin have relatively large Norwegian populations as well.
Norwegians first settled in South Dakota in the mid-1800s. Their numbers increased rapidly in the region throughout the remainder of the 19th century. Today, about 117,500 people living in South Dakota identify primarily as Norwegian.

Tennessee
> Most unusual ancestry: Scotch-Irish
> Concentration in Tennessee of residents with Scotch-Irish ancestry: 2.3 times higher than share of U.S. population
> Share of Tennessee residents identifying as having Scotch-Irish ancestry: 2.14% (Total: 142,538)
> Share of US pop. identifying as having Scotch-Irish ancestry: 0.94% (total: 3,021,077)
> Share of all US residents identifying as having Scotch-Irish ancestry living in Tennessee: 4.72%
When they first came to North America, the Scots-Irish settled in Pennsylvania, North and South Carolina, and Virginia. They later moved inland where land was inexpensive. When Tennessee became a state in 1796, these settlers set up schools and churches in the state. Among other traditions, the Scotch-Irish brought the tradition of distilling whiskey.
Today, nearly 1 in 20 Americans identifying as Scotch-Irish live in Tennessee. The state is home to more than 142,000 Scotch-Irish Americans, who make up 2.14% of the Tennessee population.

Texas
> Most unusual ancestry: Dutch West Indian
> Concentration in Texas of residents with Dutch West Indian ancestry: 2.7 times higher than share of U.S. population
> Share of Texas residents identifying as having Dutch West Indian ancestry: 0.03% (Total: 9,538)
> Share of US pop. identifying as having Dutch West Indian ancestry: 0.01% (total: 41,368)
> Share of all US residents identifying as having Dutch West Indian ancestry living in Texas: 23.06%
Dutch West Indian Americans are descendants of the Netherlands Antilles, a former country that consisted of a series of islands in the Caribbean under Dutch rule for approximately four centuries. The islands were conquered by settlers of the Dutch West India Company in the 17th century and remained under Dutch rule until October 2010, when the five islands that comprised the Netherlands Antilles — Curacao, Sint Maarten, Bonaire, Saba, and Sint Eustatius — became fully autonomous territories.
Immigrants from the Dutch West Indies came to the United States throughout the 20th century. Dutch West Indian Americans comprise 0.03% of the Texas population, nearly three times the comparable national share — the highest location quotient of any ancestry in the state.
Utah
> Most unusual ancestry: Danish
> Concentration in Utah of residents with Danish ancestry: 12.0 times higher than share of U.S. population
> Share of Utah residents identifying as having Danish ancestry: 4.76% (Total: 145,082)
> Share of US pop. identifying as having Danish ancestry: 0.40% (total: 1,278,457)
> Share of all US residents identifying as having Danish ancestry living in Utah: 11.35%
The first major wave of immigration from Denmark to the United States was in the mid to late 19th century, when converts to the Church of Jesus Christ of Latter Day Saints moved throughout the Midwest and to Utah. Mormon missionaries had arrived in Denmark in 1850, just months after the 1849 Constitutional Act of Denmark granted the Danish people freedom of religion. Immigration continued into the 1900s, as economic opportunities in Denmark became limited and the United States offered settlers cheap farmland through generous land policies such as the Homestead Act.
Today, 145,082 Utah residents identify as Danish, more than in any state other than California. Danish Americans comprise 4.76% of the Utah population, nearly 12 times the comparable 0.4% U.S. share.
Vermont
> Most unusual ancestry: French Canadian
> Concentration in Vermont of residents with French Canadian ancestry: 12.6 times higher than share of U.S. population
> Share of Vermont residents identifying as having French Canadian ancestry: 8.18% (Total: 51,119)
> Share of US pop. identifying as having French Canadian ancestry: 0.65% (total: 2,095,503)
> Share of all US residents identifying as having French Canadian ancestry living in Vermont: 2.44%
French Canadians began to immigrate to New England in large numbers from Quebec, New Brunswick, and Ontario in Canada for textile and logging jobs in the 19th century. Today, the largest shares of U.S. residents claiming the ancestry live in New Hampshire, Maine, and Vermont. Some 8.18% of Vermont residents claim French Canadian ancestry, nearly 13 times the 0.65% national share — the highest location quotient of any ancestry in the state.
Due to their proximity to Quebec, French Canadian Americans may have been able to preserve francophone culture in the United States more than descendants of other ancestries. Some 1.4% of Vermont residents today speak French, the most of any language other than English and the fourth largest share of French speakers of any state.

Virginia
> Most unusual ancestry: Sierra Leonean
> Concentration in Virginia of residents with Sierra Leonean ancestry: 6.6 times higher than share of U.S. population
> Share of Virginia residents identifying as having Sierra Leonean ancestry: 0.04% (Total: 3,637)
> Share of US pop. identifying as having Sierra Leonean ancestry: 0.01% (total: 21,003)
> Share of all US residents identifying as having Sierra Leonean ancestry living in Virginia: 17.32%
Between 1550 and 1850, over 10 million people from the African continent were brought to North America and Brazil as slaves. Many of those slaves were from Sierra Leone. While some Sierra Leonean slaves returned to Africa in the 1700s after gaining freedom, a majority stayed in the United States.
More recently, beginning in the 1970s, large waves of Sierra Leonean immigrants have come to America seeking educational and economic opportunities, as well as to escape political turmoil in their own country. Today, 21,003 Americans identify as having Sierra Leonean ancestry, a majority of whom live in states along the East Coast. About 1 in 5 of all Americans identifying as Sierra Leonean live in Virginia.
Washington
> Most unusual ancestry: Icelander
> Concentration in Washington of residents with Icelander ancestry: 5.7 times higher than share of U.S. population
> Share of Washington residents identifying as having Icelander ancestry: 0.09% (Total: 6,437)
> Share of US pop. identifying as having Icelander ancestry: 0.02% (total: 49,559)
> Share of all US residents identifying as having Icelander ancestry living in Washington: 12.99%
Large groups of settlers from Iceland first immigrated to the United States in the late 1800s. Estimates of the number of people who left Iceland for the United States during that period ranges from 10,000 to 15,000 — close to one-fifth of the population of Iceland at the time. They initially settled in Midwestern states like Minnesota and Wisconsin, while others were drawn to Utah by the Mormon faith.
Eventually, Icelandic Americans moved west to states like California, Oregon, and Washington. Immigration decreased considerably in the early 1900s and did not pick up again until after WWII, when brides of American troops stationed in Iceland relocated to the United States.
Today, some 6,437 people in Washington, or 0.09% of the population, identify as having Icelander ancestry — about six times the comparable national share.
West Virginia
> Most unusual ancestry: Scotch-Irish
> Concentration in West Virginia of residents with Scotch-Irish ancestry: 2.0 times higher than share of U.S. population
> Share of West Virginia residents identifying as having Scotch-Irish ancestry: 1.86% (Total: 33,940)
> Share of US pop. identifying as having Scotch-Irish ancestry: 0.94% (total: 3,021,077)
> Share of all US residents identifying as having Scotch-Irish ancestry living in West Virginia: 1.12%
The Scotch-Irish Americans are descendants of immigrants who came to America primarily from the Ulster province of Ireland in the 18th century. They are one of the largest ethnic groups in the United States today. Approximately 3 million ACS respondents nationwide claim Scotch-Irish ancestry, or about 1% of the U.S. population. In West Virginia 1.86% of respondents claim the ancestry.
The first major wave of Scotch-Irish settlers immigrated to the United States seeking religious freedom and economic opportunities. Having originally settled in Philadelphia, the Scotch-Irish eventually found a greater degree of religious freedom in the Southern states — where their descendants largely remain today.

Wisconsin
> Most unusual ancestry: Luxembourger
> Concentration in Wisconsin of residents with Luxembourger ancestry: 9.0 times higher than share of U.S. population
> Share of Wisconsin residents identifying as having Luxembourger ancestry: 0.11% (Total: 6,569)
> Share of US pop. identifying as having Luxembourger ancestry: 0.01% (total: 40,979)
> Share of all US residents identifying as having Luxembourger ancestry living in Wisconsin: 16.03%
The world’s only cultural center celebrating the heritage of Luxembourg opened in 2009 in Belgium, Wisconsin. The location is appropriate as about 6,600 people claiming Luxembourger heritage live in Wisconsin — more than in any other state. Some 16.0% of the 40,979 Luxembourg Americans call Wisconsin home.
The first major wave of immigrants from Luxembourg came to the United States in the 1830s and 1840s, after many faced difficulty attempting to settle in South America. Pulled by economic opportunity — inexpensive farmland in particular — many Luxembourgers were drawn to the Midwest.
Wyoming
> Most unusual ancestry: Basque
> Concentration in Wyoming of residents with Basque ancestry: 10.0 times higher than share of U.S. population
> Share of Wyoming residents identifying as having Basque ancestry: 0.19% (Total: 1,108)
> Share of US pop. identifying as having Basque ancestry: 0.02% (total: 61,264)
> Share of all US residents identifying as having Basque ancestry living in Wyoming: 1.81%
Approximately 61,000 Americans today identify as Basque, and about 1,100 of them live in Wyoming. Many Basques moved away from their homeland in the 19th and 20th centuries, eventually settling in places in South America, the Philippines, Australia, and the United States. In the U.S., Basques had a reputation of being hard workers in sheepherding communities.
Americans who identify as having Basque ancestry comprise 0.02% of the state population, about 10 times the national figure and the most of any ancestry in the state relative to the comparable national share.
Methodology
To find the most unique ancestry in each state, 24/7 Wall St. reviewed the ancestry question in the American Community Survey (ACS) 5-year averages for the year 2014 – 2018. The question is based on self-identification and answers represent ancestry groups with which people most closely identify. The 106 single-origin ancestries (excluding combinations of two or more races) represented in the data are based on a combination of the most common responses to the survey as well as classifications by the Census Bureau.
The most unusual ancestry in each state was determined by calculating the location quotient for each ancestry and taking the largest ratio relative to the U.S average. For example, if 20% of a state population is Scotch-Irish, and the Scotch-Irish comprise 10% of the U.S. population, then the location quotient would be 2.0. If that location quotient is the highest of any ancestry in the state, then that is the most unusual ancestry in the state. The racial composition, language spoken at home, total population and educational attainment were also from the ACS 2018 5-Year Estimates.