About 50 million U.S. residents – about 15% of the total population – are foreign-born, making America the country with the most immigrants in the world. Even those who are second-generation or beyond often claim an ancestry other than just “American.”
In its annual American Community Survey, the U.S. Census Bureau asks Americans to identify their ancestry. Ancestry refers to a person’s lineage or ethnic origin. Ethnic composition varies heavily across the United States and is often a reflection of centuries-old migration patterns. Among those Americans whose ancestors did come from someplace else – whether hundreds of years ago or last month – many different nationalities and ethnicities are represented. (These are the countries most immigrants in the U.S. are originally from.)
To determine the most “unusual” ancestry in each state, 24/7 Tempo reviewed data from the ACS. Over 200 ancestries were ranked within each state based on location quotient, taking the largest ratio relative to the U.S. average.
Early waves of immigrants – from the 17th century to the mid-19th century – traveled to the country seeking religious freedom and economic opportunity mostly from European countries. The U.S. shut out Chinese immigrants with the 1882 Chinese Exclusion Act.
A decade later, America opened up again to immigrants by welcoming them on Ellis Island in New York, processing the tide of immigrants from Europe who filled the ranks of factory workers as the country’s economic expansion accelerated.
In 1965, the U.S. changed its immigration laws to end a quota-based system that favored immigrants from Europe, leading to greater numbers from Asian and Latin American countries. (Here’s a look at how many refugees the U.S. has accepted each year since 1980.)
Each wave of immigrants enriches American culture and creates unique neighborhoods and communities.
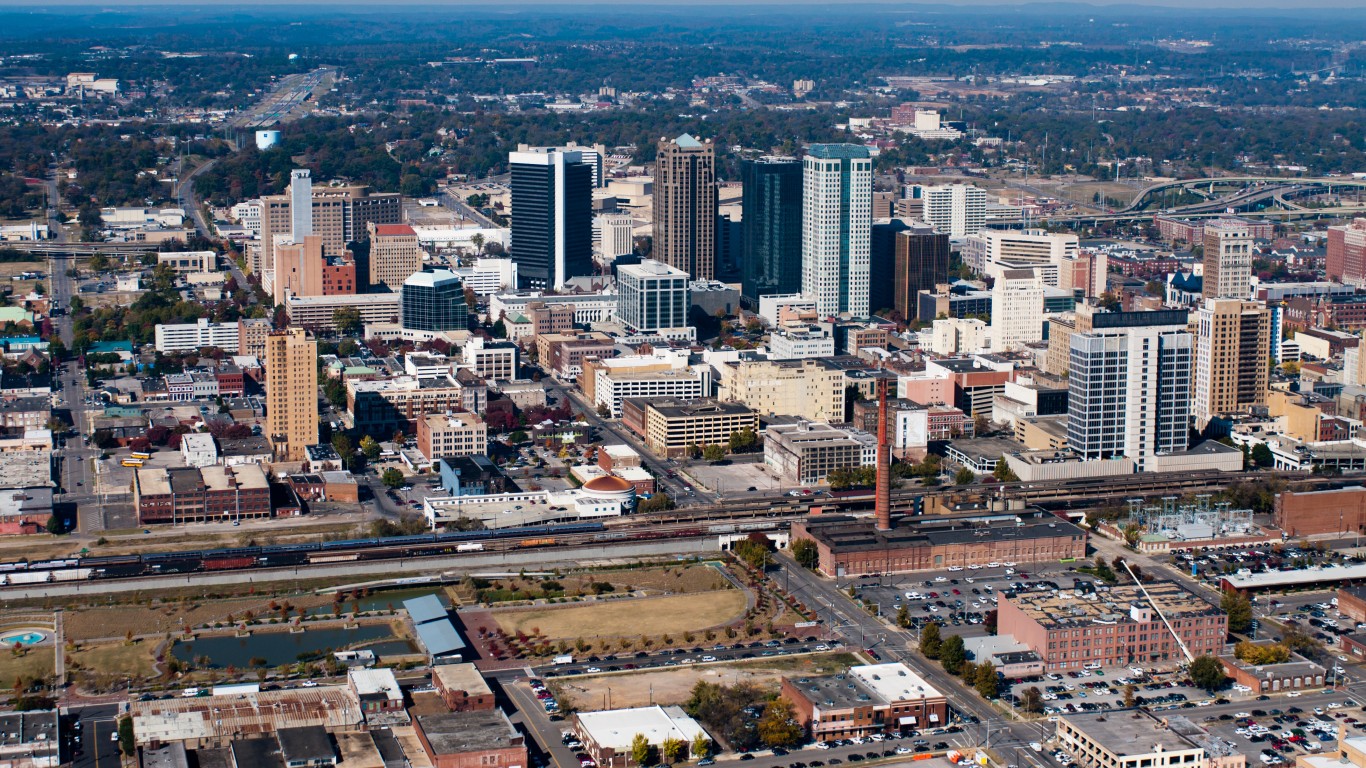
Alabama
> Most unusual ancestry: American
> Concentration of AL residents with American ancestry: 3.0 times higher than share of U.S. population
> Share of AL residents identifying as having American ancestry: 14.32% (Total: 715,875)
> Share of U.S. pop. identifying as having American ancestry: 4.85% (total: 15,989,650)
> Share of all U.S. residents identifying as having American ancestry living in AL: 4.48%
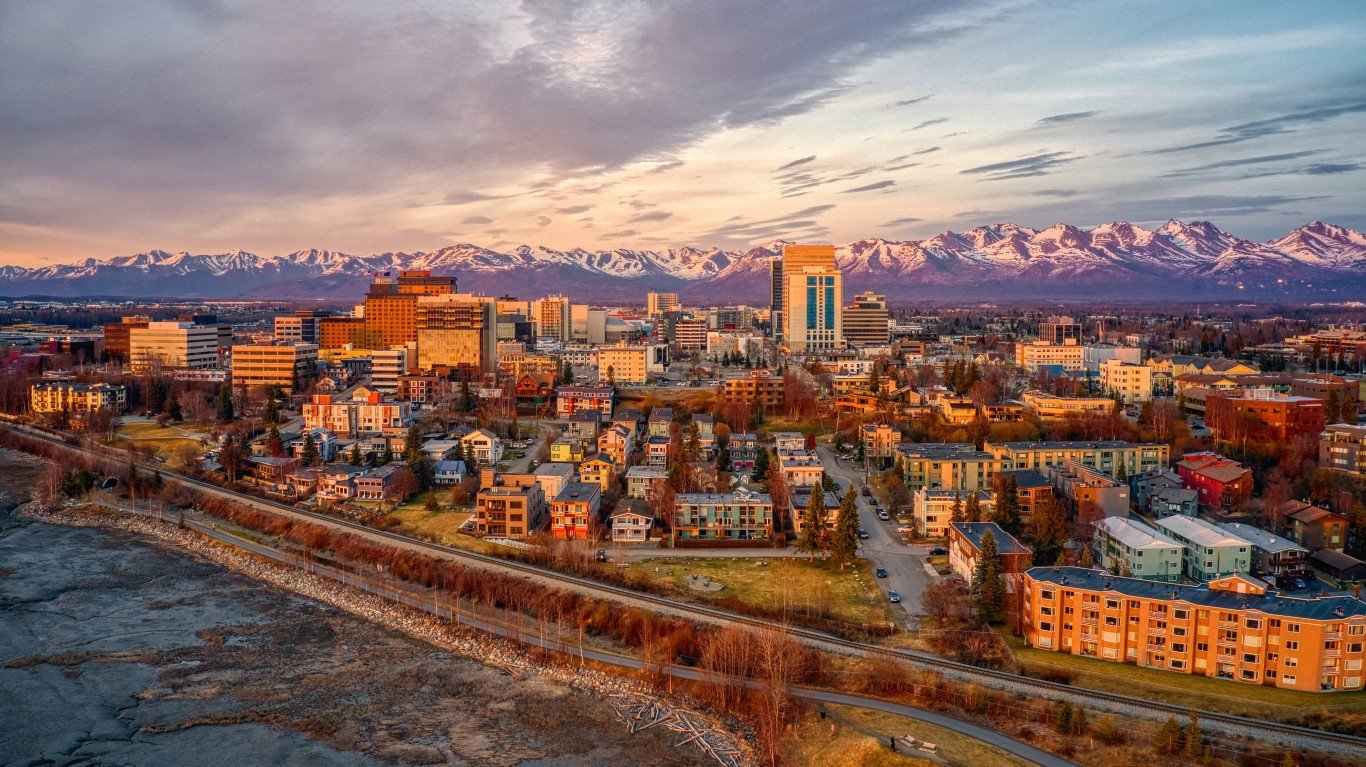
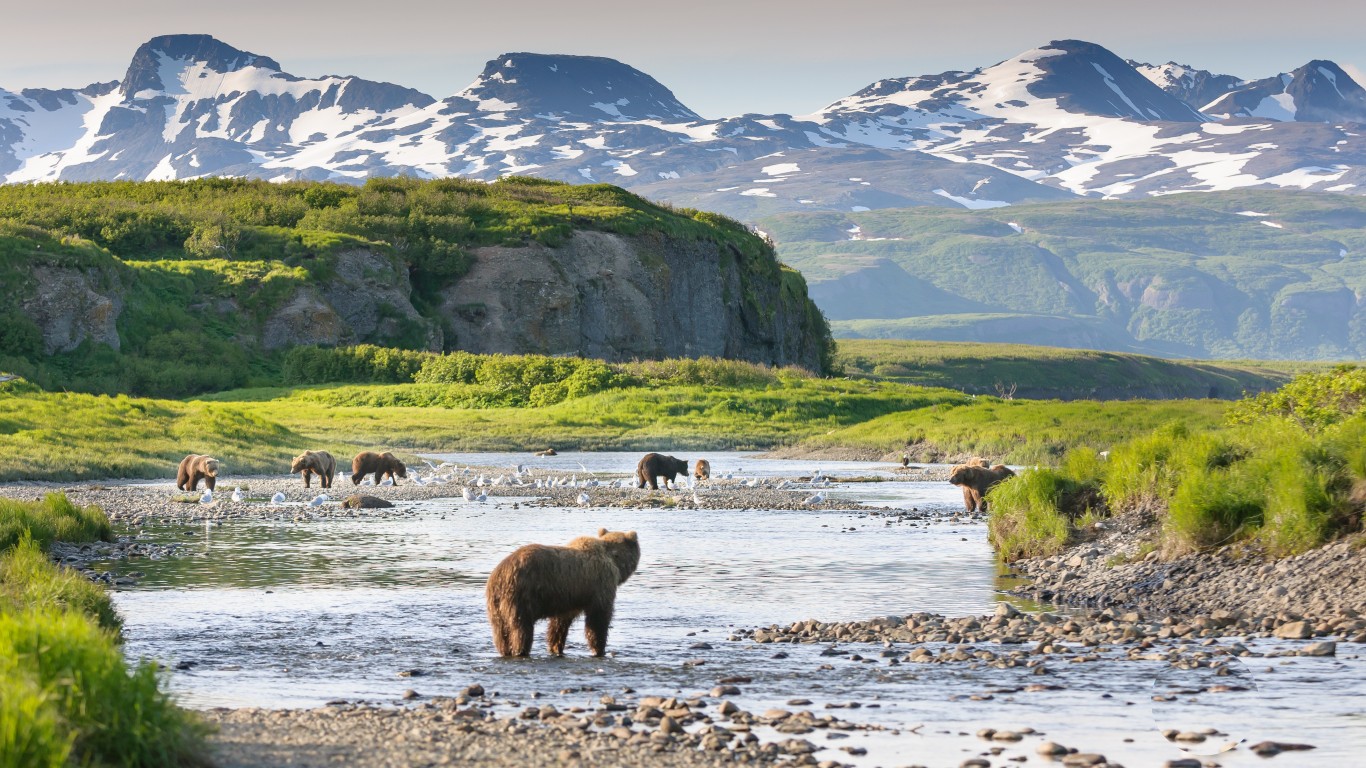
Alaska
> Most unusual ancestry: Eskimo
> Concentration of AK residents with Eskimo ancestry: 392.9 times higher than share of U.S. population
> Share of AK residents identifying as having Eskimo ancestry: 6.14% (Total: 45,164)
> Share of U.S. pop. identifying as having Eskimo ancestry: 0.02% (total: 51,495)
> Share of all U.S. residents identifying as having Eskimo ancestry living in AK: 87.71%
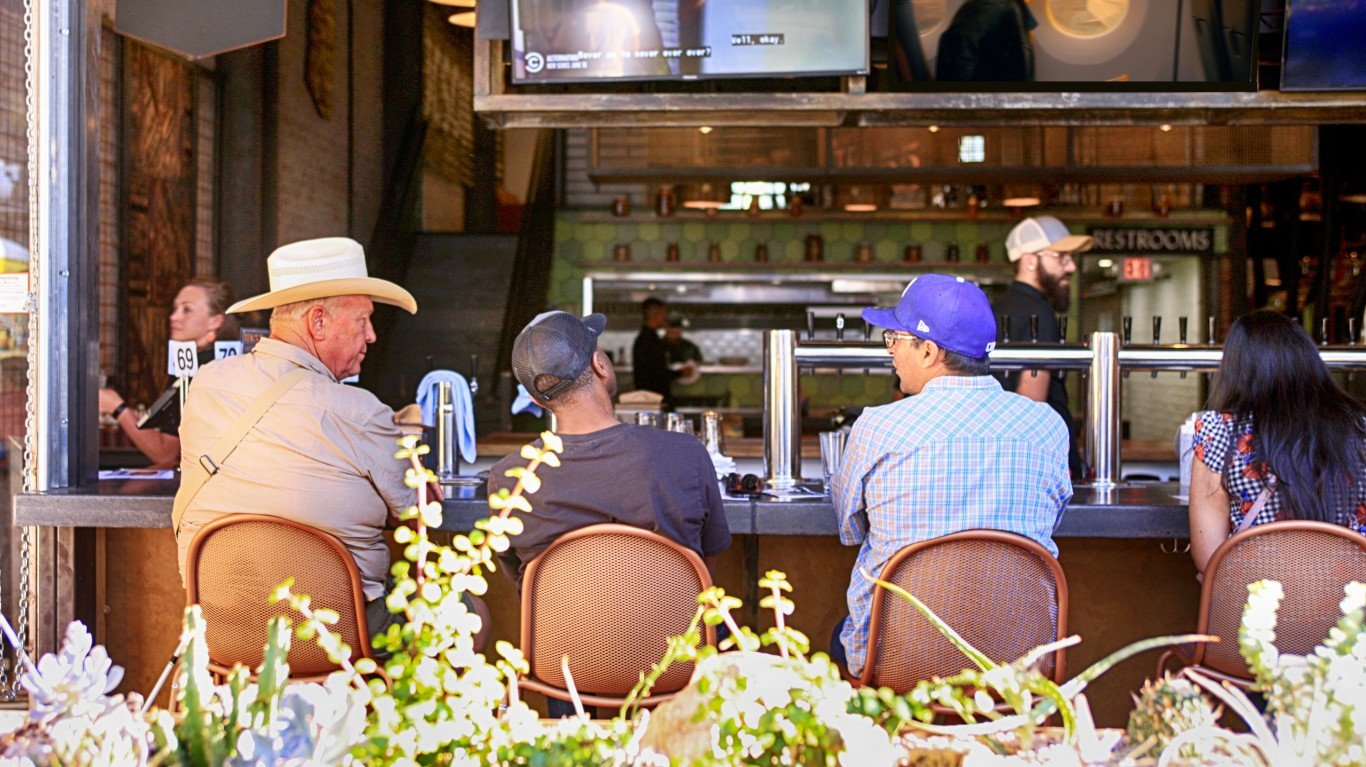
Arizona
> Most unusual ancestry: American Indian
> Concentration of AZ residents with American Indian ancestry: 4.8 times higher than share of U.S. population
> Share of AZ residents identifying as having American Indian ancestry: 2.76% (Total: 195,148)
> Share of U.S. pop. identifying as having American Indian ancestry: 0.57% (total: 1,891,253)
> Share of all U.S. residents identifying as having American Indian ancestry living in AZ: 10.32%
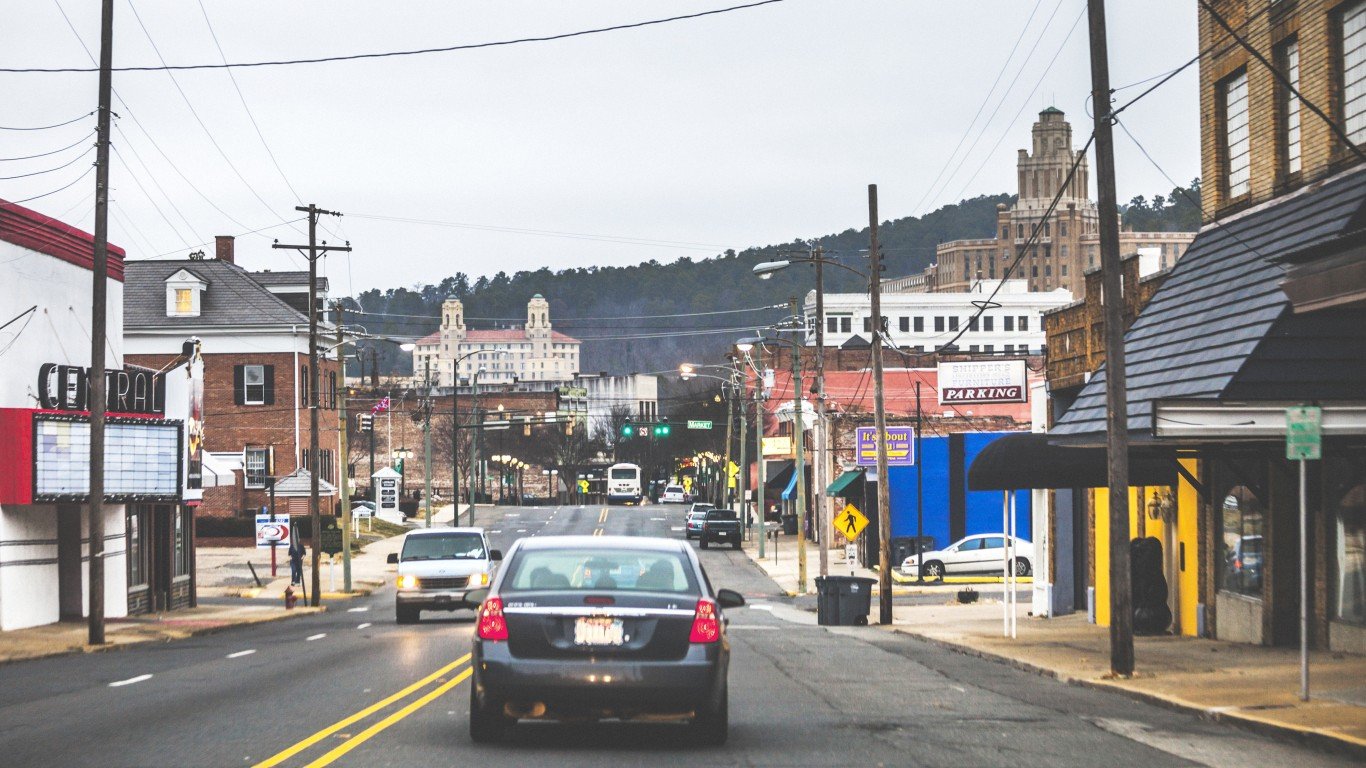
Arkansas
> Most unusual ancestry: Marshallese
> Concentration of AR residents with Marshallese ancestry: 30.8 times higher than share of U.S. population
> Share of AR residents identifying as having Marshallese ancestry: 0.29% (Total: 8,621)
> Share of U.S. pop. identifying as having Marshallese ancestry: 0.01% (total: 30,654)
> Share of all U.S. residents identifying as having Marshallese ancestry living in AR: 28.12%
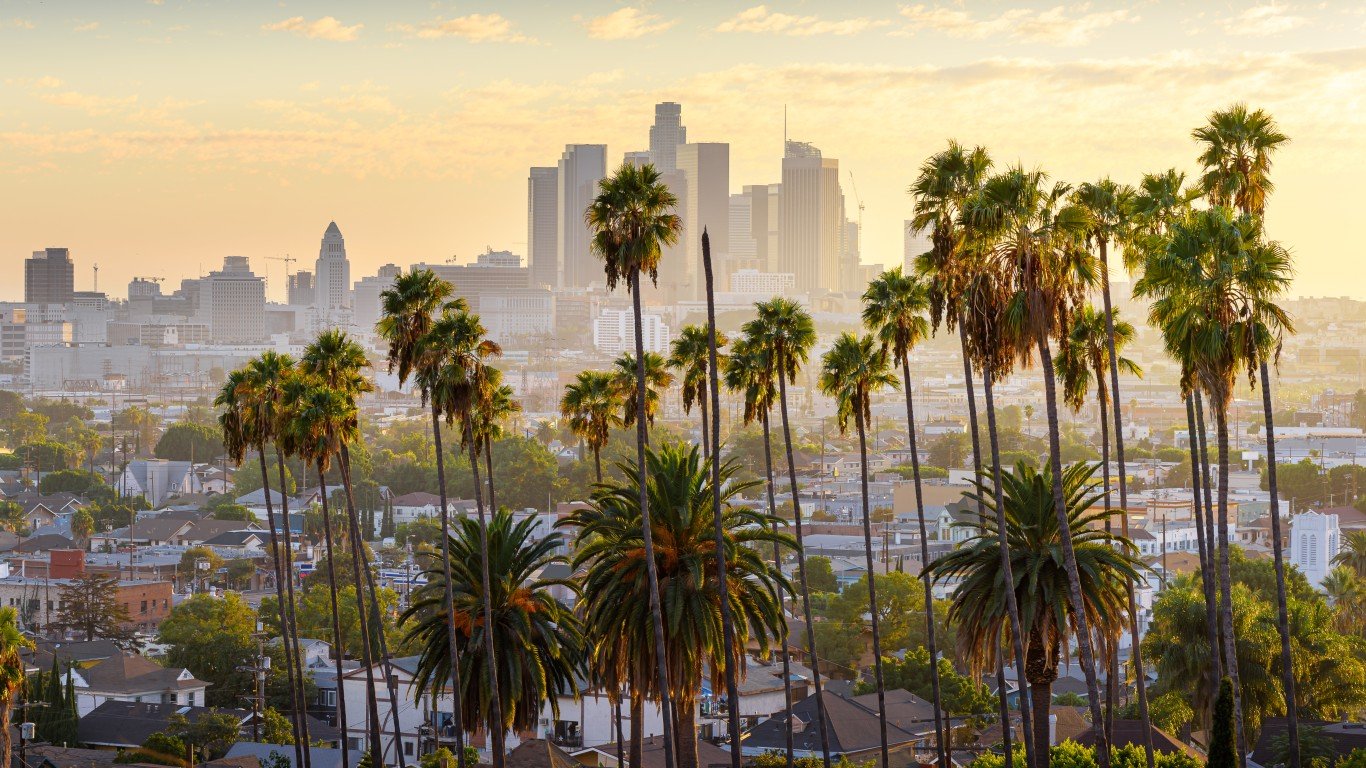
California
> Most unusual ancestry: Fijian
> Concentration of CA residents with Fijian ancestry: 6.5 times higher than share of U.S. population
> Share of CA residents identifying as having Fijian ancestry: 0.06% (Total: 24,724)
> Share of U.S. pop. identifying as having Fijian ancestry: 0.01% (total: 31,904)
> Share of all U.S. residents identifying as having Fijian ancestry living in CA: 77.49%
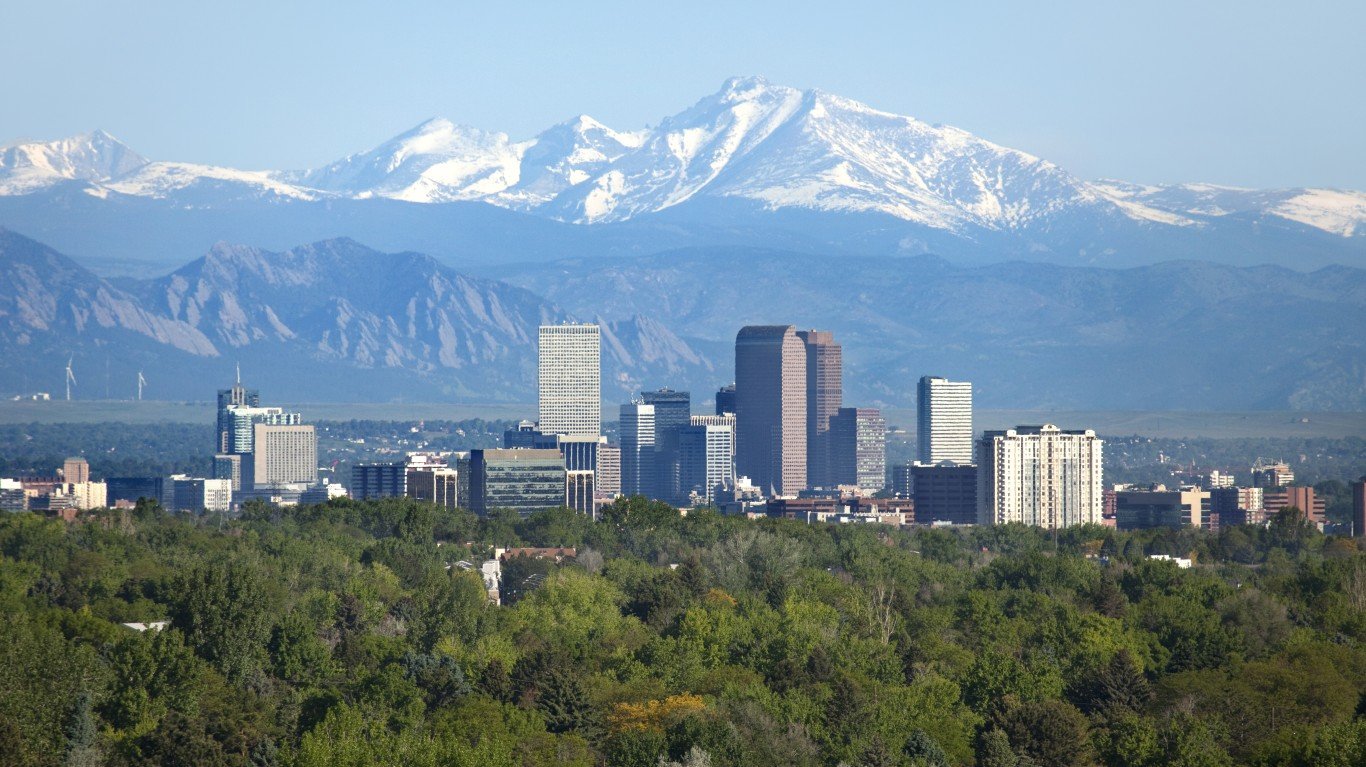
Colorado
> Most unusual ancestry: Spanish-American
> Concentration of CO residents with Spanish-American ancestry: 6.1 times higher than share of U.S. population
> Share of CO residents identifying as having Spanish-American ancestry: 0.10% (Total: 5,835)
> Share of U.S. pop. identifying as having Spanish-American ancestry: 0.02% (total: 55,516)
> Share of all U.S. residents identifying as having Spanish-American ancestry living in CO: 10.51%
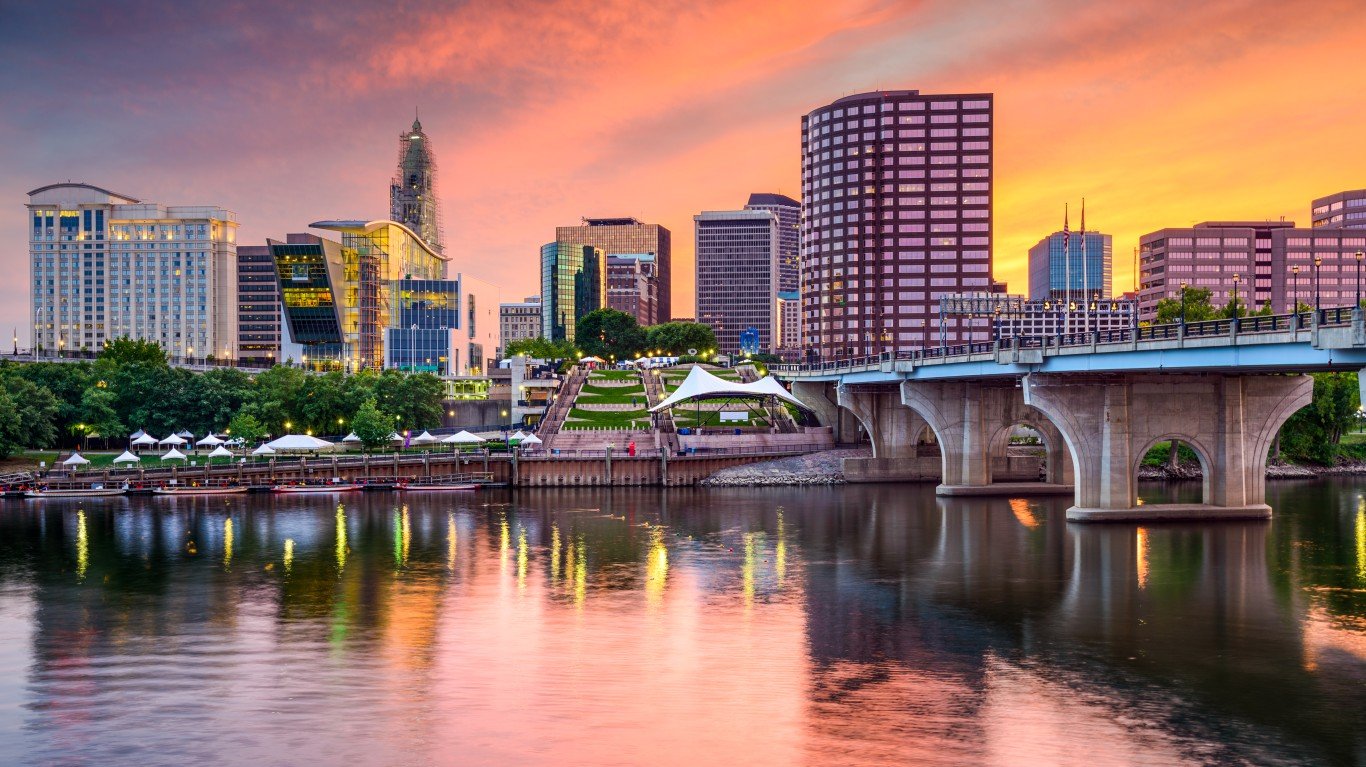
Connecticut
> Most unusual ancestry: Albanian
> Concentration of CT residents with Albanian ancestry: 5.3 times higher than share of U.S. population
> Share of CT residents identifying as having Albanian ancestry: 0.33% (Total: 11,732)
> Share of U.S. pop. identifying as having Albanian ancestry: 0.06% (total: 202,417)
> Share of all U.S. residents identifying as having Albanian ancestry living in CT: 5.80%
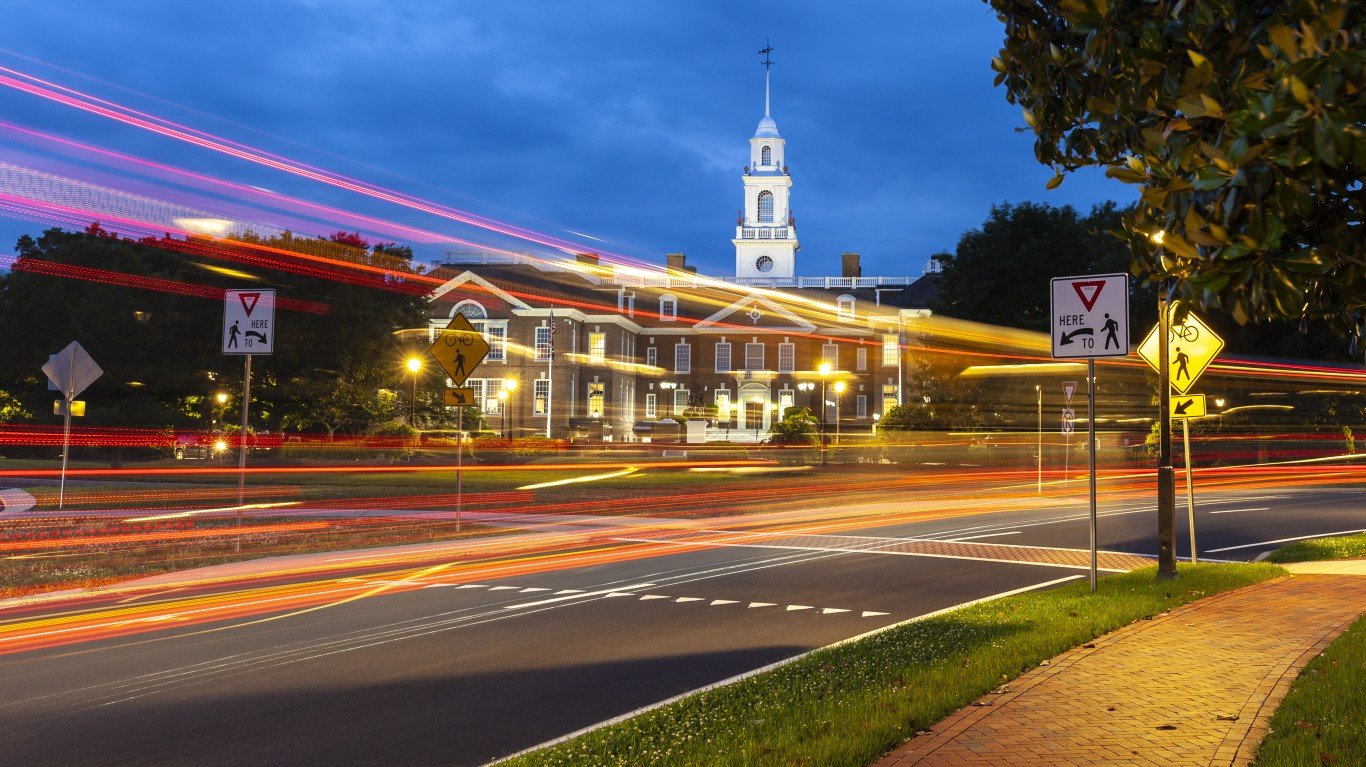
Delaware
> Most unusual ancestry: Kenyan
> Concentration of DE residents with Kenyan ancestry: 2.8 times higher than share of U.S. population
> Share of DE residents identifying as having Kenyan ancestry: 0.08% (Total: 754)
> Share of U.S. pop. identifying as having Kenyan ancestry: 0.03% (total: 91,278)
> Share of all U.S. residents identifying as having Kenyan ancestry living in DE: 0.83%
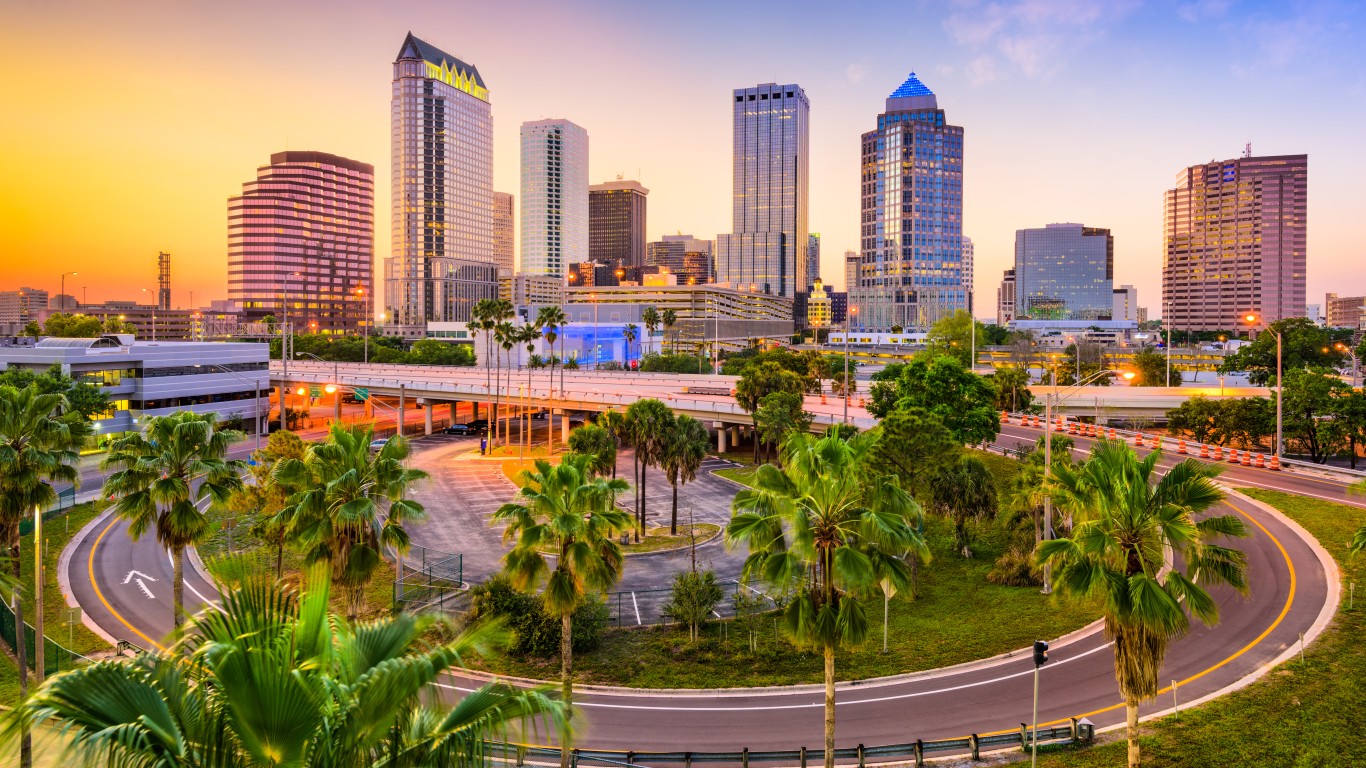
Florida
> Most unusual ancestry: Cuban
> Concentration of FL residents with Cuban ancestry: 10.5 times higher than share of U.S. population
> Share of FL residents identifying as having Cuban ancestry: 5.47% (Total: 1,167,644)
> Share of U.S. pop. identifying as having Cuban ancestry: 0.52% (total: 1,713,308)
> Share of all U.S. residents identifying as having Cuban ancestry living in FL: 68.15%
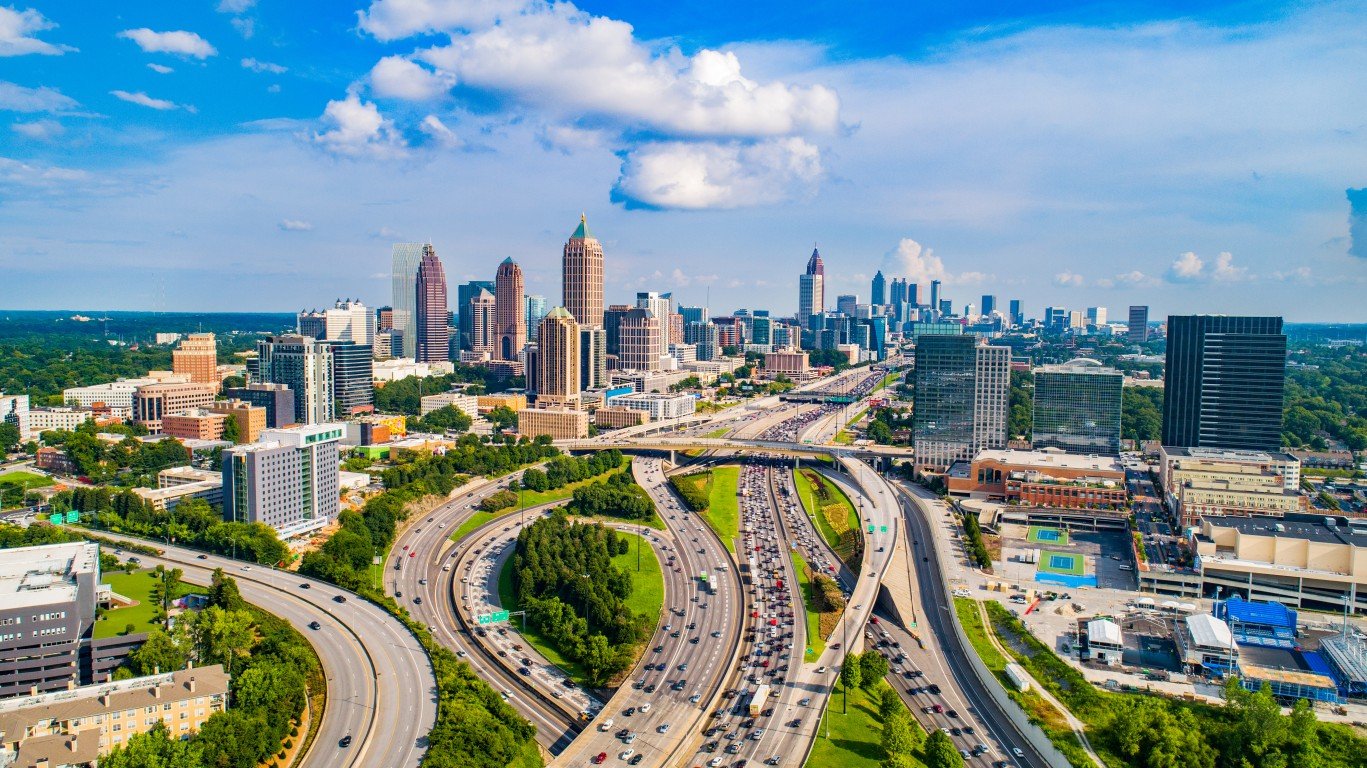
Georgia
> Most unusual ancestry: Bahamian
> Concentration of GA residents with Bahamian ancestry: 3.7 times higher than share of U.S. population
> Share of GA residents identifying as having Bahamian ancestry: 0.05% (Total: 4,978)
> Share of U.S. pop. identifying as having Bahamian ancestry: 0.01% (total: 41,258)
> Share of all U.S. residents identifying as having Bahamian ancestry living in GA: 12.07%
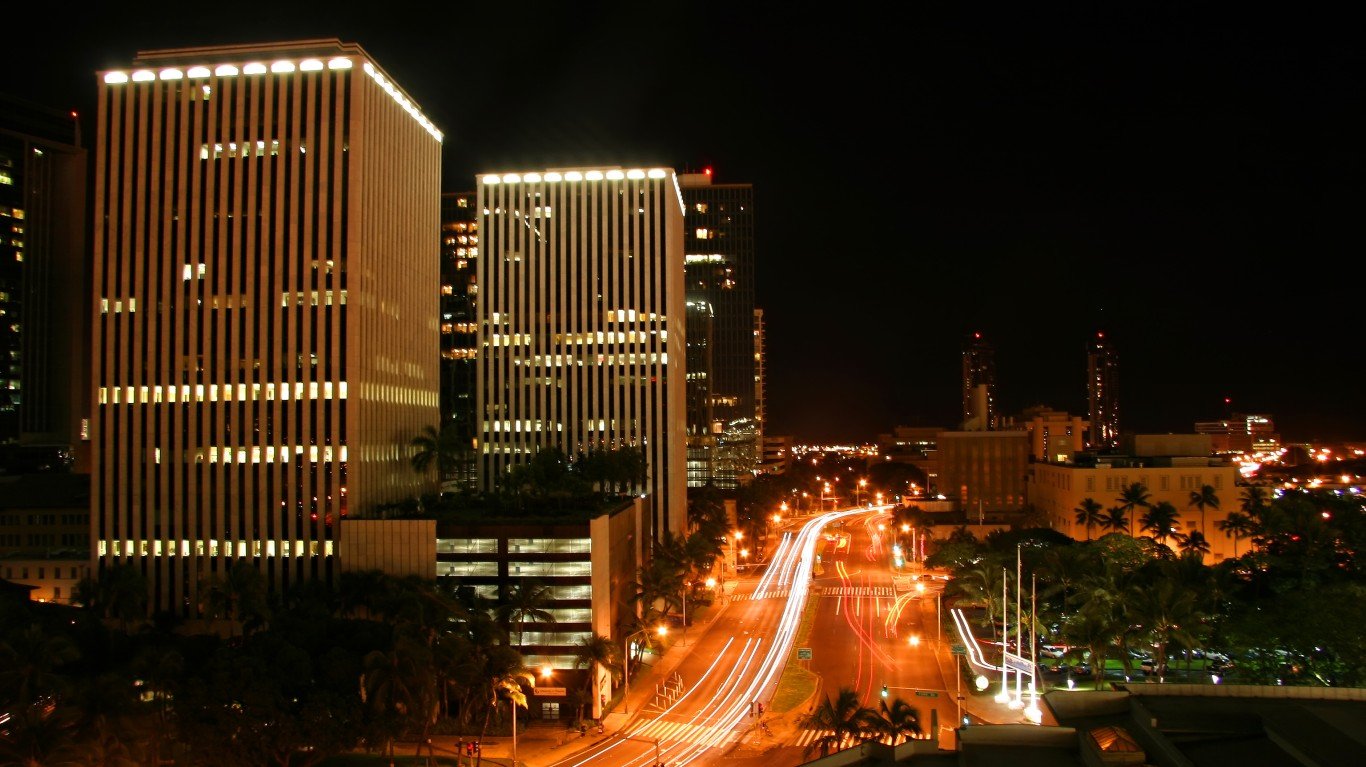
Hawaii
> Most unusual ancestry: Hawaiian
> Concentration of HI residents with Hawaiian ancestry: 130.4 times higher than share of U.S. population
> Share of HI residents identifying as having Hawaiian ancestry: 13.37% (Total: 194,271)
> Share of U.S. pop. identifying as having Hawaiian ancestry: 0.10% (total: 337,948)
> Share of all U.S. residents identifying as having Hawaiian ancestry living in HI: 57.49%
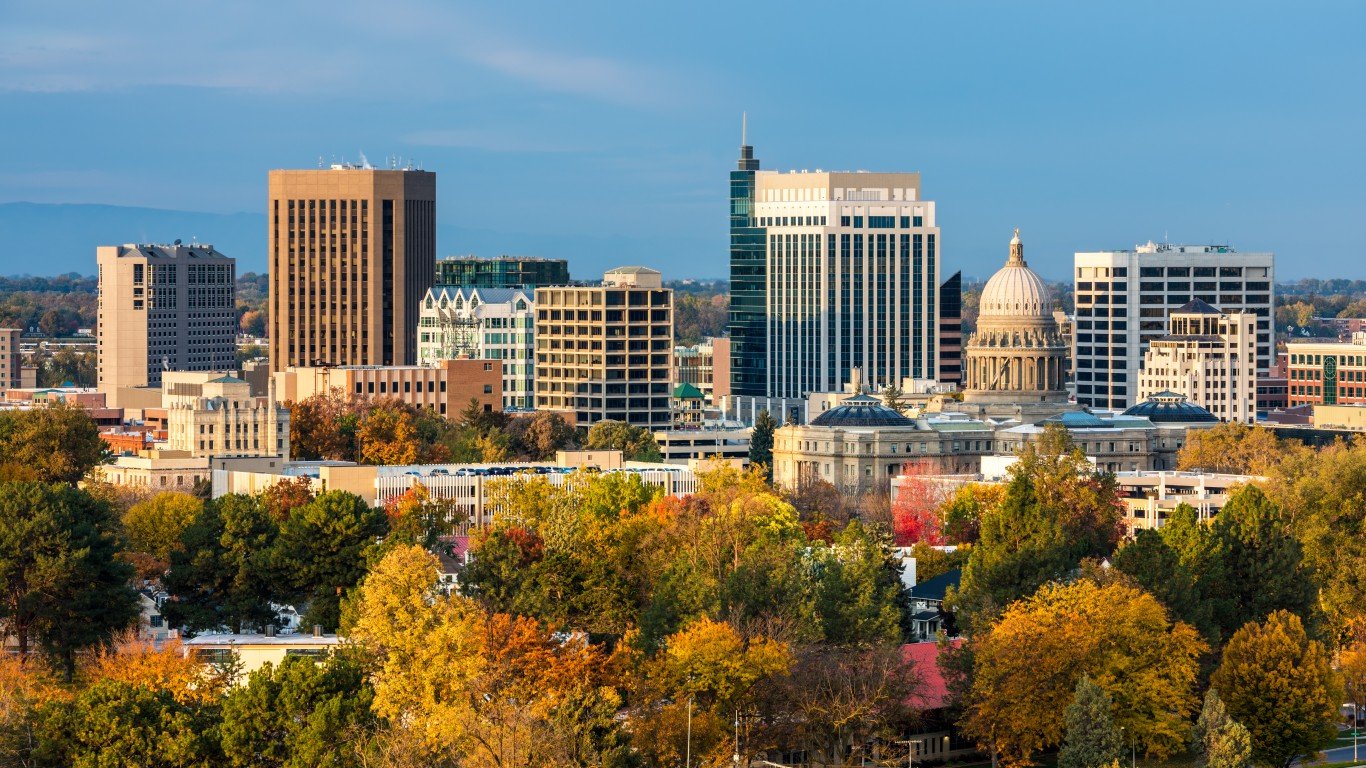
Idaho
> Most unusual ancestry: Basque
> Concentration of ID residents with Basque ancestry: 27.8 times higher than share of U.S. population
> Share of ID residents identifying as having Basque ancestry: 0.36% (Total: 6,519)
> Share of U.S. pop. identifying as having Basque ancestry: 0.01% (total: 42,648)
> Share of all U.S. residents identifying as having Basque ancestry living in ID: 15.29%
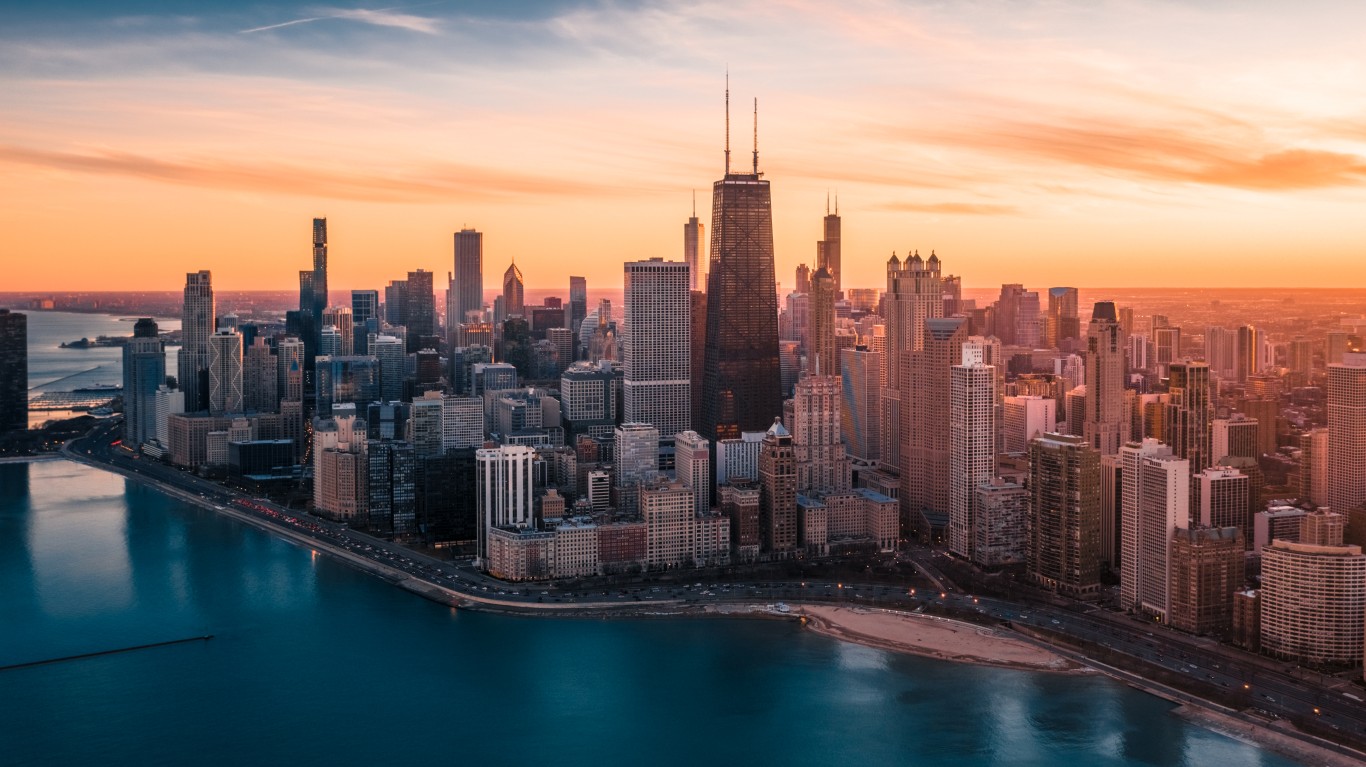
Illinois
> Most unusual ancestry: Assyrian
> Concentration of IL residents with Assyrian ancestry: 8.2 times higher than share of U.S. population
> Share of IL residents identifying as having Assyrian ancestry: 0.09% (Total: 11,896)
> Share of U.S. pop. identifying as having Assyrian ancestry: 0.01% (total: 37,120)
> Share of all U.S. residents identifying as having Assyrian ancestry living in IL: 32.05%
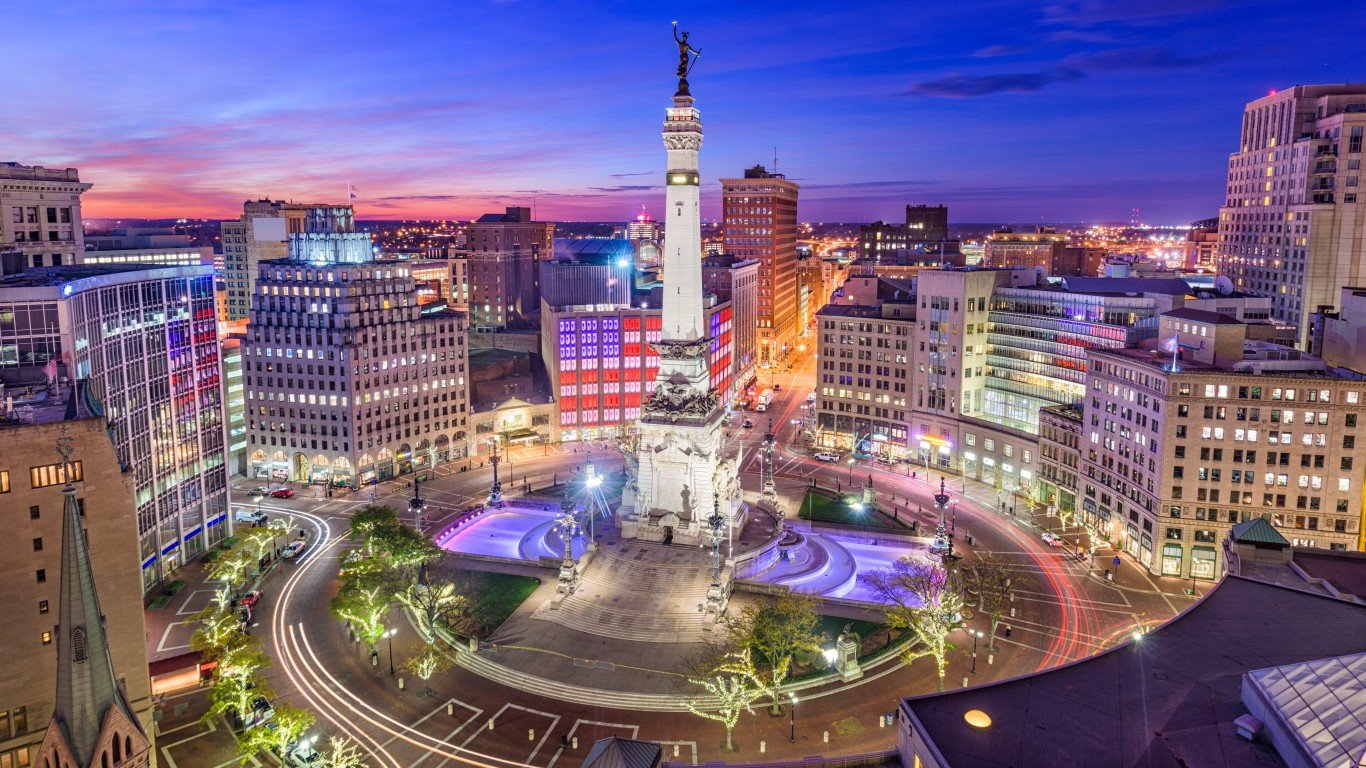
Indiana
> Most unusual ancestry: Burmese
> Concentration of IN residents with Burmese ancestry: 6.7 times higher than share of U.S. population
> Share of IN residents identifying as having Burmese ancestry: 0.34% (Total: 23,158)
> Share of U.S. pop. identifying as having Burmese ancestry: 0.05% (total: 168,610)
> Share of all U.S. residents identifying as having Burmese ancestry living in IN: 13.73%
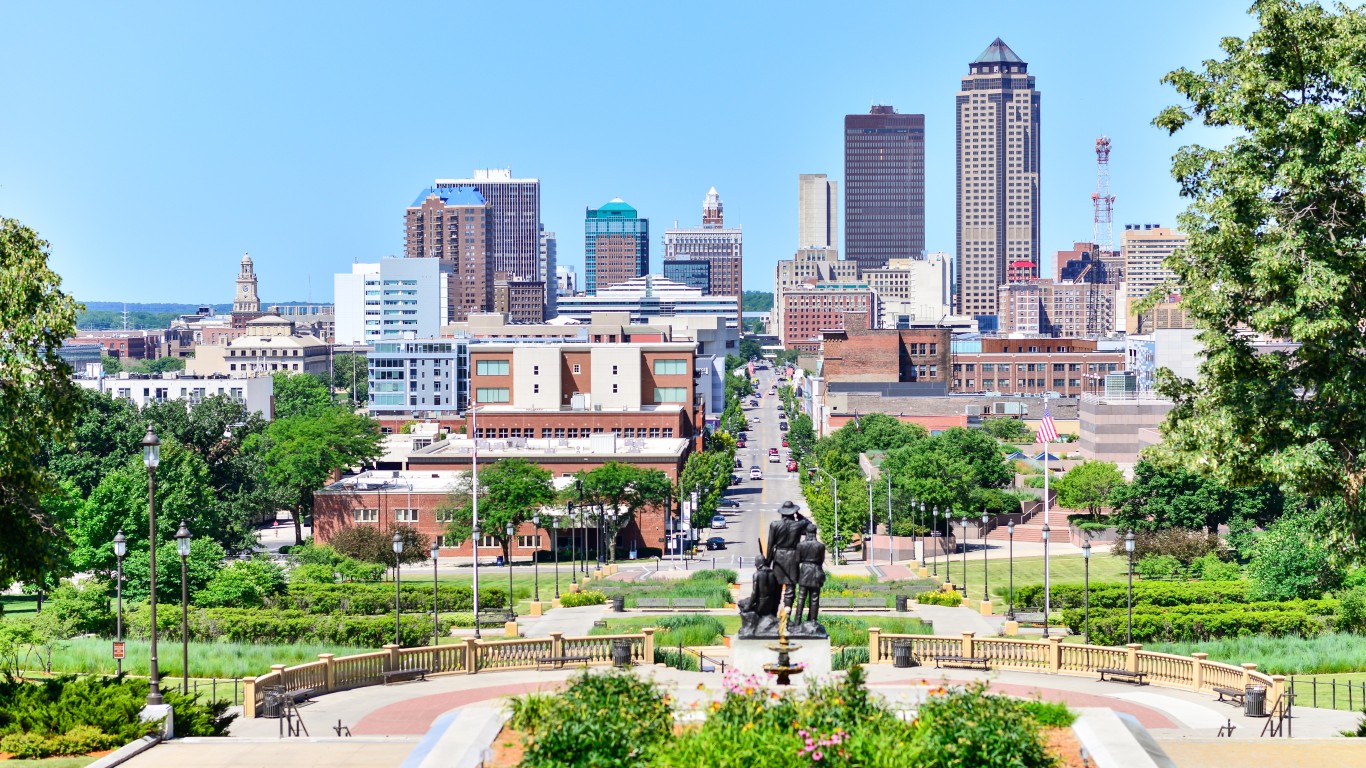
Iowa
> Most unusual ancestry: Luxembourger
> Concentration of IA residents with Luxembourger ancestry: 14.4 times higher than share of U.S. population
> Share of IA residents identifying as having Luxembourger ancestry: 0.09% (Total: 3,011)
> Share of U.S. pop. identifying as having Luxembourger ancestry: 0.01% (total: 21,667)
> Share of all U.S. residents identifying as having Luxembourger ancestry living in IA: 13.90%
Kansas
> Most unusual ancestry: German-Russian
> Concentration of KS residents with German-Russian ancestry: 9.9 times higher than share of U.S. population
> Share of KS residents identifying as having German-Russian ancestry: 0.06% (Total: 1,812)
> Share of U.S. pop. identifying as having German-Russian ancestry: 0.01% (total: 20,579)
> Share of all U.S. residents identifying as having German-Russian ancestry living in KS: 8.81%
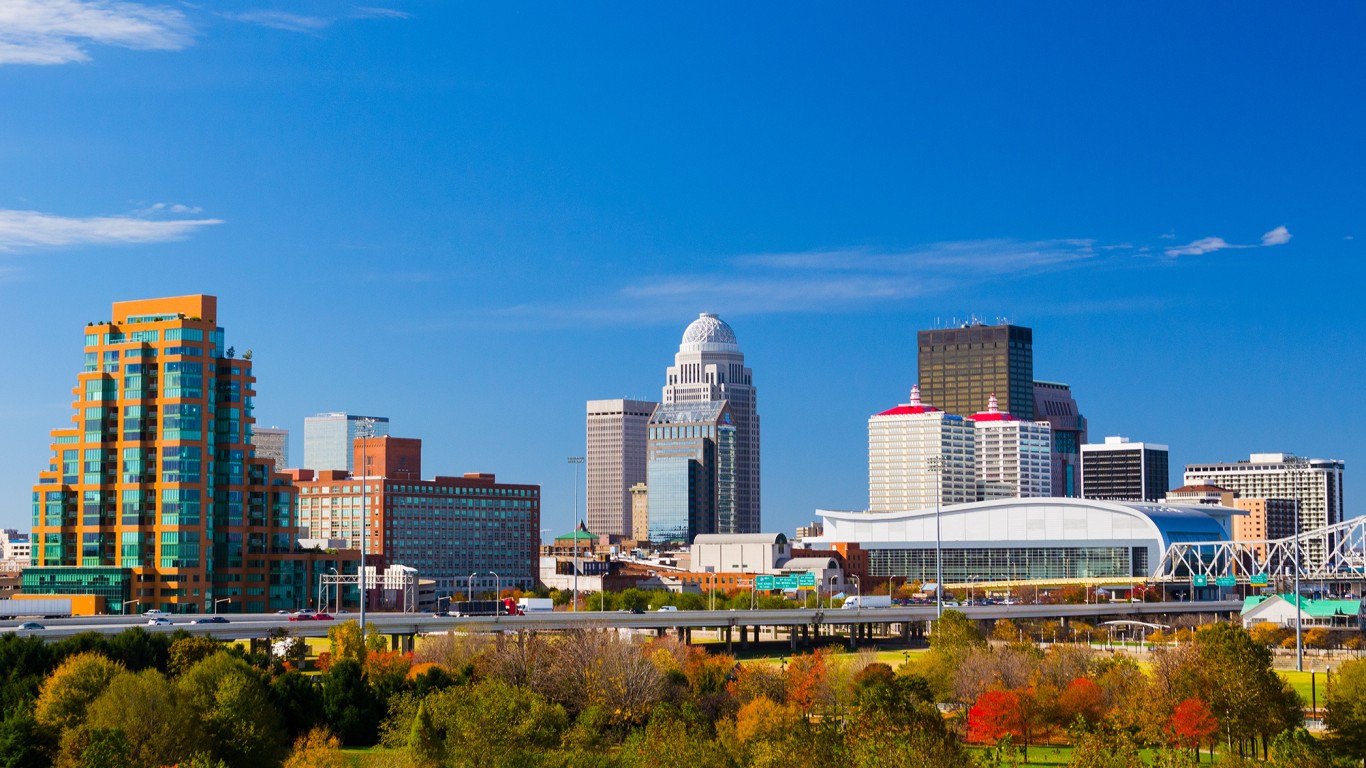
Kentucky
> Most unusual ancestry: Appalachian
> Concentration of KY residents with Appalachian ancestry: 5.3 times higher than share of U.S. population
> Share of KY residents identifying as having Appalachian ancestry: 0.03% (Total: 1,186)
> Share of U.S. pop. identifying as having Appalachian ancestry: 0.00% (total: 16,486)
> Share of all U.S. residents identifying as having Appalachian ancestry living in KY: 7.19%
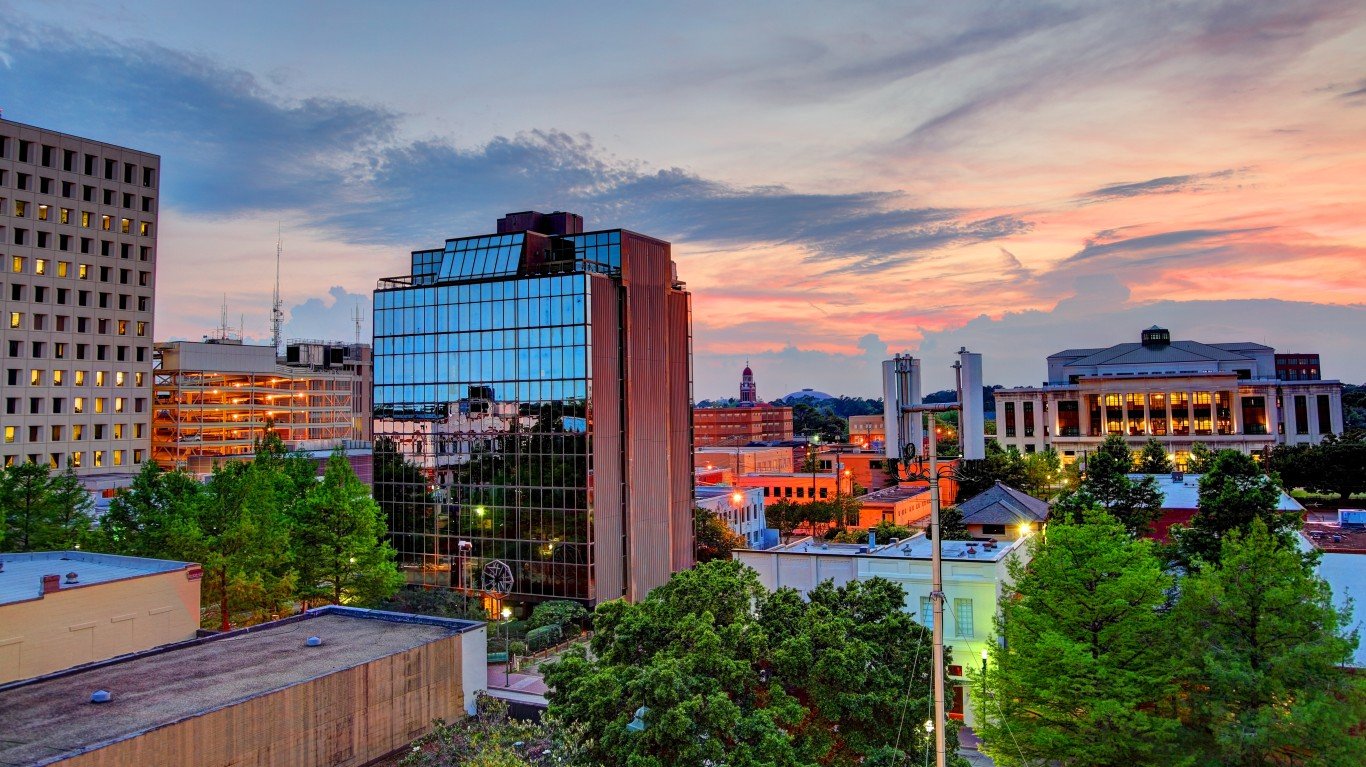
Louisiana
> Most unusual ancestry: Cajun
> Concentration of LA residents with Cajun ancestry: 39.8 times higher than share of U.S. population
> Share of LA residents identifying as having Cajun ancestry: 1.00% (Total: 46,775)
> Share of U.S. pop. identifying as having Cajun ancestry: 0.03% (total: 83,268)
> Share of all U.S. residents identifying as having Cajun ancestry living in LA: 56.17%
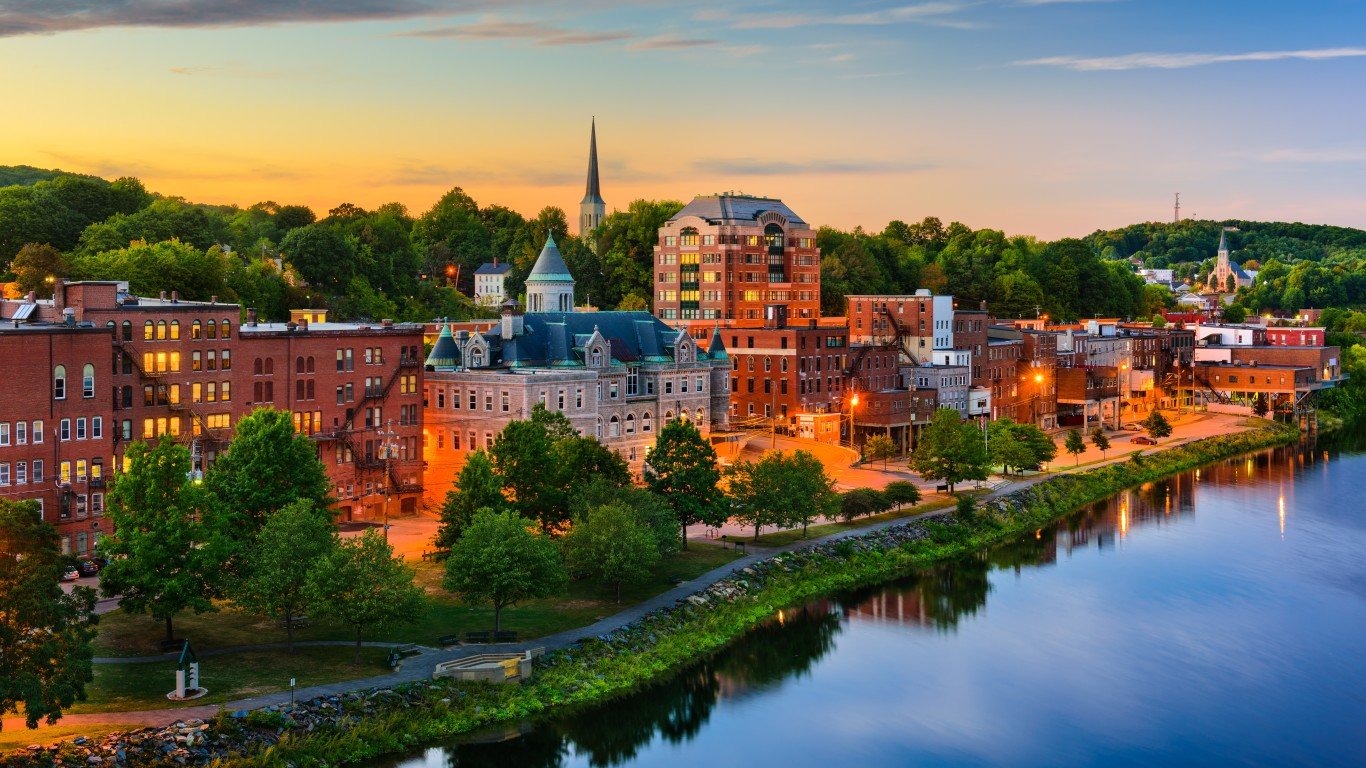
Maine
> Most unusual ancestry: French-Canadian
> Concentration of ME residents with French-Canadian ancestry: 15.5 times higher than share of U.S. population
> Share of ME residents identifying as having French-Canadian ancestry: 6.29% (Total: 85,411)
> Share of U.S. pop. identifying as having French- Canadian ancestry: 0.41% (total: 1,340,208)
> Share of all U.S. residents identifying as having French-Canadian ancestry living in ME: 6.37%
Maryland
> Most unusual ancestry: Cameroonian
> Concentration of MD residents with Cameroonian ancestry: 14.2 times higher than share of U.S. population
> Share of MD residents identifying as having Cameroonian ancestry: 0.25% (Total: 15,200)
> Share of U.S. pop. identifying as having Cameroonian ancestry: 0.02% (total: 57,212)
> Share of all U.S. residents identifying as having Cameroonian ancestry living in MD: 26.57%
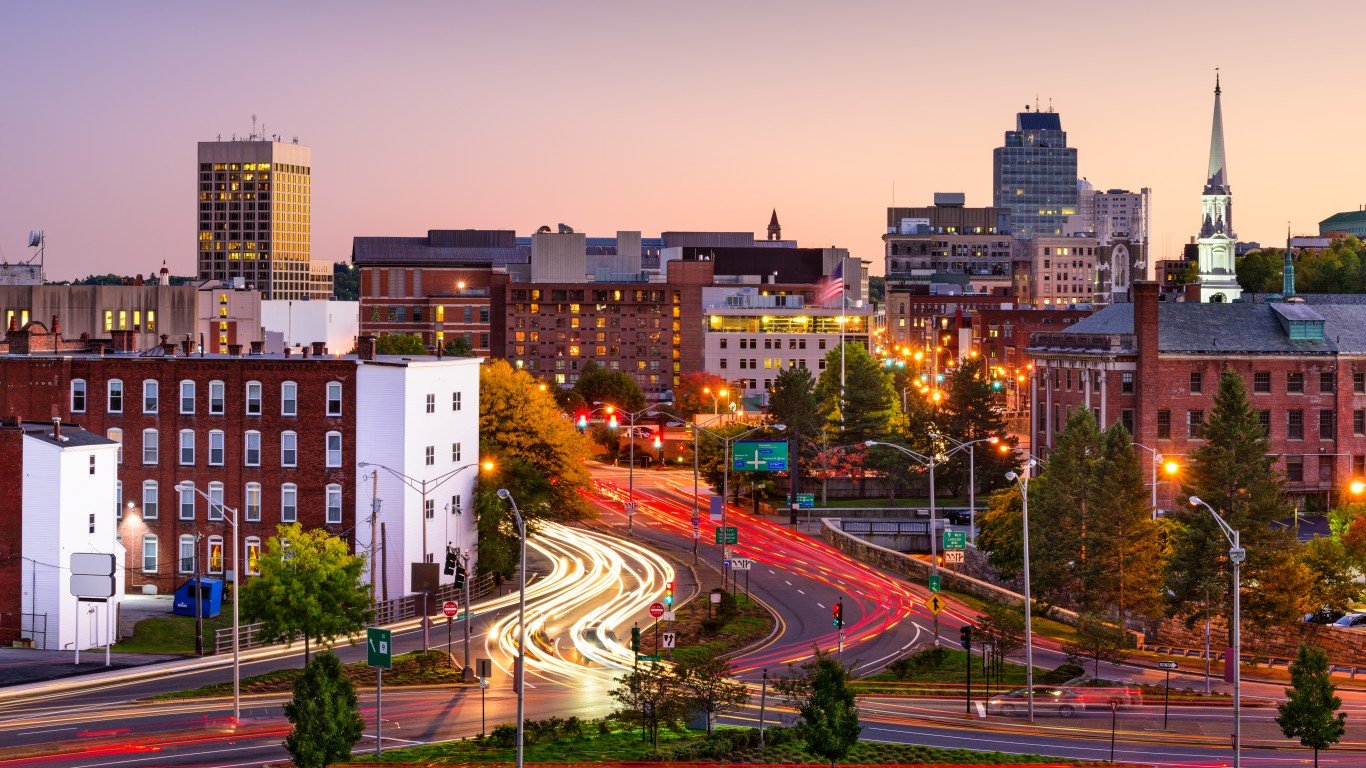
Massachusetts
> Most unusual ancestry: Cape Verdean
> Concentration of MA residents with Cape Verdean ancestry: 31.4 times higher than share of U.S. population
> Share of MA residents identifying as having Cape Verdean ancestry: 0.93% (Total: 64,889)
> Share of U.S. pop. identifying as having Cape Verdean ancestry: 0.03% (total: 97,395)
> Share of all U.S. residents identifying as having Cape Verdean ancestry living in MA: 66.62%
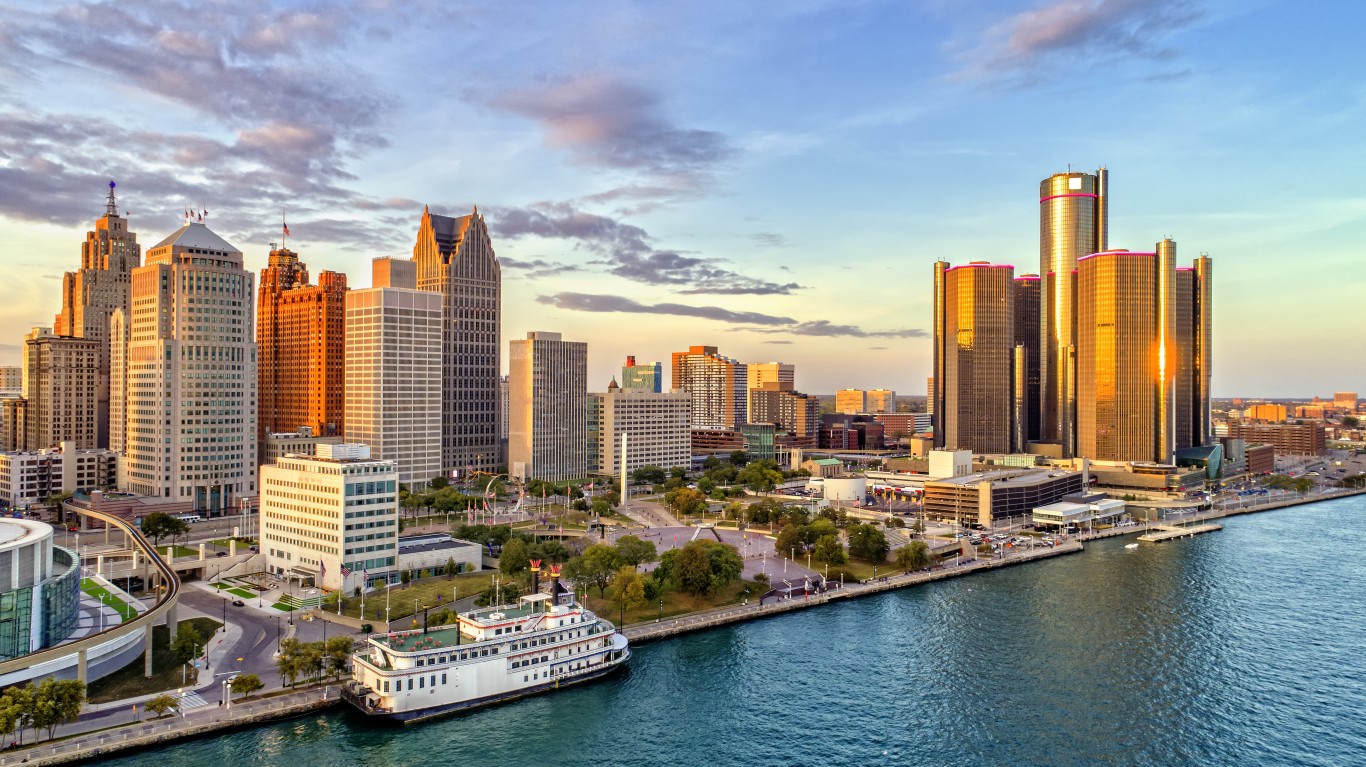
Michigan
> Most unusual ancestry: Chaldean
> Concentration of MI residents with Chaldean ancestry: 25.8 times higher than share of U.S. population
> Share of MI residents identifying as having Chaldean ancestry: 0.39% (Total: 39,120)
> Share of U.S. pop. identifying as having Chaldean ancestry: 0.02% (total: 49,673)
> Share of all U.S. residents identifying as having Chaldean ancestry living in MI: 78.76%
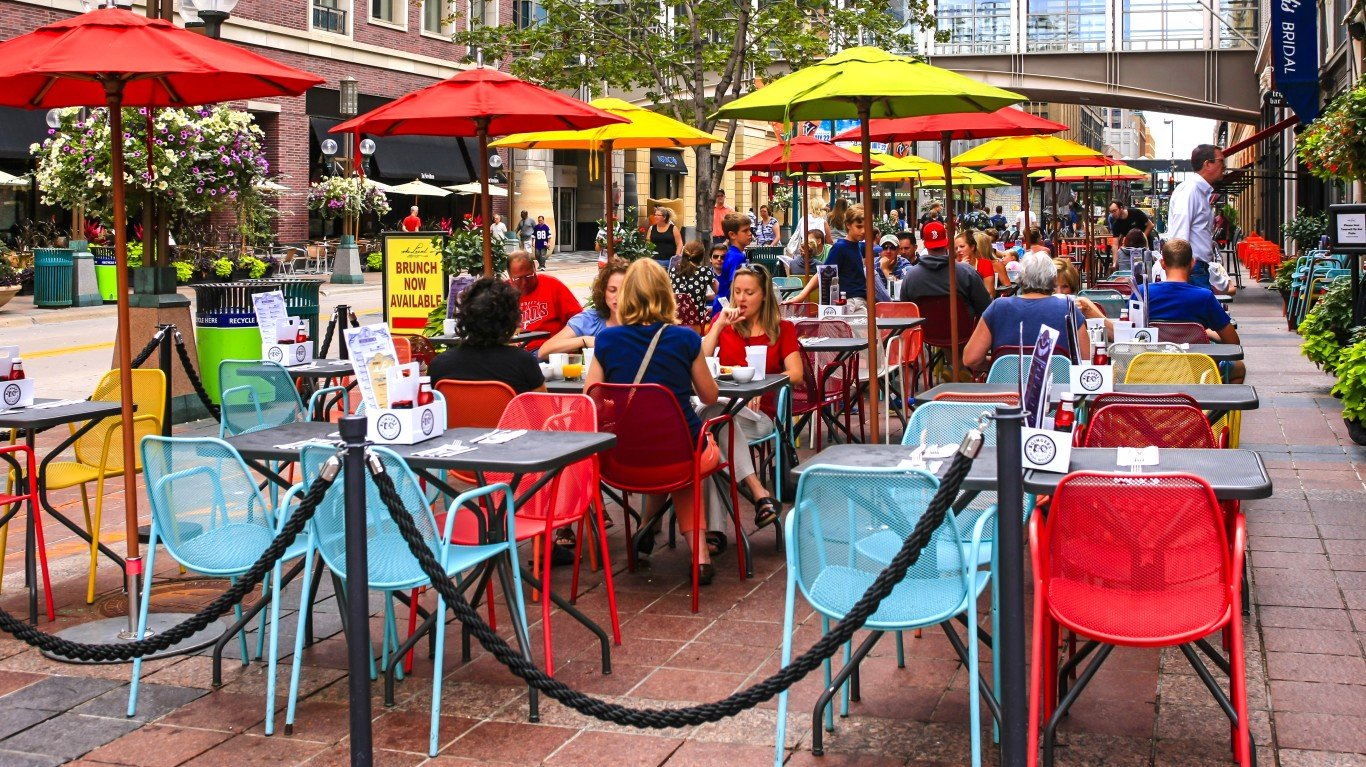
Minnesota
> Most unusual ancestry: Somali
> Concentration of MN residents with Somali ancestry: 23.5 times higher than share of U.S. population
> Share of MN residents identifying as having Somali ancestry: 1.19% (Total: 67,284)
> Share of U.S. pop. identifying as having Somali ancestry: 0.05% (total: 166,785)
> Share of all U.S. residents identifying as having Somali ancestry living in MN: 40.34%
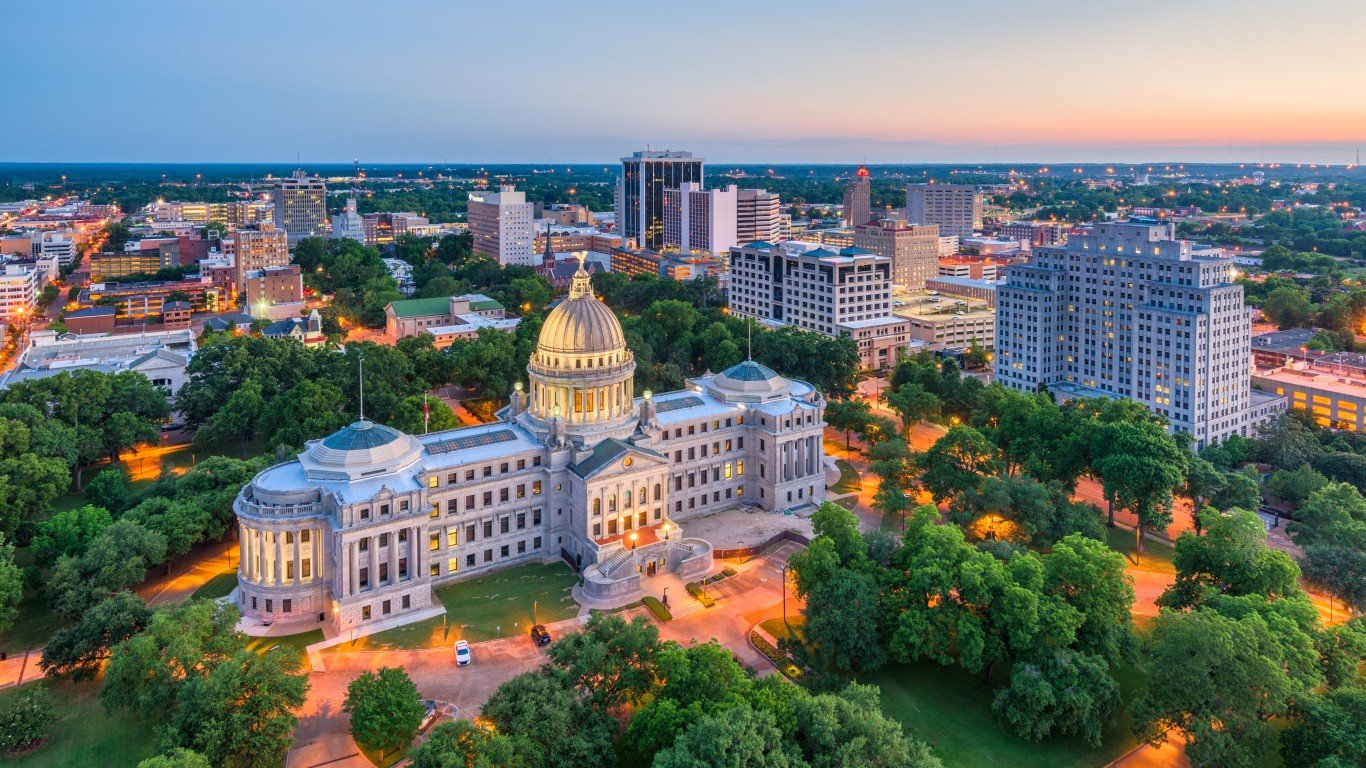
Mississippi
> Most unusual ancestry: African-American
> Concentration of MS residents with African-American ancestry: 3.9 times higher than share of U.S. population
> Share of MS residents identifying as having African-American ancestry: 28.19% (Total: 836,395)
> Share of U.S. pop. identifying as having African-American ancestry: 7.23% (total: 23,832,649)
> Share of all U.S. residents identifying as having African-American ancestry living in MS: 3.51%
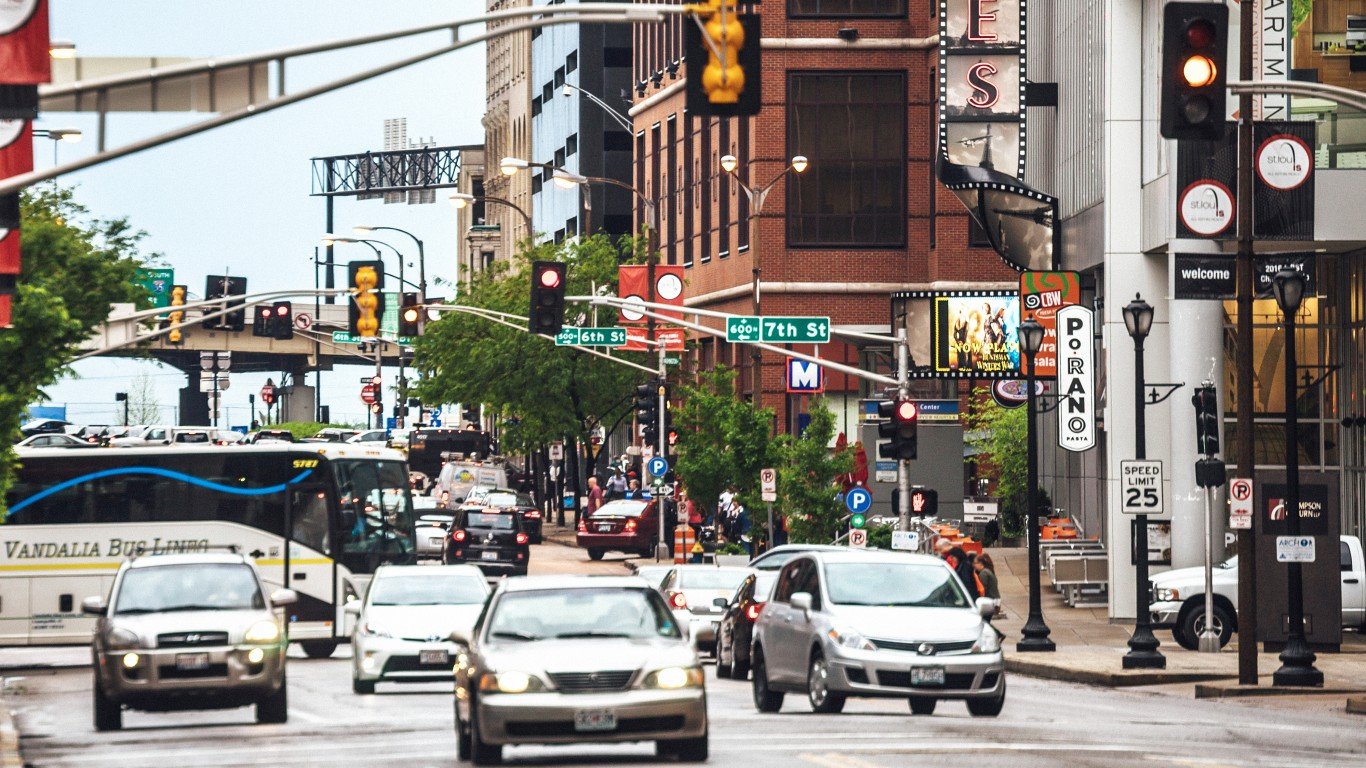
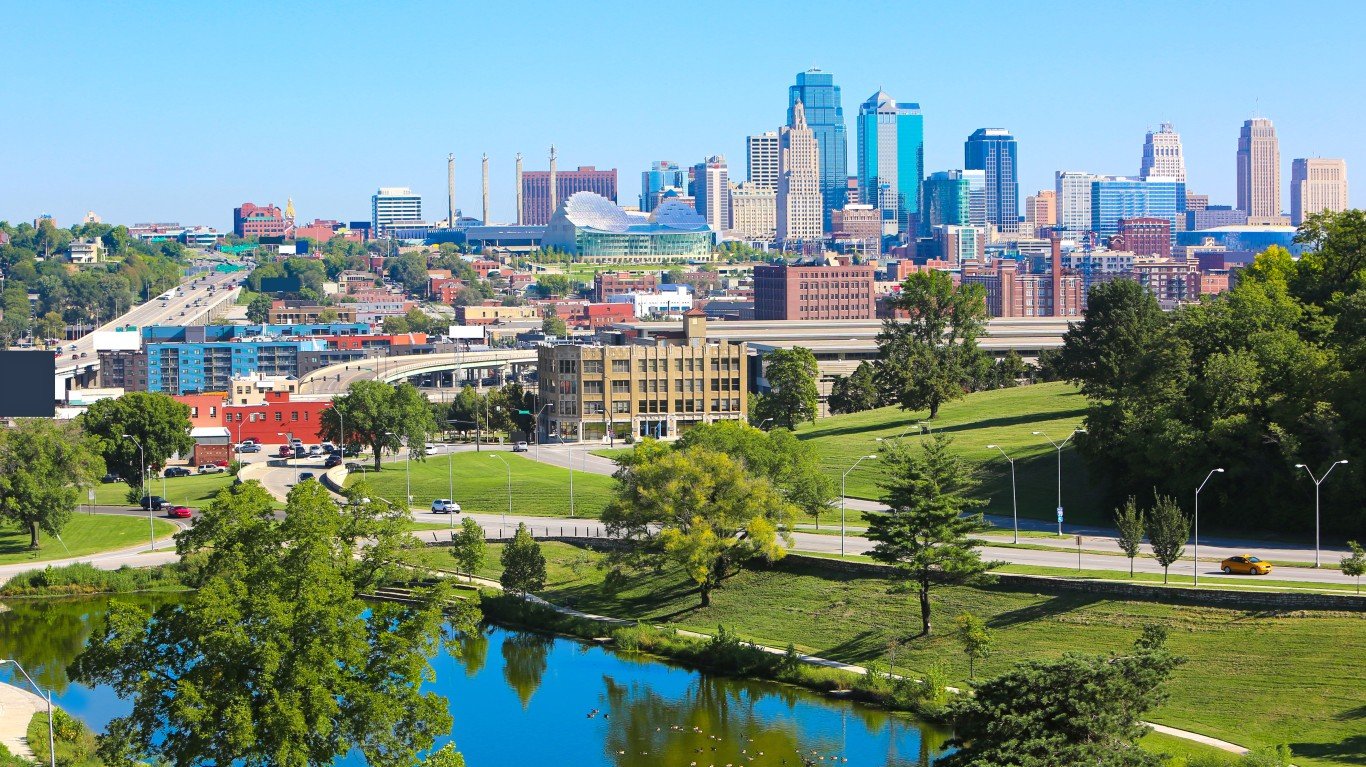
Missouri
> Most unusual ancestry: Bosnian and Herzegovinian
> Concentration of MO residents with Bosnian and Herzegovinian ancestry: 5.0 times higher than share of U.S. population
> Share of MO residents identifying as having Bosnian and Herzegovinian ancestry: 0.18% (Total: 10,912)
> Share of U.S. pop. identifying as having Bosnian and Herzegovinian ancestry: 0.04% (total: 116,270)
> Share of all U.S. residents identifying as having Bosnian and Herzegovinian ancestry living in MO: 9.39%
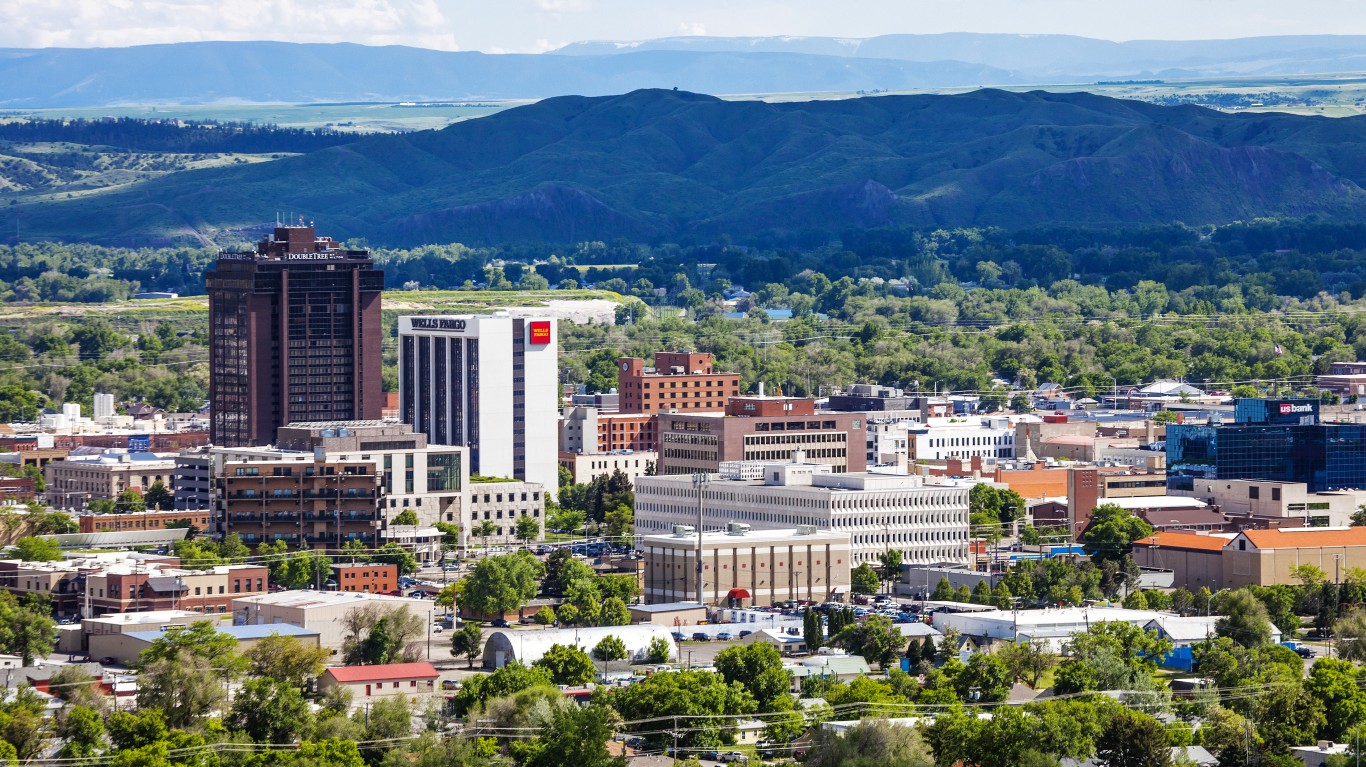
Montana
> Most unusual ancestry: Native American
> Concentration of MT residents with Native American ancestry: 7.4 times higher than share of U.S. population
> Share of MT residents identifying as having Native American ancestry: 3.51% (Total: 37,784)
> Share of U.S. pop. identifying as having Native American ancestry: 0.48% (total: 1,570,517)
> Share of all U.S. residents identifying as having Native American ancestry living in MT: 2.41%
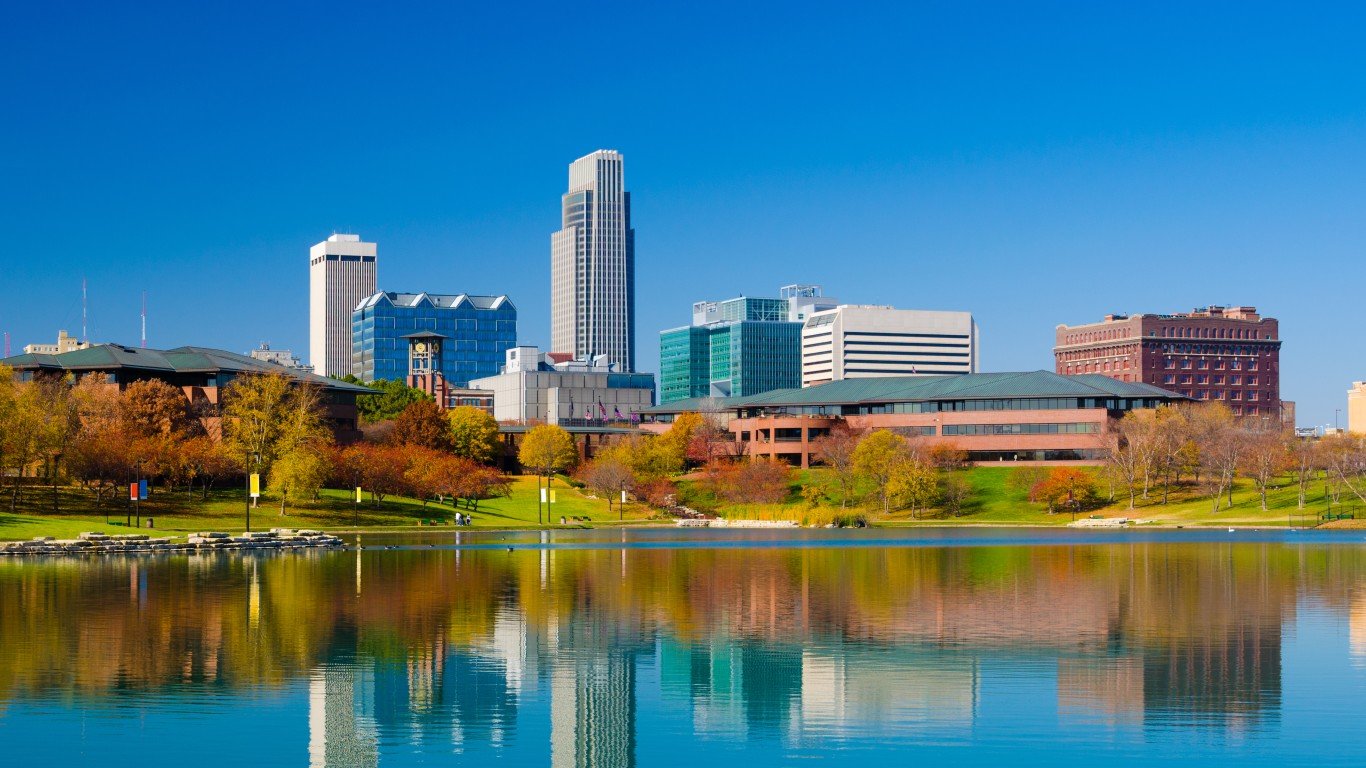
Nebraska
> Most unusual ancestry: Sudanese
> Concentration of NE residents with Sudanese ancestry: 13.7 times higher than share of U.S. population
> Share of NE residents identifying as having Sudanese ancestry: 0.30% (Total: 5,867)
> Share of U.S. pop. identifying as having Sudanese ancestry: 0.02% (total: 72,431)
> Share of all U.S. residents identifying as having Sudanese ancestry living in NE: 8.10%
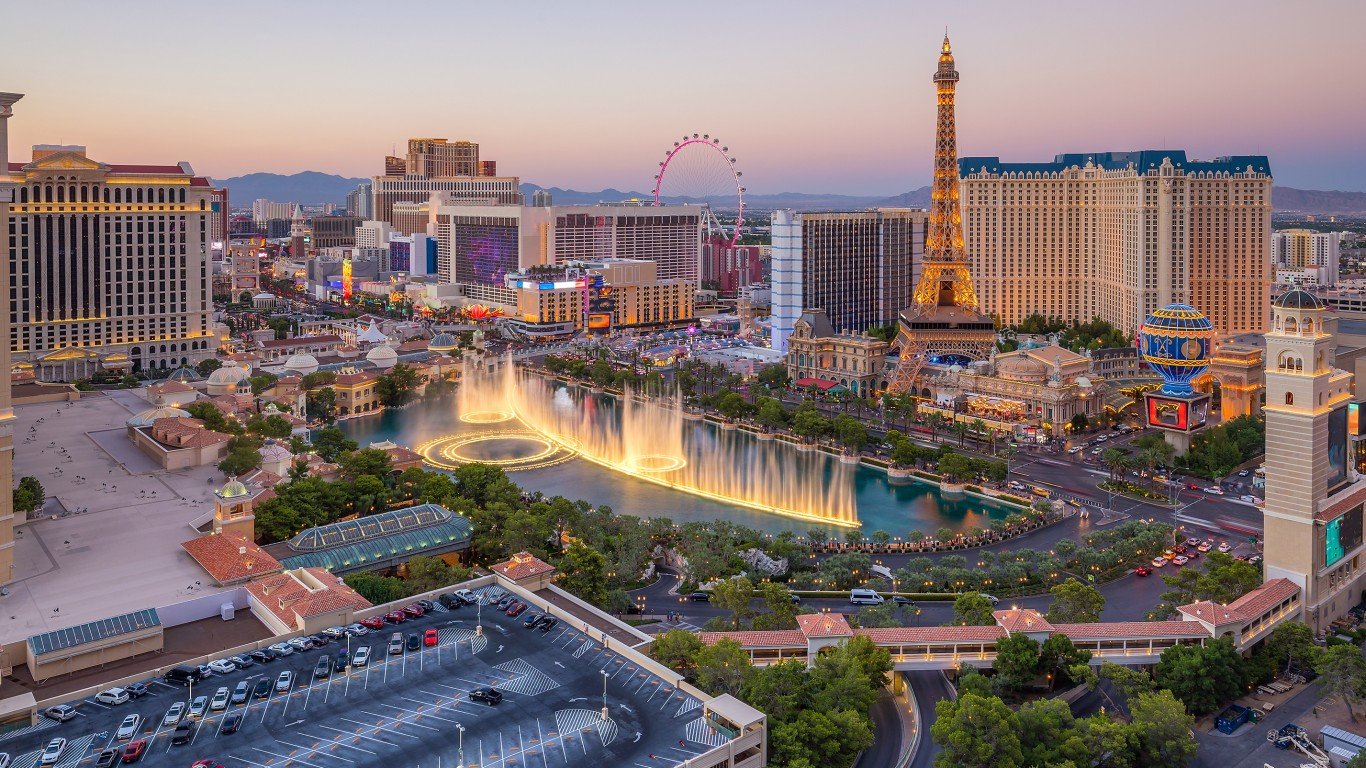
Nevada
> Most unusual ancestry: Basque
> Concentration of NV residents with Basque ancestry: 9.1 times higher than share of U.S. population
> Share of NV residents identifying as having Basque ancestry: 0.12% (Total: 3,585)
> Share of U.S. pop. identifying as having Basque ancestry: 0.01% (total: 42,648)
> Share of all U.S. residents identifying as having Basque ancestry living in NV: 8.41%
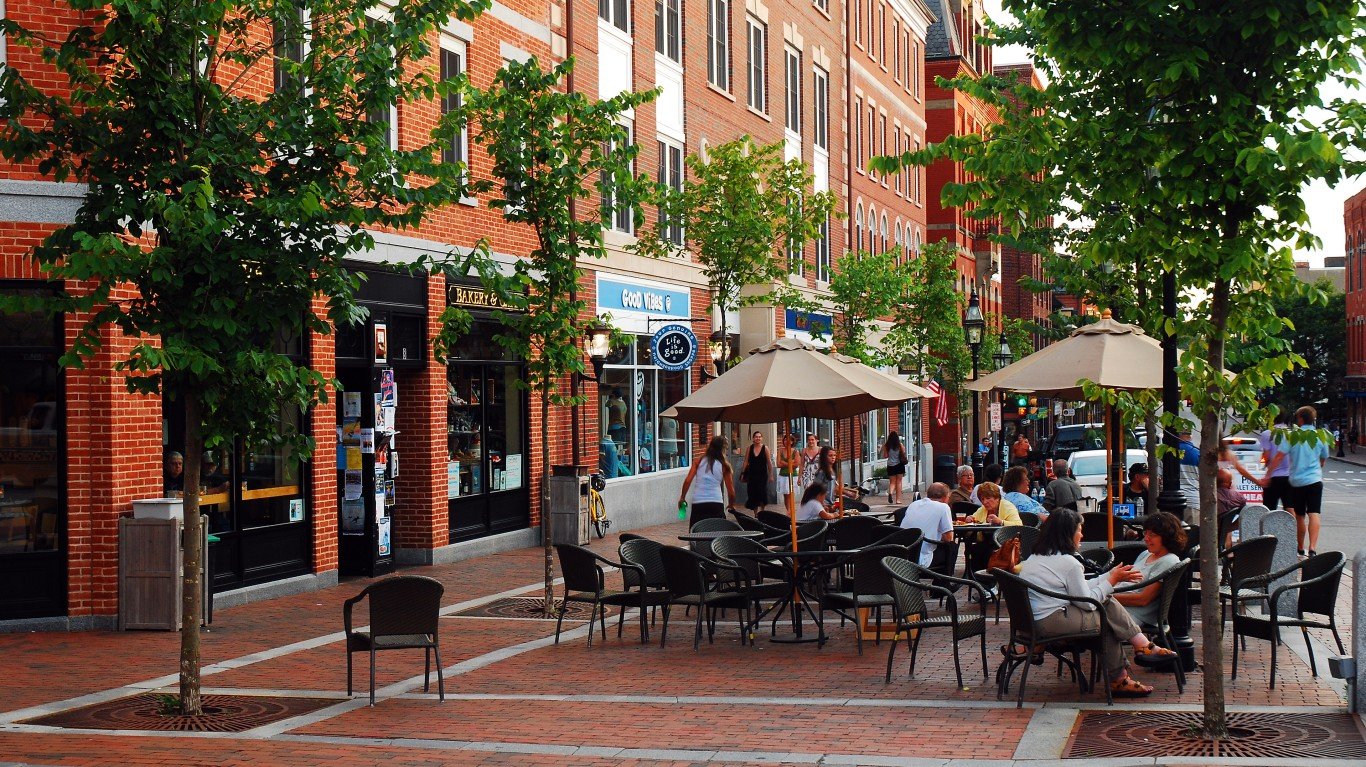
New Hampshire
> Most unusual ancestry: French-Canadian
> Concentration of NH residents with French-Canadian ancestry: 16.9 times higher than share of U.S. population
> Share of NH residents identifying as having French-Canadian ancestry: 6.86% (Total: 94,115)
> Share of U.S. pop. identifying as having French-Canadian ancestry: 0.41% (total: 1,340,208)
> Share of all U.S. residents identifying as having French-Canadian ancestry living in NH: 7.02%
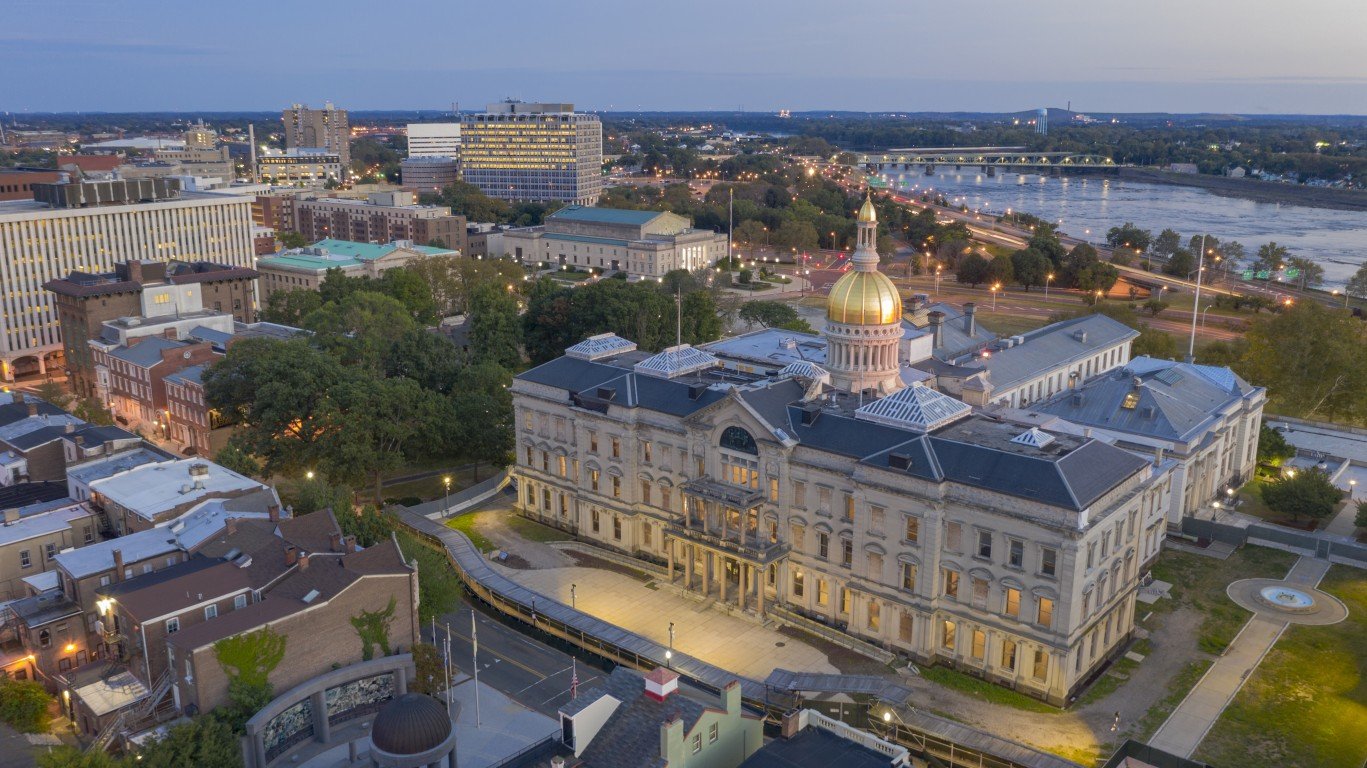
New Jersey
> Most unusual ancestry: Ecuadorian
> Concentration of NJ residents with Ecuadorian ancestry: 6.9 times higher than share of U.S. population
> Share of NJ residents identifying as having Ecuadorian ancestry: 1.19% (Total: 109,657)
> Share of U.S. pop. identifying as having Ecuadorian ancestry: 0.17% (total: 566,205)
> Share of all U.S. residents identifying as having Ecuadorian ancestry living in NJ: 19.37%
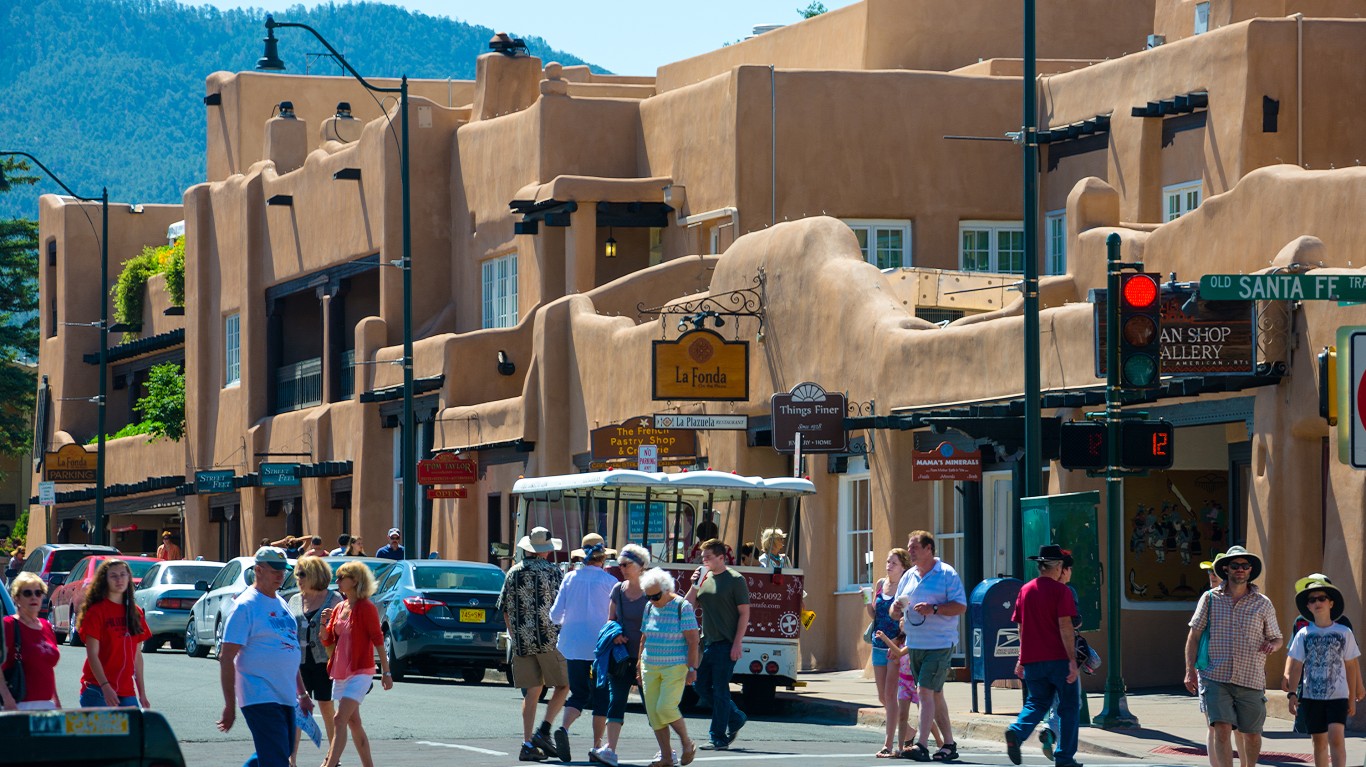
New Mexico
> Most unusual ancestry: Spanish-American
> Concentration of NM residents with Spanish-American ancestry: 22.3 times higher than share of U.S. population
> Share of NM residents identifying as having Spanish-American ancestry: 0.38% (Total: 7,922)
> Share of U.S. pop. identifying as having Spanish-American ancestry: 0.02% (total: 55,516)
> Share of all U.S. residents identifying as having Spanish-American ancestry living in NM: 14.27%
New York
> Most unusual ancestry: St. Vincent-Grenadine Islander
> Concentration of NY residents with St. Vincent-Grenadine Islander ancestry: 11.4 times higher than share of U.S. population
> Share of NY residents identifying as having St. Vincent-Grenadine Islander ancestry: 0.05% (Total: 10,309)
> Share of U.S. pop. identifying as having St. Vincent-Grenadine Islander ancestry: 0.00% (total: 14,780)
> Share of all U.S. residents identifying as having St. Vincent-Grenadine Islander ancestry living in NY: 69.75%
North Carolina
> Most unusual ancestry: Scotch-Irish
> Concentration of NC residents with Scotch-Irish ancestry: 2.8 times higher than share of U.S. population
> Share of NC residents identifying as having Scotch-Irish ancestry: 1.72% (Total: 178,352)
> Share of U.S. pop. identifying as having Scotch-Irish ancestry: 0.61% (total: 2,001,958)
> Share of all U.S. residents identifying as having Scotch-Irish ancestry living in NC: 8.91%
North Dakota
> Most unusual ancestry: German-Russian
> Concentration of ND residents with German-Russian ancestry: 54.8 times higher than share of U.S. population
> Share of ND residents identifying as having German-Russian ancestry: 0.34% (Total: 2,643)
> Share of U.S. pop. identifying as having German-Russian ancestry: 0.01% (total: 20,579)
> Share of all U.S. residents identifying as having German-Russian ancestry living in ND: 12.84%
Ohio
> Most unusual ancestry: Slovene
> Concentration of OH residents with Slovene ancestry: 8.1 times higher than share of U.S. population
> Share of OH residents identifying as having Slovene ancestry: 0.26% (Total: 30,261)
> Share of U.S. pop. identifying as having Slovene ancestry: 0.03% (total: 105,166)
> Share of all U.S. residents identifying as having Slovene ancestry living in OH: 28.77%
Oklahoma
> Most unusual ancestry: Dutch West Indian
> Concentration of OK residents with Dutch West Indian ancestry: 23.5 times higher than share of U.S. population
> Share of OK residents identifying as having Dutch West Indian ancestry: 0.10% (Total: 3,876)
> Share of U.S. pop. identifying as having Dutch West Indian ancestry: 0.00% (total: 13,798)
> Share of all U.S. residents identifying as having Dutch West Indian ancestry living in OK: 28.09%
Oregon
> Most unusual ancestry: Micronesian
> Concentration of OR residents with Micronesian ancestry: 4.3 times higher than share of U.S. population
> Share of OR residents identifying as having Micronesian ancestry: 0.04% (Total: 1,707)
> Share of U.S. pop. identifying as having Micronesian ancestry: 0.01% (total: 30,891)
> Share of all U.S. residents identifying as having Micronesian ancestry living in OR: 5.53%
Pennsylvania
> Most unusual ancestry: Pennsylvania German
> Concentration of PA residents with Pennsylvania German ancestry: 12.4 times higher than share of U.S. population
> Share of PA residents identifying as having Pennsylvania German ancestry: 0.85% (Total: 110,090)
> Share of U.S. pop. identifying as having Pennsylvania German ancestry: 0.07% (total: 225,859)
> Share of all U.S. residents identifying as having Pennsylvania German ancestry living in PA: 48.74%
Rhode Island
> Most unusual ancestry: Cape Verdean
> Concentration of RI residents with Cape Verdean ancestry: 49.7 times higher than share of U.S. population
> Share of RI residents identifying as having Cape Verdean ancestry: 1.47% (Total: 16,033)
> Share of U.S. pop. identifying as having Cape Verdean ancestry: 0.03% (total: 97,395)
> Share of all U.S. residents identifying as having Cape Verdean ancestry living in RI: 16.46%
South Carolina
> Most unusual ancestry: Micronesian
> Concentration of SC residents with Micronesian ancestry: 3.6 times higher than share of U.S. population
> Share of SC residents identifying as having Micronesian ancestry: 0.03% (Total: 1,696)
> Share of U.S. pop. identifying as having Micronesian ancestry: 0.01% (total: 30,891)
> Share of all U.S. residents identifying as having Micronesian ancestry living in SC: 5.49%
South Dakota
> Most unusual ancestry: Native American
> Concentration of SD residents with Native American ancestry: 11.2 times higher than share of U.S. population
> Share of SD residents identifying as having Native American ancestry: 5.35% (Total: 47,189)
> Share of U.S. pop. identifying as having Native American ancestry: 0.48% (total: 1,570,517)
> Share of all U.S. residents identifying as having Native American ancestry living in SD: 3.00%
Tennessee
> Most unusual ancestry: Kurdish
> Concentration of TN residents with Kurdish ancestry: 12.1 times higher than share of U.S. population
> Share of TN residents identifying as having Kurdish ancestry: 0.09% (Total: 6,323)
> Share of U.S. pop. identifying as having Kurdish ancestry: 0.01% (total: 25,185)
> Share of all U.S. residents identifying as having Kurdish ancestry living in TN: 25.11%
Texas
> Most unusual ancestry: Mexican-American
> Concentration of TX residents with Mexican-American ancestry: 3.9 times higher than share of U.S. population
> Share of TX residents identifying as having Mexican-American ancestry: 4.70% (Total: 1,356,482)
> Share of U.S. pop. identifying as having Mexican-American ancestry: 1.22% (total: 4,024,997)
> Share of all U.S. residents identifying as having Mexican-American ancestry living in TX: 33.70%
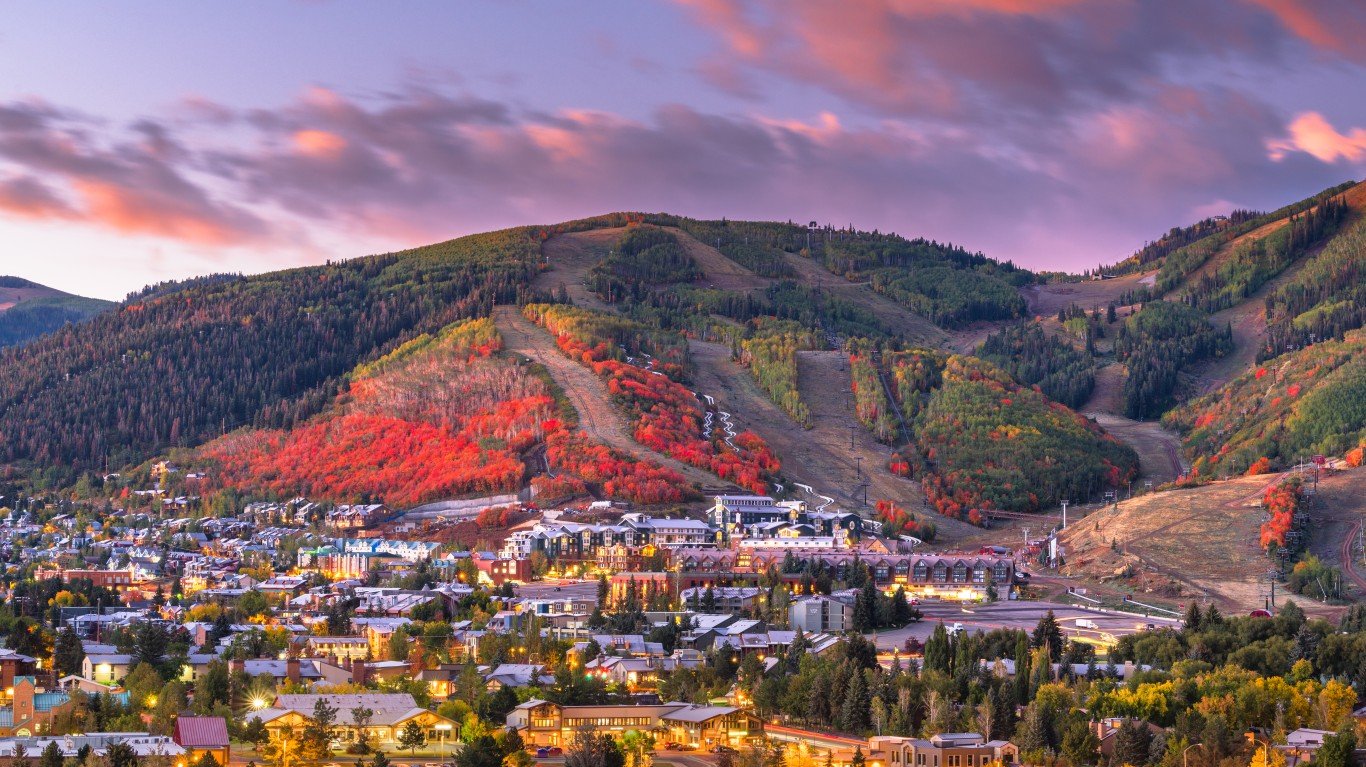
Utah
> Most unusual ancestry: Tongan
> Concentration of UT residents with Tongan ancestry: 29.2 times higher than share of U.S. population
> Share of UT residents identifying as having Tongan ancestry: 0.35% (Total: 11,339)
> Share of U.S. pop. identifying as having Tongan ancestry: 0.01% (total: 39,622)
> Share of all U.S. residents identifying as having Tongan ancestry living in UT: 28.62%
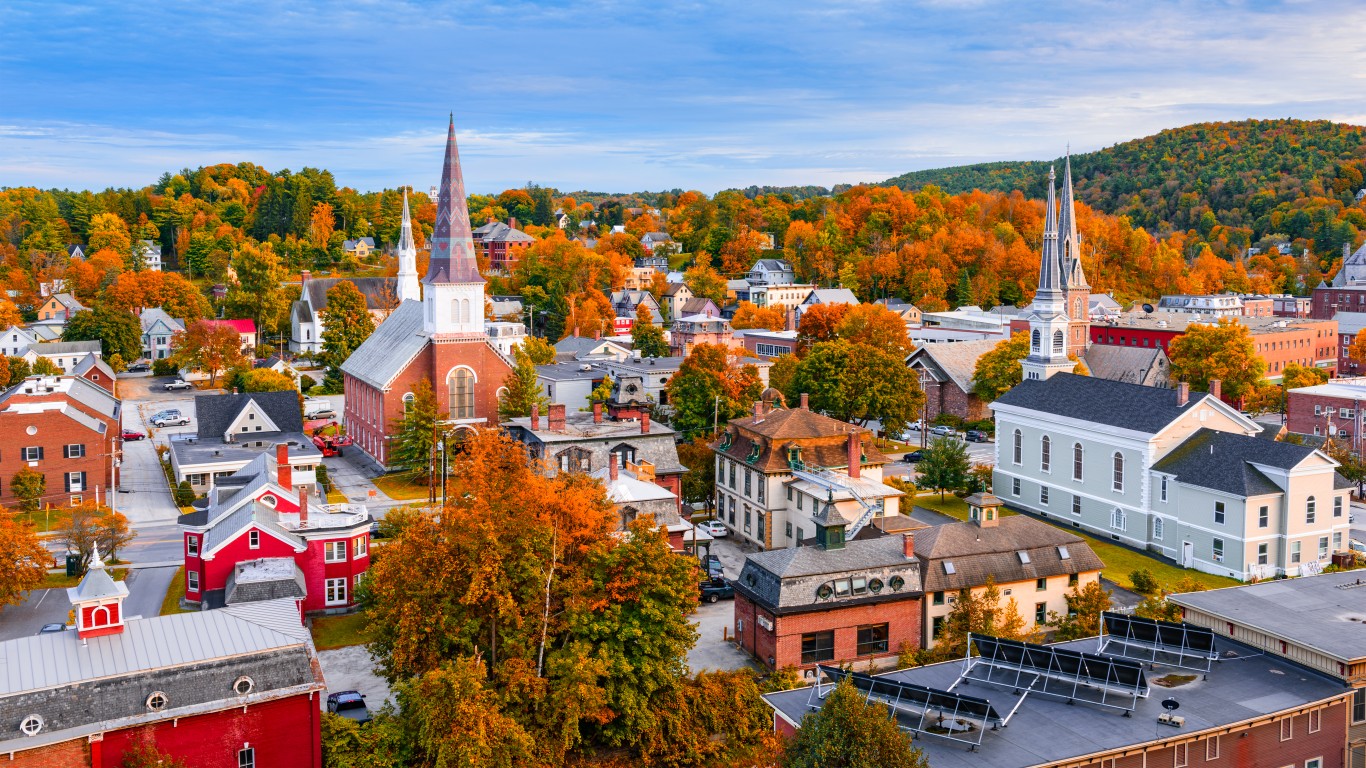
Vermont
> Most unusual ancestry: French Canadian
> Concentration of VT residents with French Canadian ancestry: 14.5 times higher than share of U.S. population
> Share of VT residents identifying as having French Canadian ancestry: 5.89% (Total: 37,761)
> Share of U.S. pop. identifying as having French Canadian ancestry: 0.41% (total: 1,340,208)
> Share of all U.S. residents identifying as having French Canadian ancestry living in VT: 2.82%
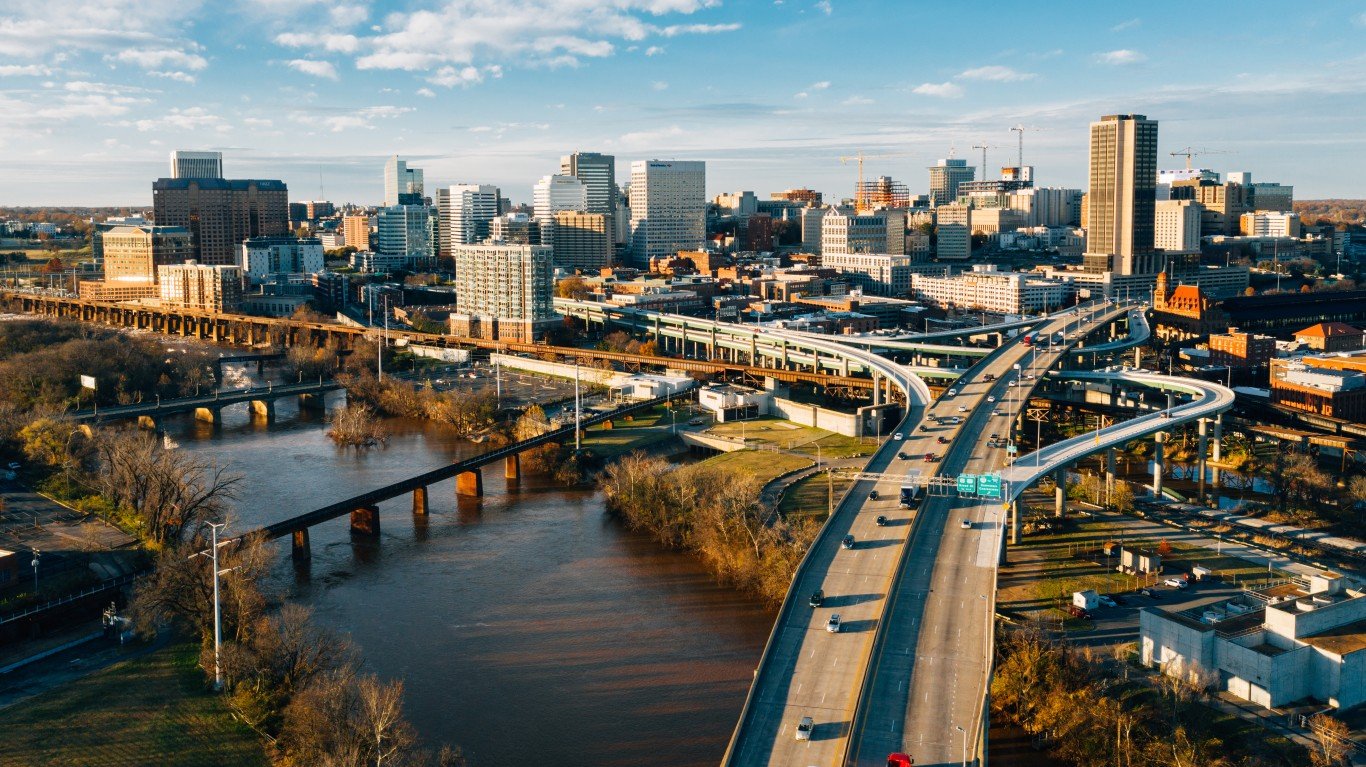
Virginia
> Most unusual ancestry: Bolivian
> Concentration of VA residents with Bolivian ancestry: 12.2 times higher than share of U.S. population
> Share of VA residents identifying as having Bolivian ancestry: 0.30% (Total: 25,952)
> Share of U.S. pop. identifying as having Bolivian ancestry: 0.02% (total: 81,895)
> Share of all U.S. residents identifying as having Bolivian ancestry living in VA: 31.69%
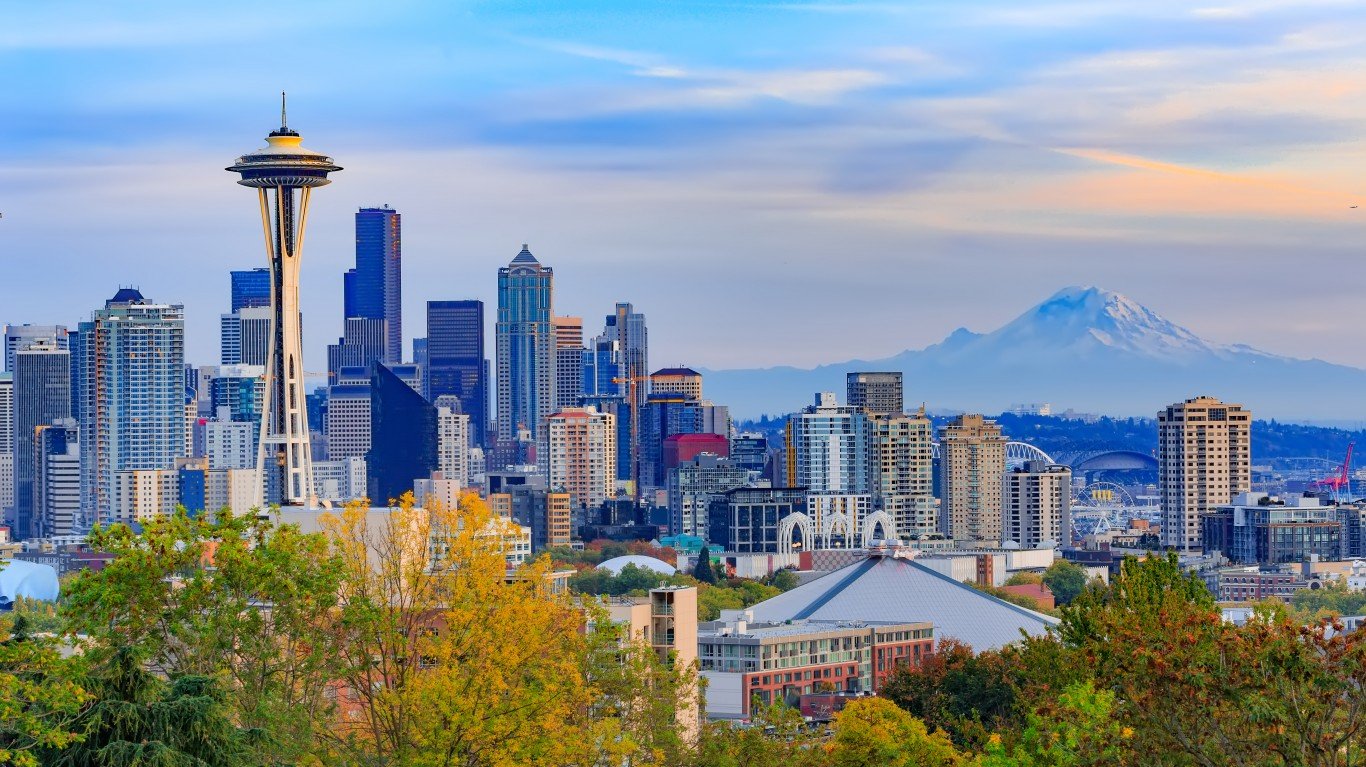
Washington
> Most unusual ancestry: Gambian
> Concentration of WA residents with Gambian ancestry: 9.1 times higher than share of U.S. population
> Share of WA residents identifying as having Gambian ancestry: 0.04% (Total: 3,032)
> Share of U.S. pop. identifying as having Gambian ancestry: 0.00% (total: 14,464)
> Share of all U.S. residents identifying as having Gambian ancestry living in WA: 20.96%
West Virginia
> Most unusual ancestry: Indian
> Concentration of WV residents with Indian ancestry: 5.6 times higher than share of U.S. population
> Share of WV residents identifying as having Indian ancestry: 0.82% (Total: 14,792)
> Share of U.S. pop. identifying as having Indian ancestry: 0.15% (total: 479,351)
> Share of all U.S. residents identifying as having Indian ancestry living in WV: 3.09%
Wisconsin
> Most unusual ancestry: Hmong
> Concentration of WI residents with Hmong ancestry: 10.3 times higher than share of U.S. population
> Share of WI residents identifying as having Hmong ancestry: 0.81% (Total: 47,311)
> Share of U.S. pop. identifying as having Hmong ancestry: 0.08% (total: 259,055)
> Share of all U.S. residents identifying as having Hmong ancestry living in WI: 18.26%
Wyoming
> Most unusual ancestry: Spanish American
> Concentration of WY residents with Spanish American ancestry: 9.9 times higher than share of U.S. population
> Share of WY residents identifying as having Spanish American ancestry: 0.17% (Total: 962)
> Share of U.S. pop. identifying as having Spanish American ancestry: 0.02% (total: 55,516)
> Share of all U.S. residents identifying as having Spanish American ancestry living in WY: 1.73%
Methodology
To determine the most unusual ancestry in each state, 24/7 Tempo reviewed data on ancestry from the U.S. Census Bureau’s American Community Survey. Over 200 ancestries were ranked within each state based on location quotient, taking the largest ratio relative to the U.S. average. For example, if 20% of a state population is Scotch-Irish, and the Scotch-Irish comprise 10% of the U.S. population, then the location quotient for Scotch-Irish in that state is 2.0. If 2.0 is the highest location quotient of any ancestry in the state, that would be considered the most unusual ancestry in that state. Only ancestry groupings with a population of at least 750 residents in a given state were considered.
Data on ancestry is from the 2021 American Community Survey and are five-year estimates. Survey respondents write in their ancestry based on the question “What is this person’s ancestry or ethnic origin?” The Census Bureau provides a dataset of 235 ancestral categories based on these responses.
Note that one state’s principal ancestry is identified as “American” and another’s as “Appalachian.” Note also that the term “Eskimo” is often considered pejorative (“Inuit” is generally preferred), but the Census Bureau continues to use it.