
The widely debated congestion pricing plan for New York has been indefinitely postponed this week. Major cities all across the U.S. are facing the issue of tackling congested roads and the pollution they cause. Whilst the growth of cities is seen as a good thing, it does bring challenges but this is nothing new. If we look back at the history of U.S. cities we see a picture of population growth and sometimes of population decline as people decide to live elsewhere. All nations see these patterns but as a new nation, the U.S has seen more than its fair share since it was founded in 1776.
For example, whilst the Eastern Seaboard cities (such as New York) grew initially thanks to immigration from Europe, industry was later behind the population increases around the Great Lakes region (such as Detroit) and the Midwest in the 19th century. Suburban America was created in part by the interstate highway system and there has been a gradual shift to the west. Living in a city is not always the healthiest option and here we list the U.S. cities with the worst life expectancy.
To examine how the populations of America’s largest cities have changed over the decades, 24/7 Tempo has reviewed data from the U.S. Census Bureau so that you can identify what cities were the most populous the decade you were born.
1920s
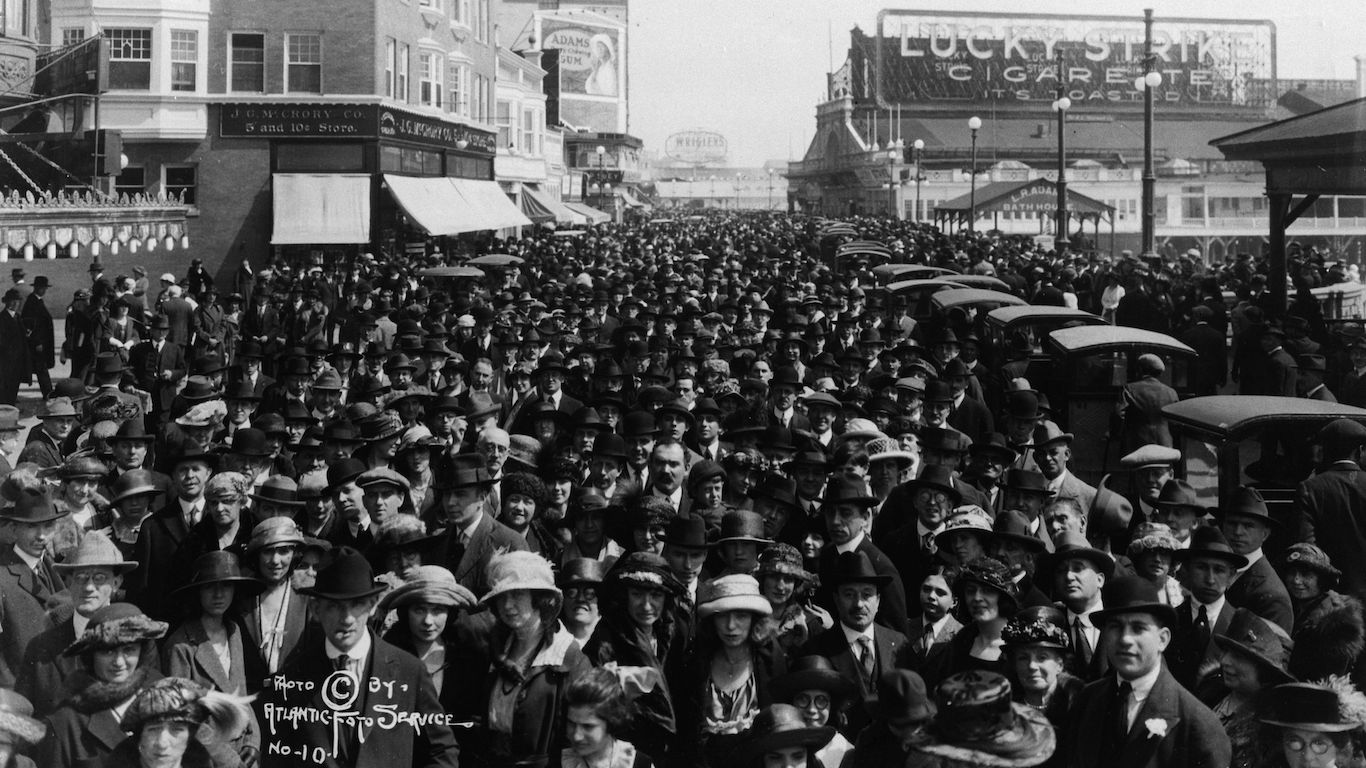
- United States population: 106,021,537
- New York: 5,620,048
- Chicago: 2,701,705
- Philadelphia: 1,823,779
- Detroit: 993,078
- Cleveland: 796,841
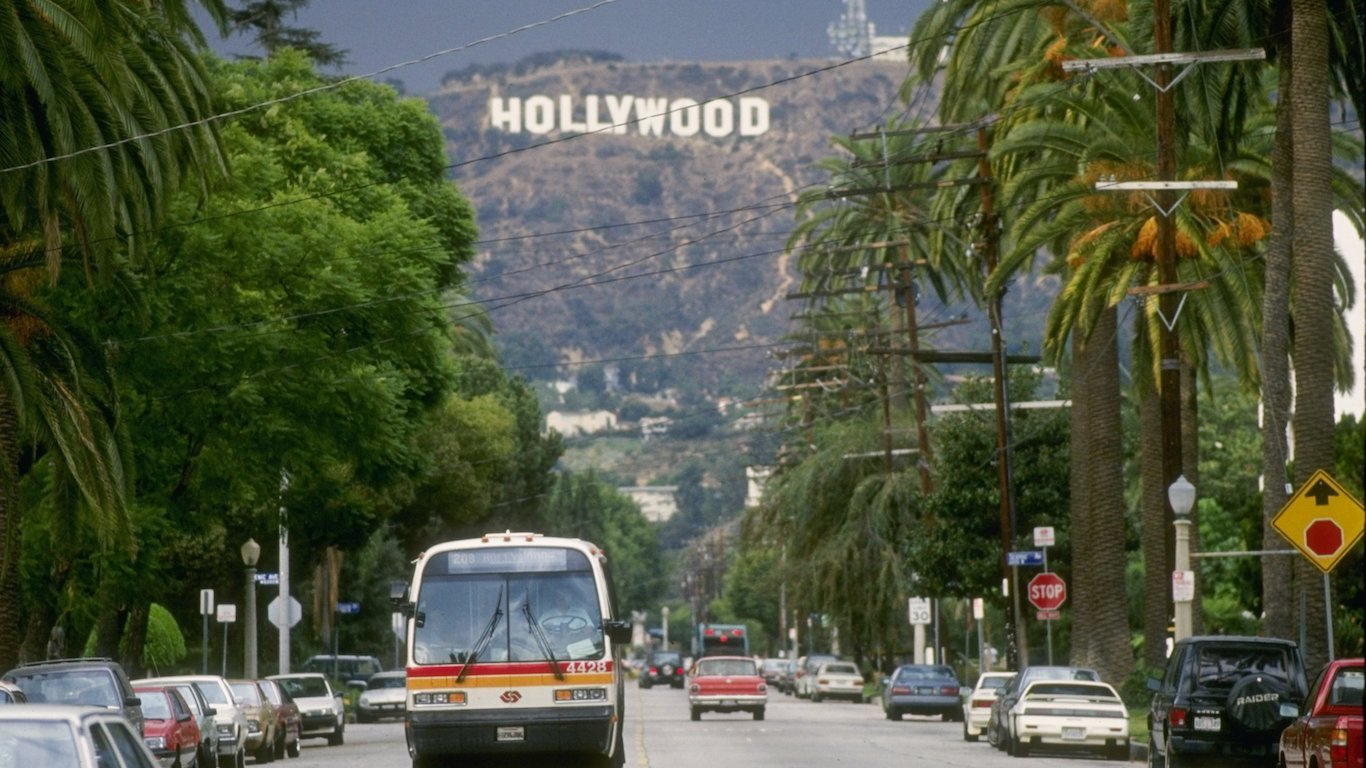
The 1920s census saw Los Angeles move into the 10 most populated cities in the US for the first time. This was also the only census where Cleveland was ranked amongst the five largest American cities. Detroit also saw marked growth between 1910 and 1920. It’s population doubled in 10 years mainly thanks to the car industry.
1930s
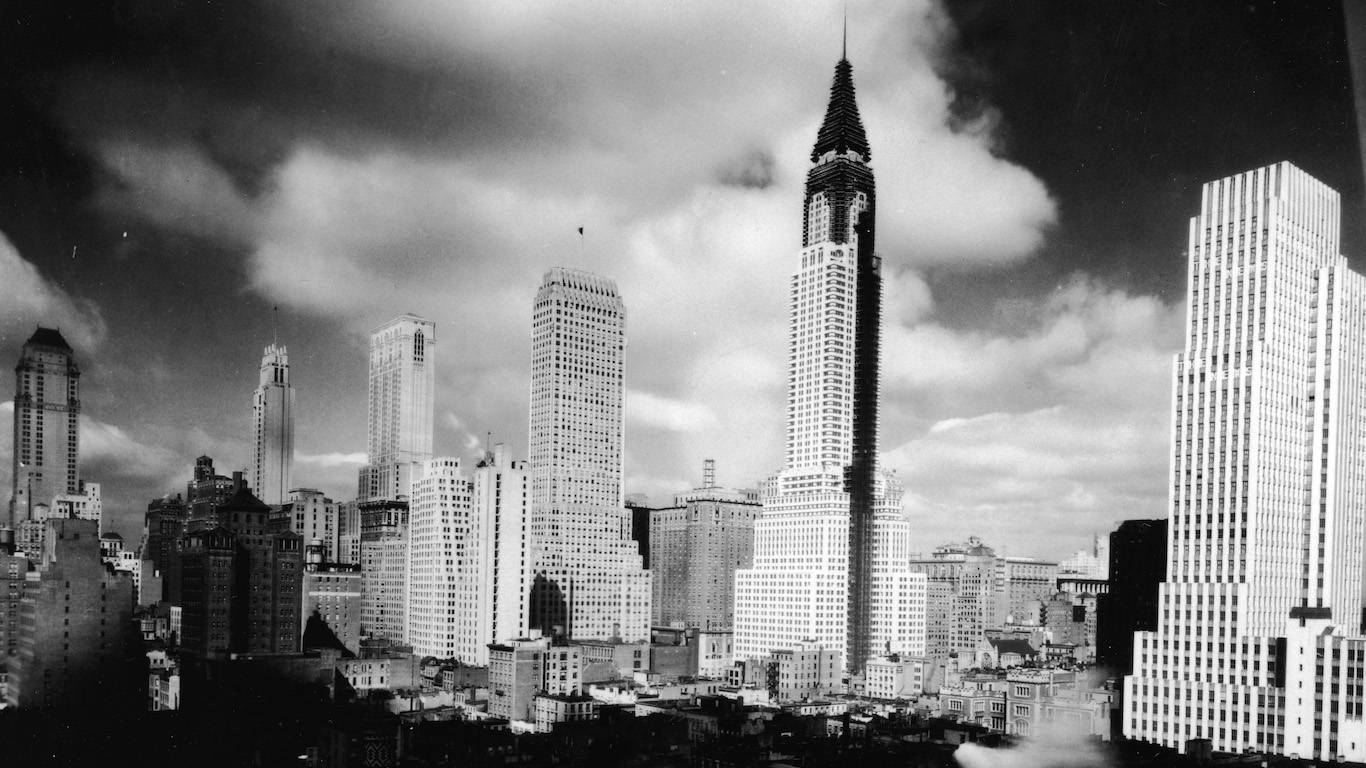
- United States population: 123,202,624
- New York: 6,930,446
- Chicago: 3,376,438
- Philadelphia: 1,950,961
- Detroit: 1,568,662
- Los Angeles:1,238,048
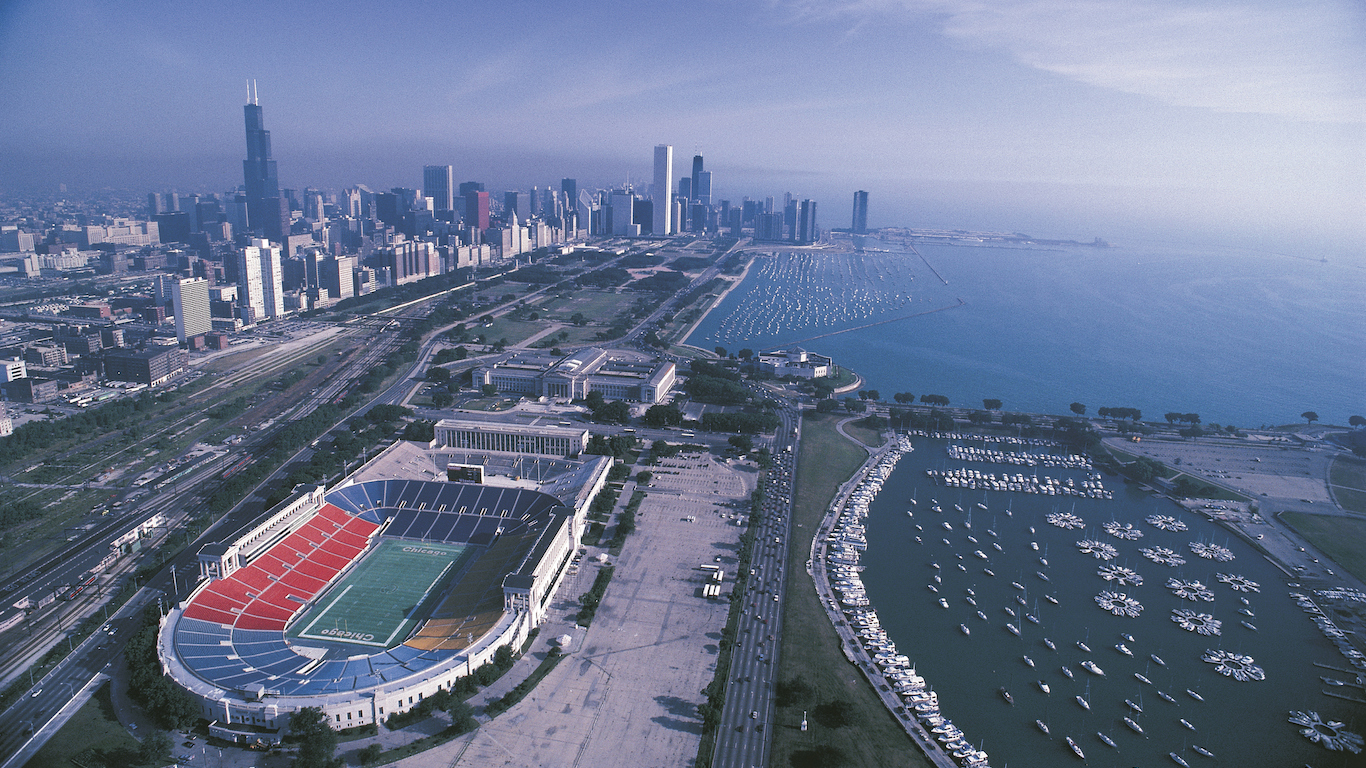
By 1930, the expansion of Los Angeles had continued, helped in a large part by the film industry. It became the first West Coast city to be ranked in the top five largest cities and it’s population topped 1 million. Meanwhile, Chicago was also growing rapidly thanks to mail order companies such as Sears Roebuck and Montgomery Ward. New York City was now the largest city in the world and would hold that title for another 50 years. Second in line was Chicago which had fully recovered from a devastating fire 60 years previously and now had a population of over 3 million.
1940s

- United States population: 132,164,569
- New York: 7,454,995
- Chicago: 3,396,808
- Philadelphia: 1,931,334
- Detroit: 1,623,452
- Cleveland: 878,336
Despite the severity of the 1930s depression, the population of New York and Chicago had risen again by 1940. Other cities did not fair so well. The cities of Philadelphia, St. Louis, Cleveland, and Boston were suffering from reducing populations.
1950s
- United States population: 151,325,798
- New York: 7,891,957
- Chicago: 3,620,962
- Philadelphia: 2,071,605
- Los Angeles: 1,970,358
- Detroit: 1,849,568
The years immediately following World War II were the baby boomer years and that is exactly what happened! Many US cities saw rapid increases in populations. The US population was also on the move with areas in the west of the country seeing the greatest increases. Washington DC made its first ever appearance in the top 10 populated cities thanks to the increase in government administration centers at that time.
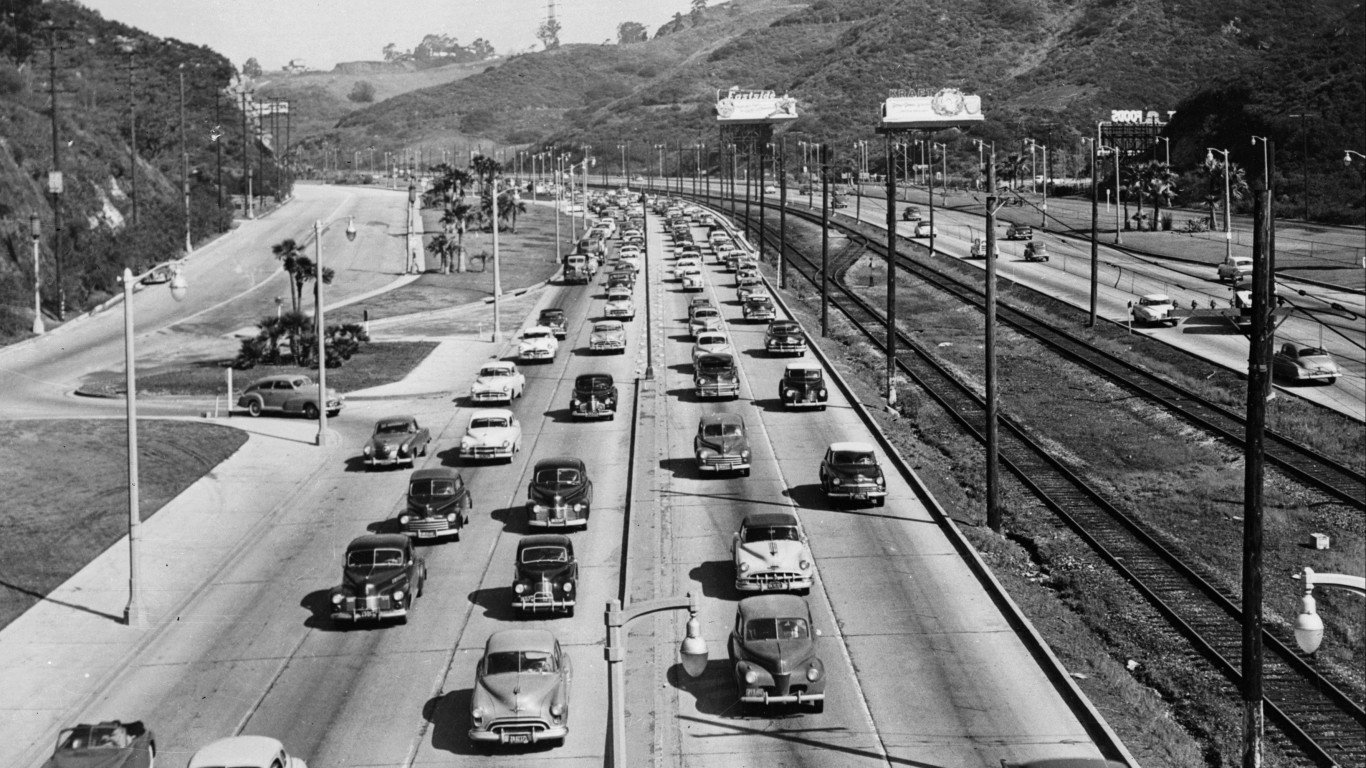
1960s

- United States population: 179,323,175
- New York: 7,781,984
- Chicago: 3,550,404
- Los Angeles: 2,479,015
- Philadelphia: 2,002,512
- Detroit: 1,670,144
The swinging 60s saw the creation of interstate highways, allowing people to move out of the cities yet still access their workplaces. Suburban America had been born! This largely explains the declining populations of some of the country’s cities, including New York City, Detroit, Washington, Chicago, and Baltimore. In contrast, other cities, such as Houston, were being boosted by the oil industry.
1970s
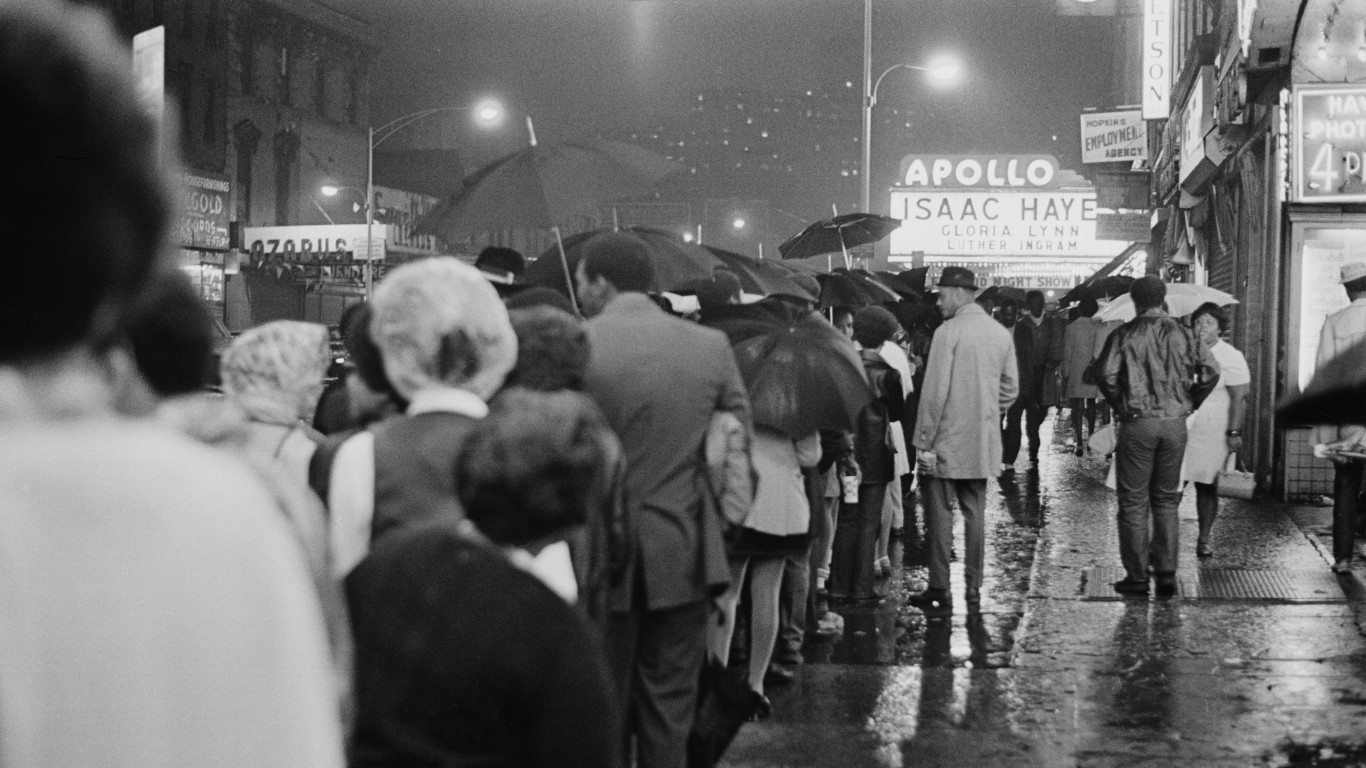
- United States population:203,302,031
- New York: 7,894,862
- Chicago: 3,366,957
- Los Angeles: 2,816,061
- Philadelphia: 1,948,609
- Detroit: 1,511,482
The 1970s census reflected population movements during the 1960s and the effect that riots had had on many American cities. For example, Los Angeles and Detroit were losing population. Texas, meanwhile, was still on the rise, and Dallas became the second Texas city to rank in the top 10. This would be the last time that Cleveland and Washington DC would be ranked in the top 10 populated U.S. cities.
1980s

- United States population: 226,542,199
- New York: 7,071,639
- Chicago: 3,005,072
- Los Angeles:2,966,850
- Philadelphia: 1,688,210
- Houston: 1,595,138
By 1980, the population of New York City had fallen greater than in any other 10 year span. It lost 823,000 people in a decade. A combination of financial difficulties, drug issues, and crime were driving the population elsewhere. In contrast, the Sun Belt was benefiting and San Diego and Phoenix arrived in the top 10 most popular cities. This census was also the last time that Baltimore was ranked in the top 10.
1990s
- United States population: 248,709,873
- New York: 7,322,564
- Los Angeles: 3,485,398
- Chicago: 2,783,726
- Houston: 1,630,553
- Philadelphia: 1,585,577
By the 1990s, the 10 most popular cities in the US were all in the western portion of the Sun Belt. This was the first time that this had occurred in US history. At the same time, Los Angeles overtook Chicago and became the second largest American city. Texas cities continued to grow with Houston, Dallas, and San Antonio, all in the top 10.
2000s
- United States population: 281,421,906
- New York: 8,008,278
- Los Angeles: 3,694,820
- Chicago: 2,896,016
- Houston: 1,953,631
- Philadelphia: 1,517,550
The technological revolution of the 2000s saw another shift in population. New York City topped 8 million for the first time whereas Detroit saw its population fall to below 1 million thanks to the decline in the car industry. Cities with vibrant tech industries were seeing the greatest growth. Meanwhile, the Arizona capital, Phoenix, was the only state capital with more than 1 million people.
2010s

- United States population: 307,745,538
- New York: 8,175,133
- Los Angeles: 3,792,621
- Chicago: 2,695,598
- Houston: 2,099,451
- Philadelphia: 1,526,006
The most recent census has seen Philadelphia gain population. This is the first time that this has happened since 1950. The rise is attributed to a combination of birth rate and increased immigration. Seven of the most populated cities were located in the Sun Belt region.