The oldest chain operation in the world, still going strong (as anyone who’s ever been in an airport can attest), is WHSmith. It began as a newsstand in London in 1792. Over the next several generations, it developed into a national and eventually international chain of stores selling not only magazines and newspapers but also books, toys, souvenirs, food items, and more.
The first restaurant chain also came out of the U.K., and was either (depending on your definition of “restaurant”) the ABC chain of tea shops, which launched in 1864, or a fish and chips shop opened in 1896 that quickly grew into a 20-plus unit operation around England.
Today there are hundreds of chains in the U.S. alone (many of which also have a presence abroad), and the multi-industry research and data site IBISWorld estimates that there are over 137,000 individual locations of these various enterprises around the country.
The giants in the field include McDonald’s (No. 1 in U.S. system-wide sales) and Subway (which has the most locations), as well as familiar names such as Starbucks, Chick-fil-A, Taco Bell, Wendy’s, Dunkin’, Burger King, Chipotle, and so on. And that’s just fast food; many more formal sit-down concepts count as chains too, though they may not have the numbers. (These are the most iconic menu items at your favorite fast food chains.)
Which chains do consumers like the most? In January, Nation’s Restaurant News published “America’s 10 Favorite Restaurant Chains,” based on a study conducted by the food industry research and consulting company Technomic’s Ignite Consumer data resource. The study polled 112,000 representative adult consumers, asking them to score chains according to five key metrics, then computed an overall score to rank them.
Perhaps surprisingly (or perhaps not), none of the major fast-food chains made it into the top 10. Instead, there’s a range of establishments, some better known than others, including everything from purveyors of smoothies to high-end steakhouses — and the only coffee shop on the list is an Oregon-based drive-thru chain.
Interestingly, the chain with the highest score for food and beverage, by far, is the Caribbean-themed Bahama Breeze — and it only comes in at No. 5, suggesting that what consumers eat and drink isn’t the most important thing about chains for those who patronize them.
10. Smoothie King
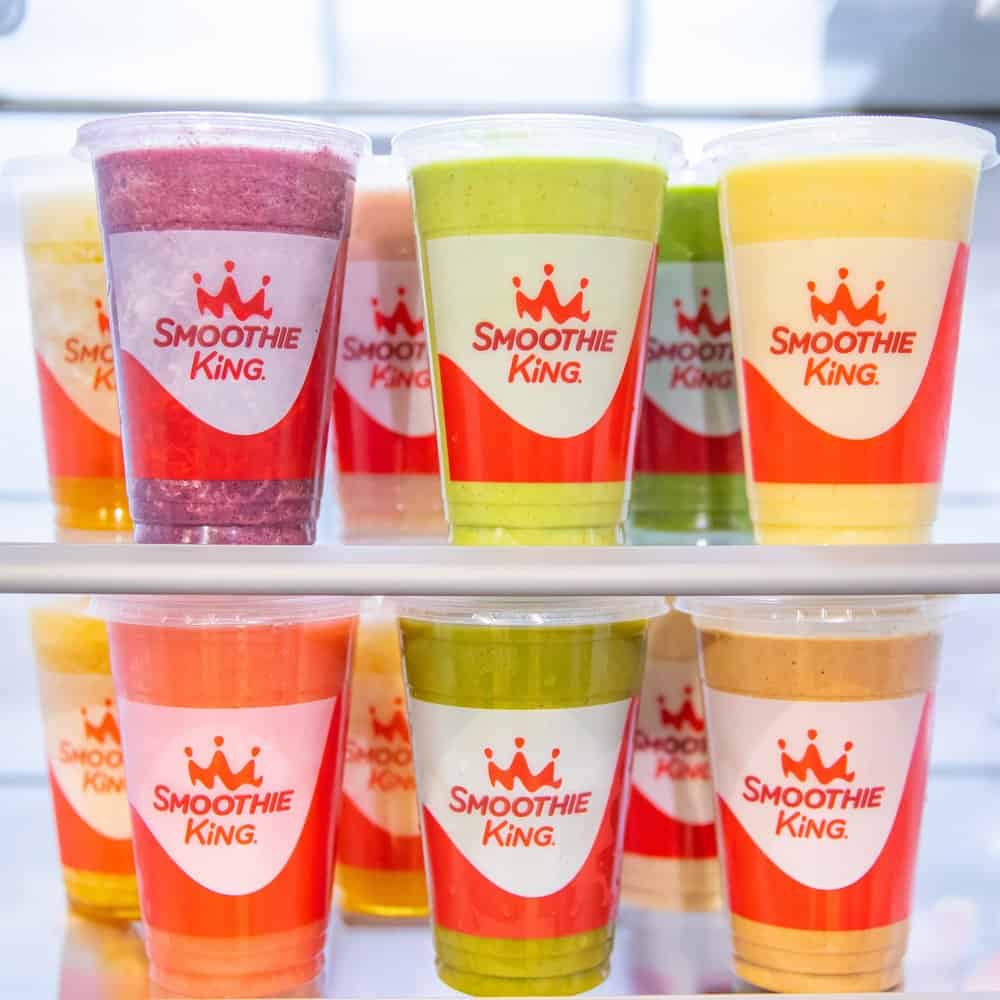
- Service & hospitality: 63.50%
- Unit appearance & ambiance: 50.20%
- Food & beverage: 59.80%
- Convenience & takeout: 63.20%
- Value: 48.50%
- Overall score: 57.00%
9. The Capital Grille
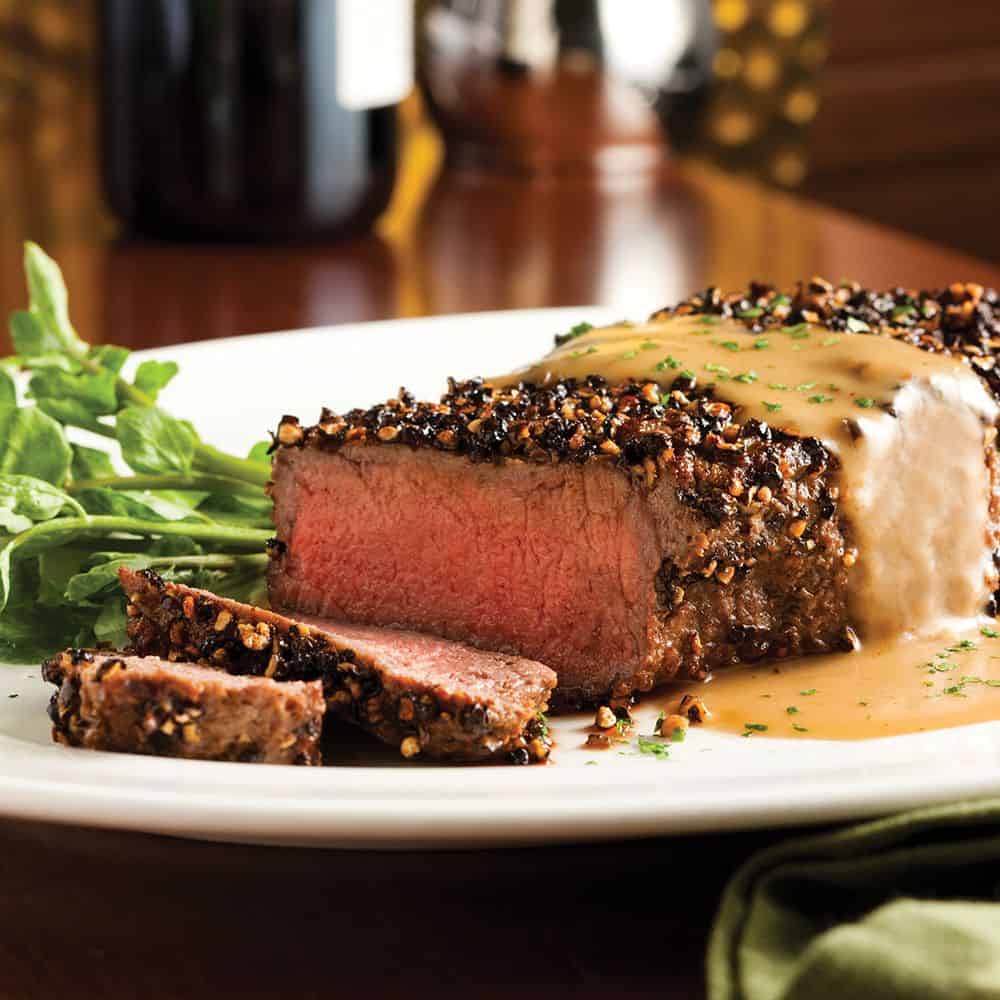
- Service & hospitality: 66.00%
- Unit appearance & ambiance: 58.60%
- Food & beverage: 56.00%
- Convenience & takeout: 57.40%
- Value: 53.40%
- Overall score: 57.40%
8. Tropical Smoothie Cafe
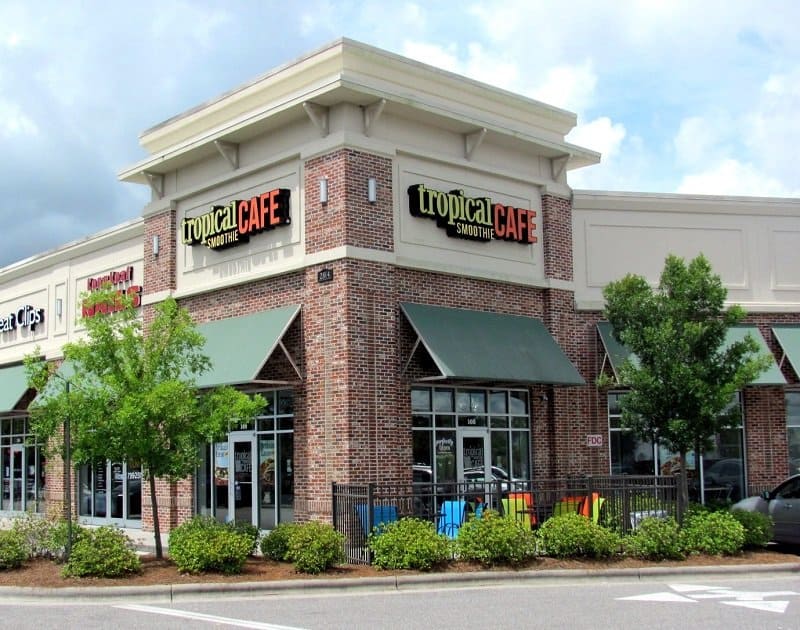
- Service & hospitality: 63.90%
- Unit appearance & ambiance: 51.10%
- Food & beverage: 61.40%
- Convenience & takeout: 62.40%
- Value: 49.00%
- Overall score: 57.70%
7. (tie) Cooper’s Hawk
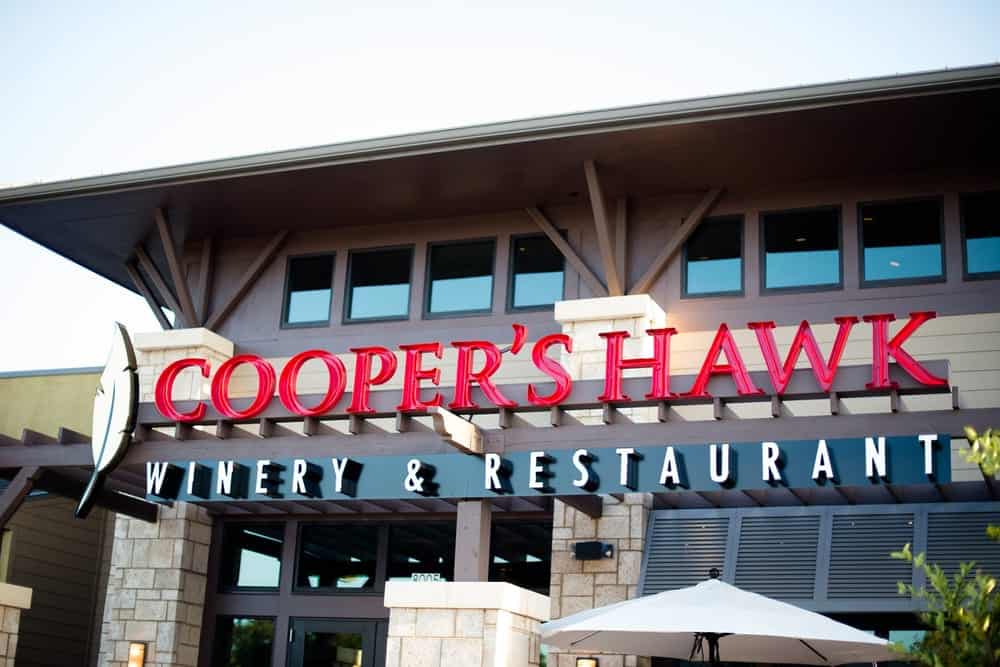
- Service & hospitality: 67.20%
- Unit appearance & ambiance: 61.10%
- Food & beverage: 57.60%
- Convenience & takeout: 57.10%
- Value: 50.90%
- Overall score: 58.40%
6. (tie) Longhorn Steakhouse
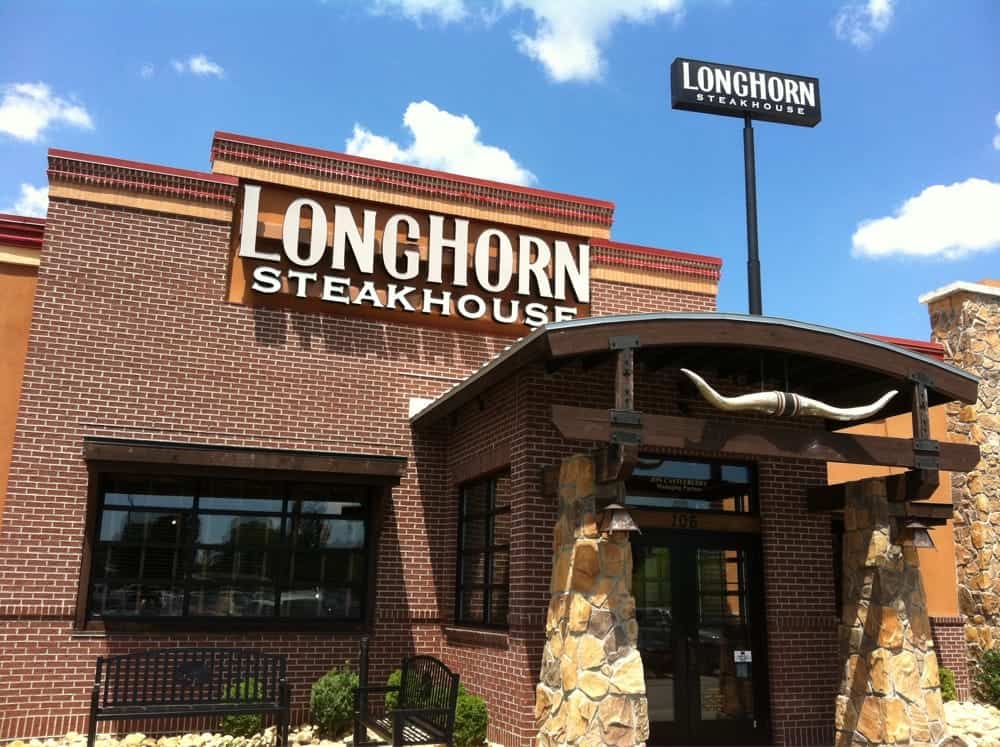
- Service & hospitality: 68.20%
- Unit appearance & ambiance: 58.70%
- Food & beverage: 59.30%
- Convenience & takeout: 58.20%
- Value: 48.40%
- Overall score: 58.40%
5. Bahama Breeze
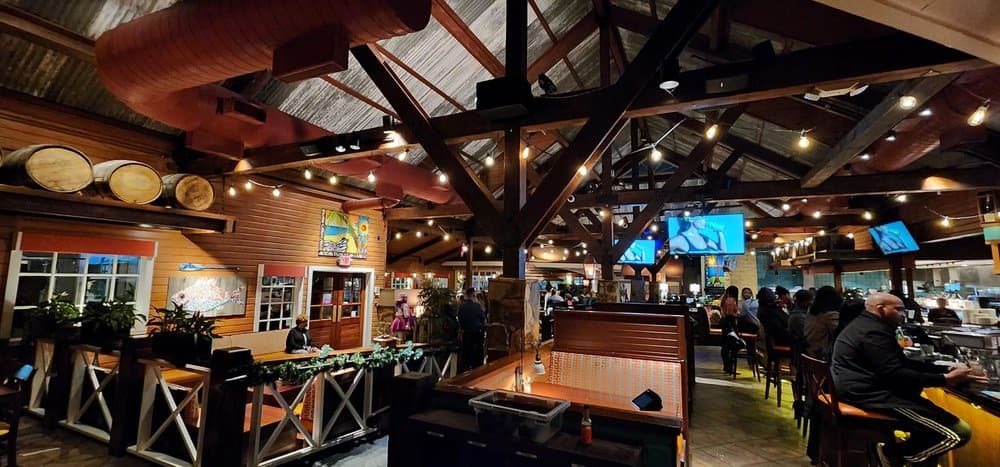
- Service & hospitality: 66.80%
- Unit appearance & ambiance: 59.20%
- Food & beverage: 85.20%
- Convenience & takeout: 59.50%
- Value: 52.90%
- Overall score: 58.70%
4. Fleming’s Prime Steakhouse
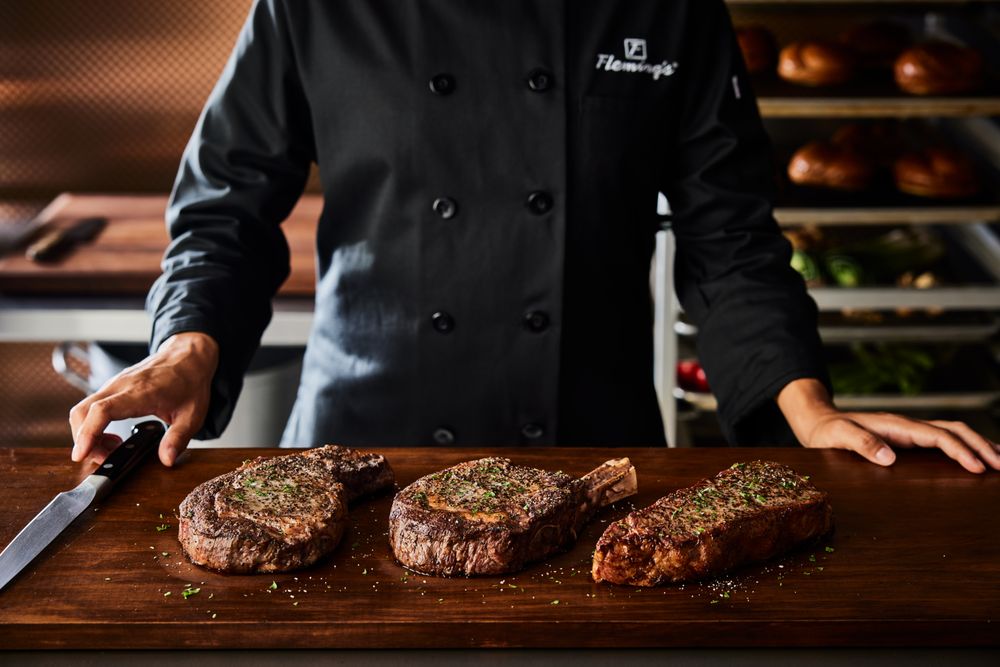
- Service & hospitality: 68.00%
- Unit appearance & ambiance: 59.80%
- Food & beverage: 57.80%
- Convenience & takeout: 57.90%
- Value: 53.80%
- Overall score: 58.70%
3. Dutch Bros
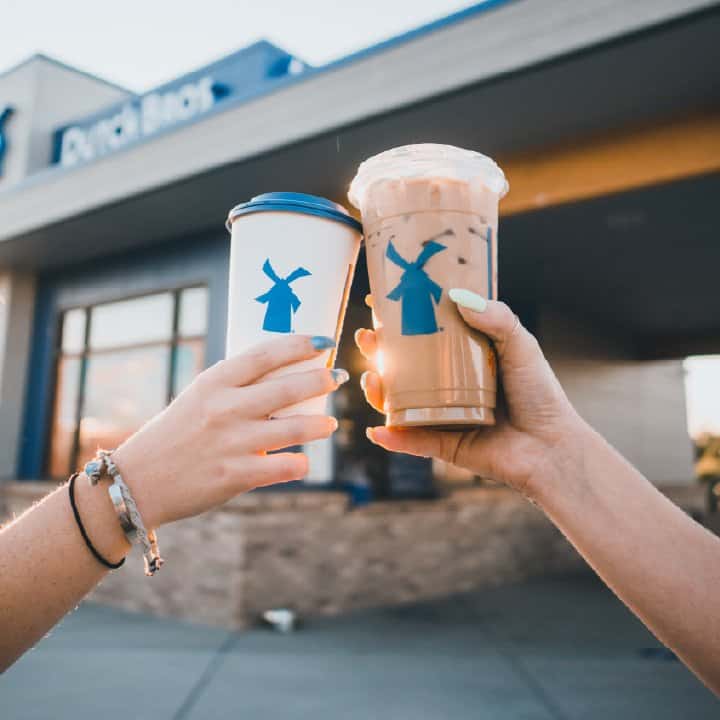
- Service & hospitality: 75.40%
- Unit appearance & ambiance: 54.20%
- Food & beverage: 58.70%
- Convenience & takeout: 67.50%
- Value: 55.90%
- Overall score: 60.30%
2. Seasons 52
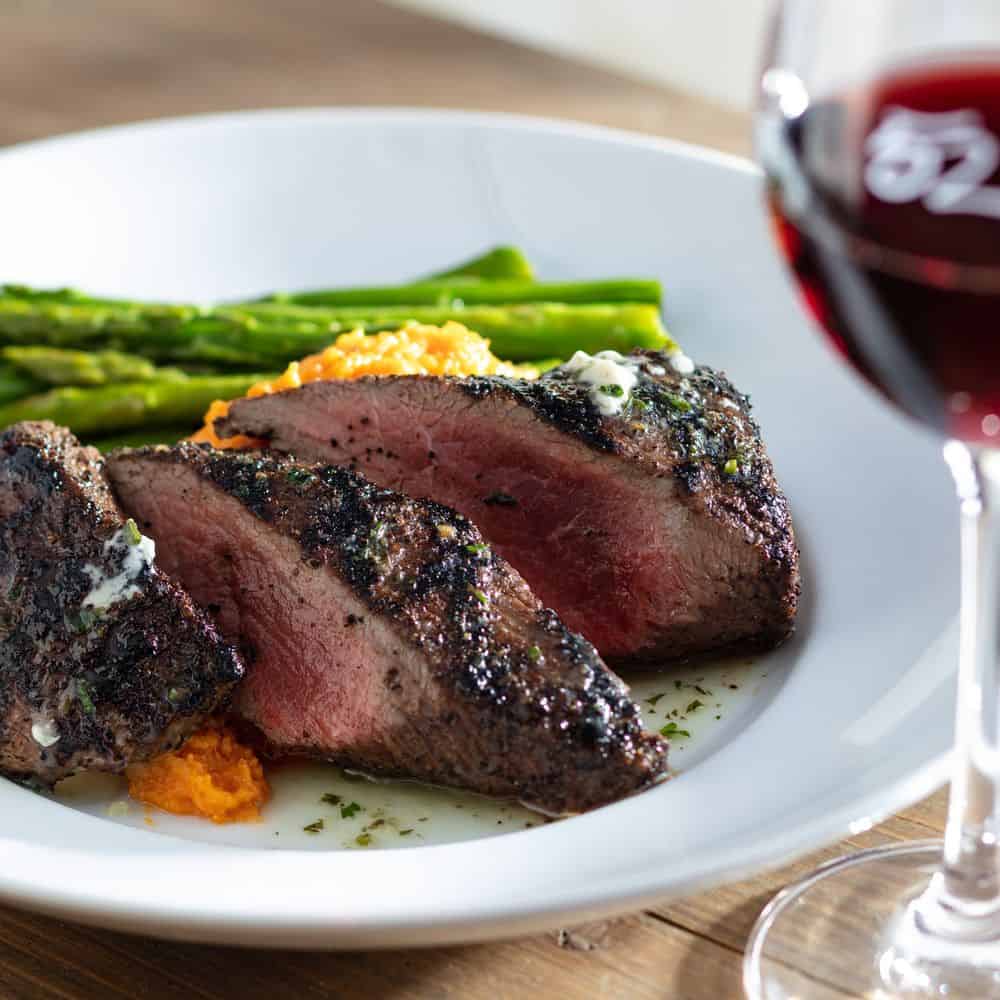
- Service & hospitality: 70.30%
- Unit appearance & ambiance: 63.90%
- Food & beverage: 59.30%
- Convenience & takeout: 60.80%
- Value: 51.70%
- Overall score: 60.40%
1. Ruth’s Chris Steak House
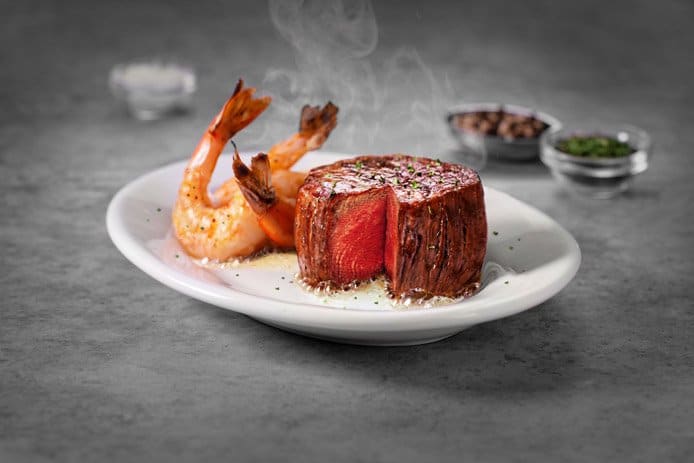
- Service & hospitality: 76.90%
- Unit appearance & ambiance: 67.40%
- Food & beverage: 64.10%
- Convenience & takeout: 63.10%
- Value: 54.80%
- Overall score: 64.80%