
Along with Christmastime, the four-day Thanksgiving weekend is always the busiest travel period of the year, with many people flying home or to some mutually agreed-upon family gathering place. Unfortunately, because winter weather is setting in across much of the country by the latter part of November, and because holiday crowds clog airport roadways, security checkpoints, and boarding lanes, delays are inevitable.
Delays are one thing. Savvy travelers build in extra time to get to their destination, and supply themselves with diversions in case they’re forced to sit for hours by the gate. A much bigger problem is flight cancellation. Airlines are sometimes forced to take a scheduled flight off the board because of security issues, a shortage of equipment (due to mechanical issues or bad weather in other locations), or a shortage of crew or ground staff due to illness, fatigue management protocols, or unforeseen events.
More than one holiday get-together has been ruined when key family members simply can’t get to where they’re going in time for the festivities. There’s really not much a traveler can do to stave off this occasional misfortune, other than building not just extra hours but an extra day or two into the travel schedule.
While most of us don’t have much choice when it comes to airports, it might be useful to know which ones tend to see the most flight cancellations. To determine the 10 U.S. airports that have repeatedly had the highest Percentage of flights canceled, Jan.-June, 2023 so far this year – a good if not unerring predictor of those that will be most problematic over Thanksgiving – 24/7 Tempo consulted a study compiled by insuremytrip, a travel insurance comparison site.
The site analyzed the latest flight cancellation data for the first half of 2023 gathered by the U.S. Department of Transportation’s Bureau of Transportation Statistics. The rankings cover the country’s 75 busiest airports based on flight arrivals.
Perhaps not surprisingly, the four airports logging the most cancellations are in the busy, climatologically active Northeast – three serving the New York City metropolitan area and one in Buffalo. The worst record of all belonged to New Jersey’s Newark Liberty International Airport, at 3.78%. (Last year, Buffalo had that honor, with a cancellation rate of 5.5%.)
Norfolk International Airport in Virginia is trending in the wrong direction. For the first quarter of this year, it boasted one of the nation’s lowest cancellation rates, at 0.90% – but it soared up to 2.51% through the end of Q2, earning it fifth place on this list. (For customer satisfaction and other factors, these are America’s 26 worst airports.)

10. Milwaukee Mitchell International Airport
> Location: Milwaukee, Wi
> Airport code: MKE
> Percentage of flights canceled, Jan.-June, 2023: 2.27%
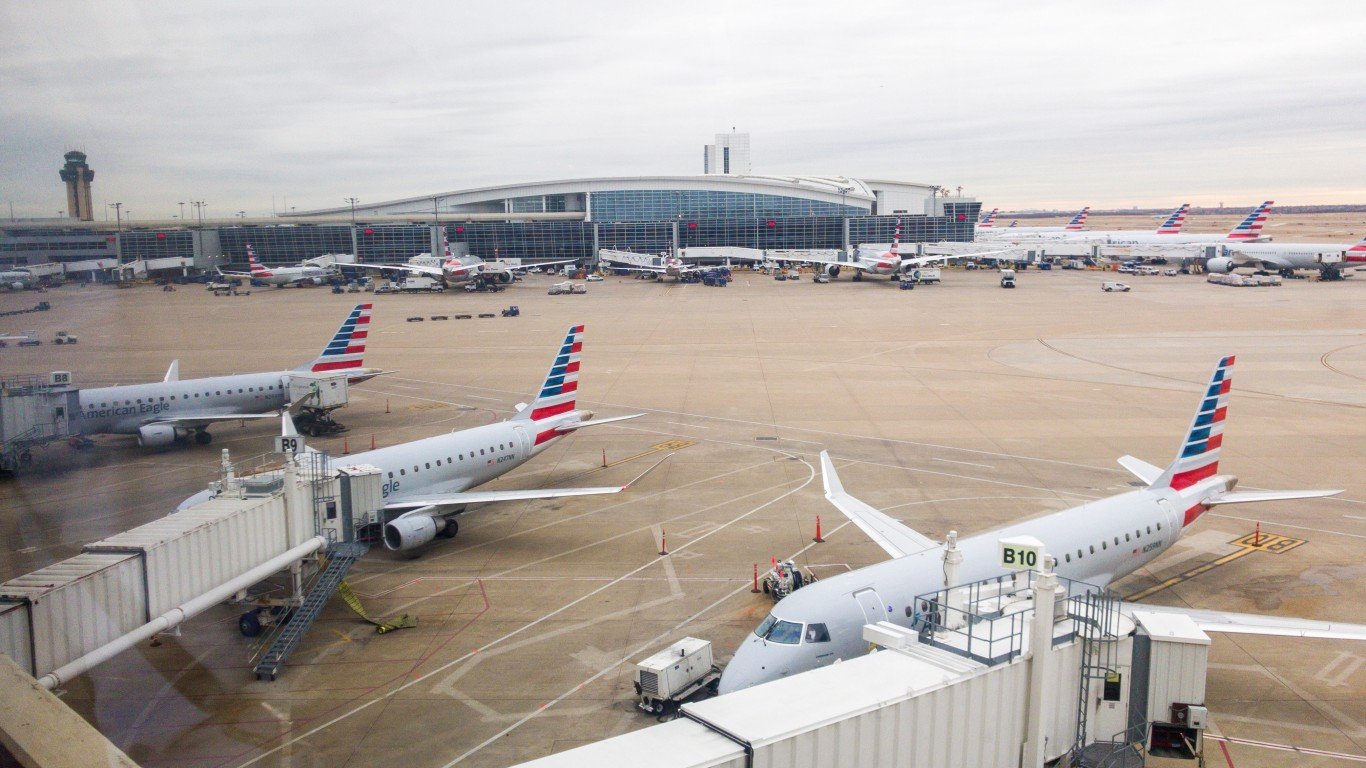
9. Dallas Fort Worth International Airport
> Location: Dallas/Fort Worth, TX
> Airport code: DFW
> Percentage of flights canceled, Jan.-June, 2023: 2.29%
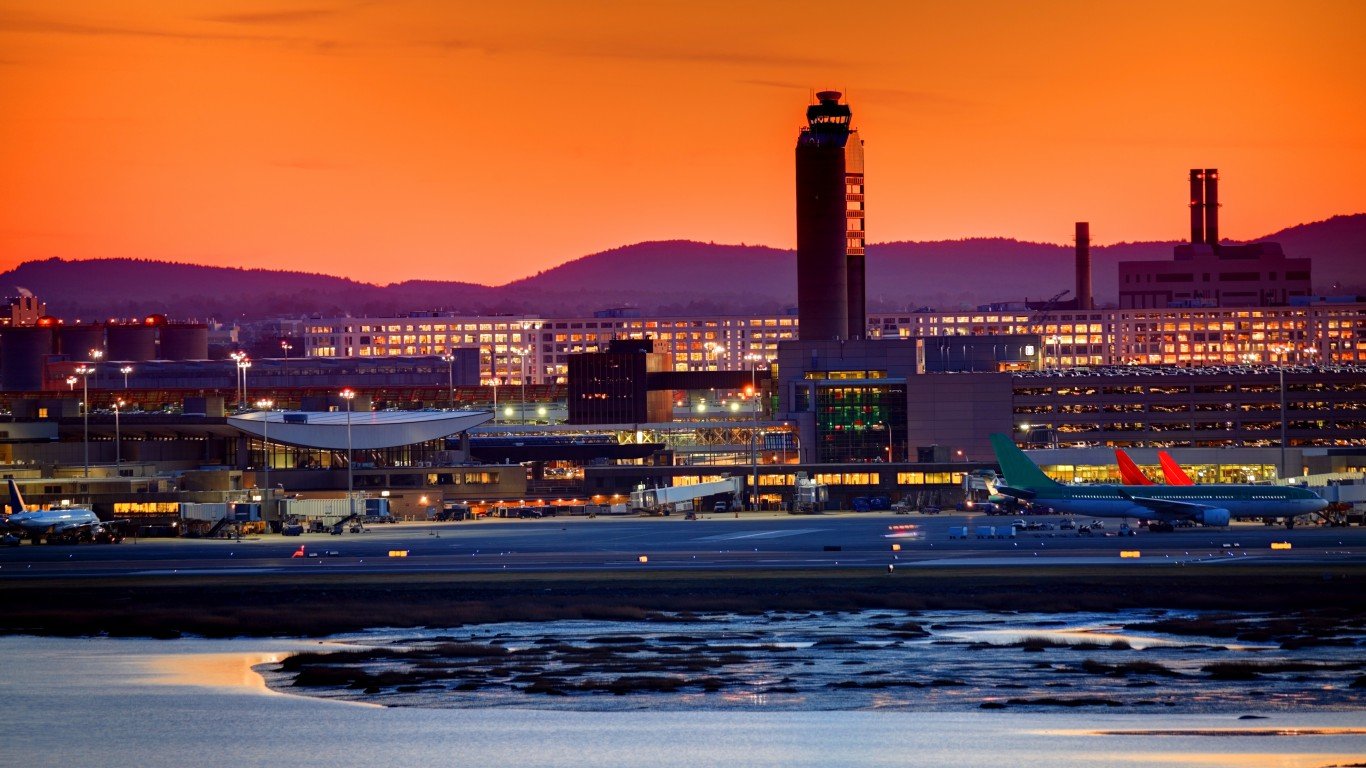
8. Boston Logan International Airport
> Location: Boston, MA
> Airport code: BOS
> Percentage of flights canceled, Jan.-June, 2023: 2.31%

7. Dallas Love Field
> Location: Dallas, TX
> Airport code: DAL
> Percentage of flights canceled, Jan.-June, 2023: 2.38%
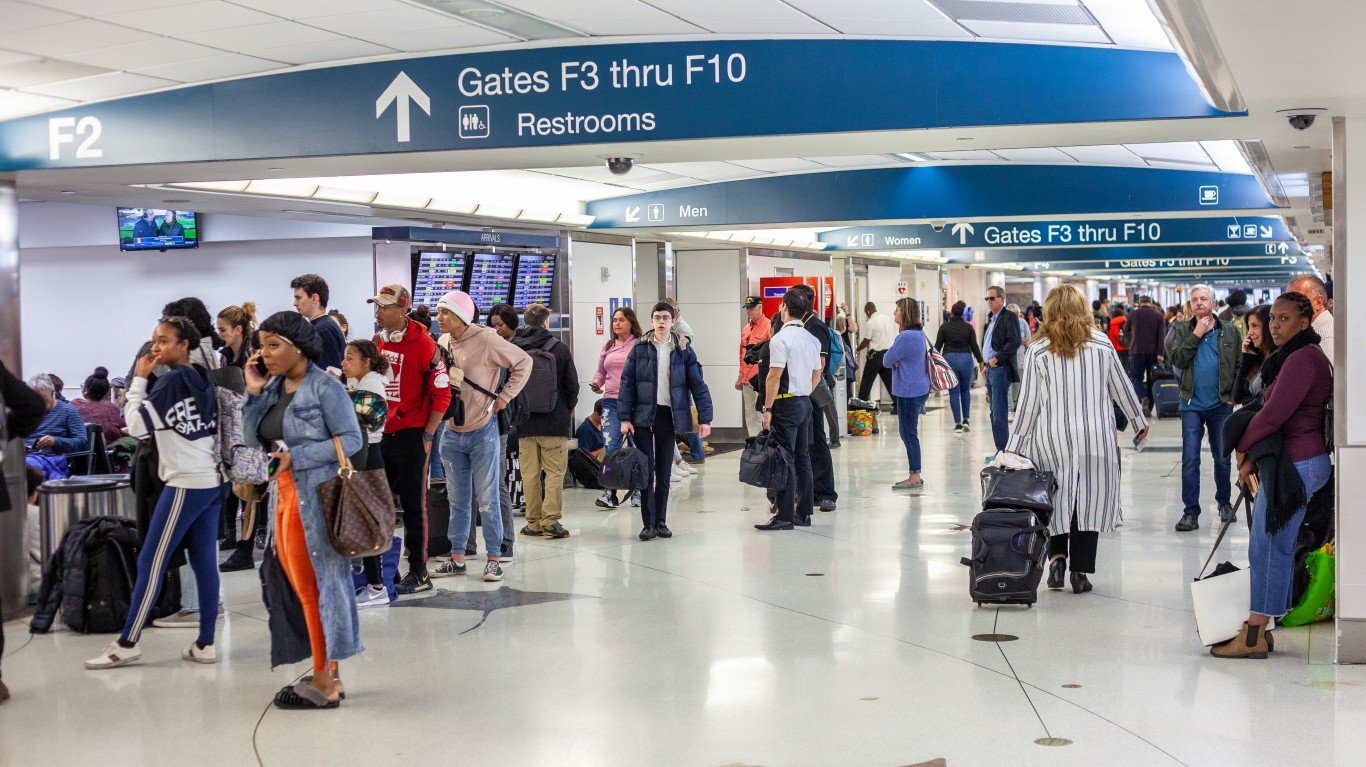
6. Fort Lauderdale-Hollywood International Airport
> Location: Fort Lauderdale, FL
> Airport code: FLL
> Percentage of flights canceled, Jan.-June, 2023: 2.47%

5. Norfolk International Airport
> Location: Norfolk, VA
> Airport code: ORF
> Percentage of flights canceled, Jan.-June, 2023: 2.51%
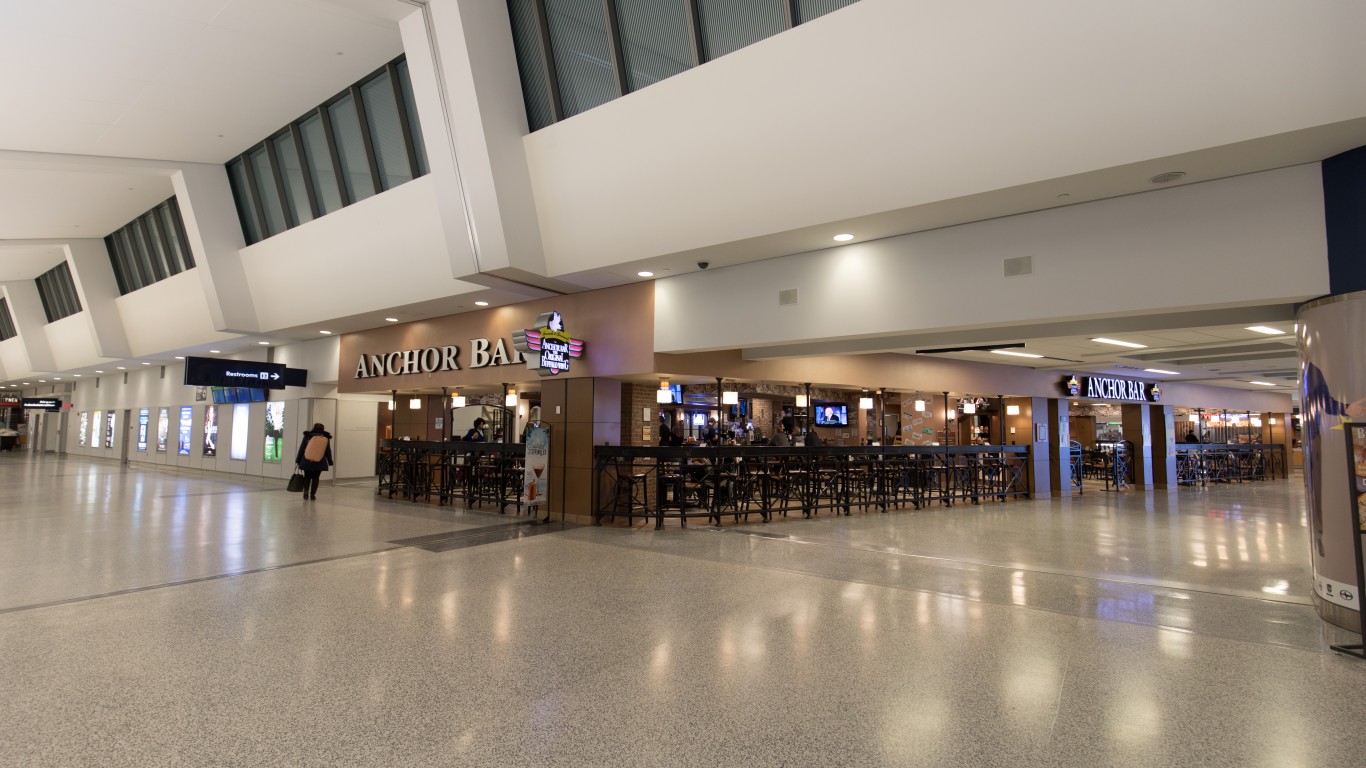
4. Buffalo Niagara International Airport
> Location: Buffalo, NY
> Airport code: BUF
> Percentage of flights canceled, Jan.-June, 2023: 2.52%
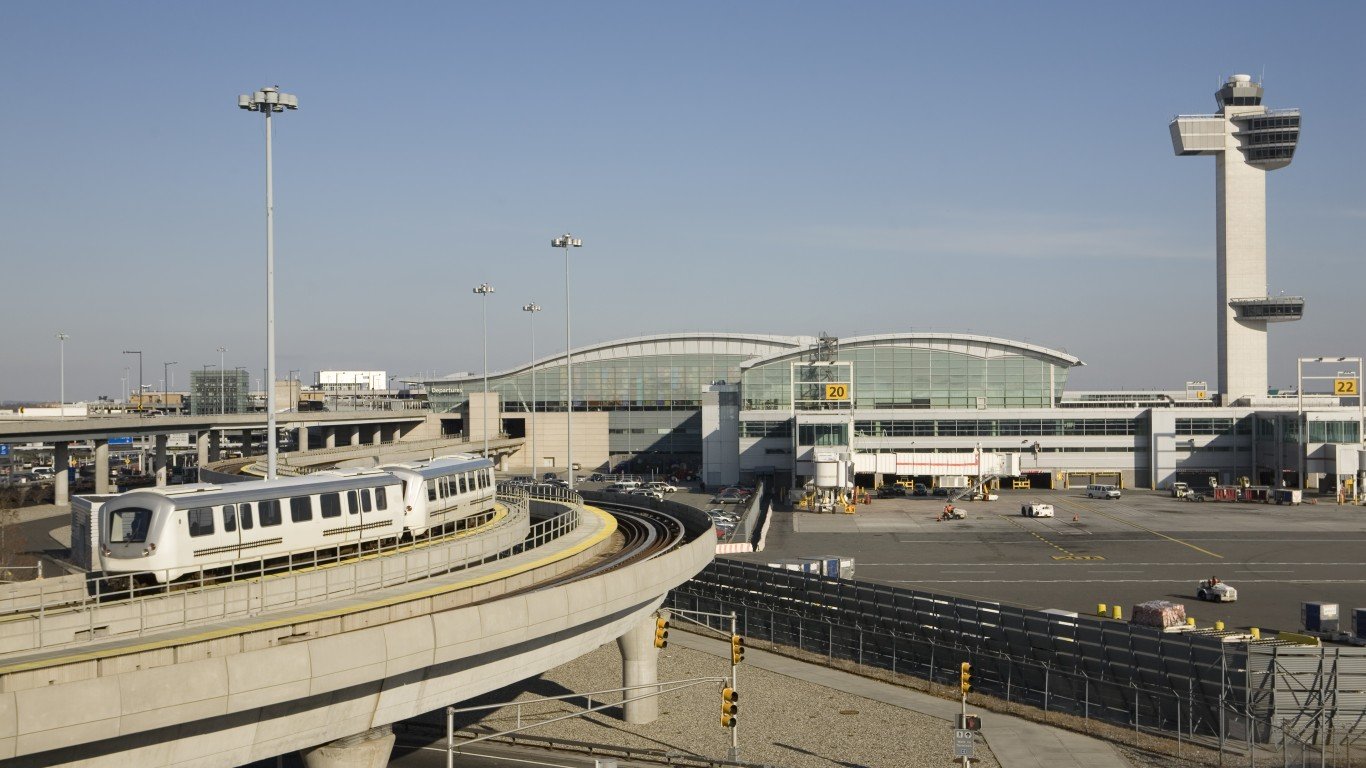
3. John F. Kennedy International Airport
> Location: New York, NY
> Airport code: JFK
> Percentage of flights canceled, Jan.-June, 2023: 2.91%
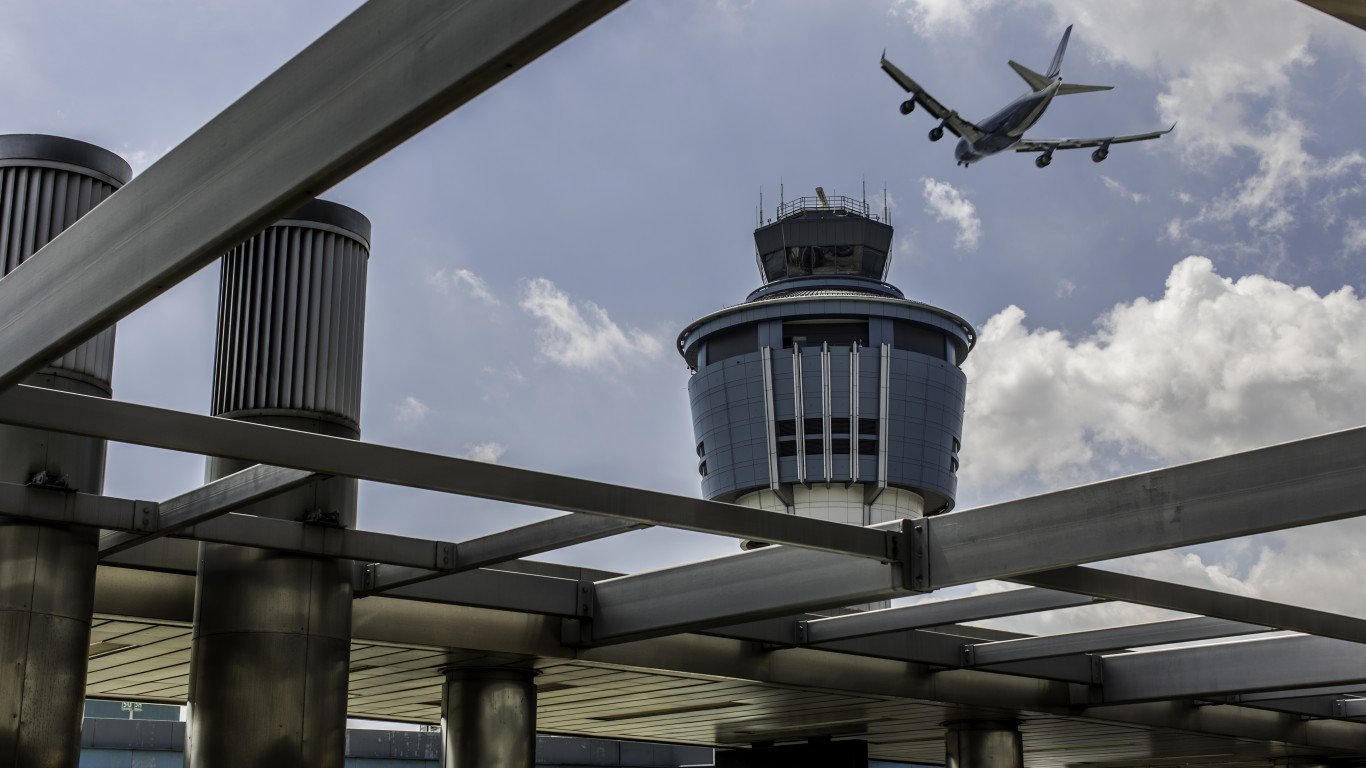
2. LaGuardia Airport
> Location: New York, NY
> Airport code: LGA
> Percentage of flights canceled, Jan.-June, 2023: 3.32%
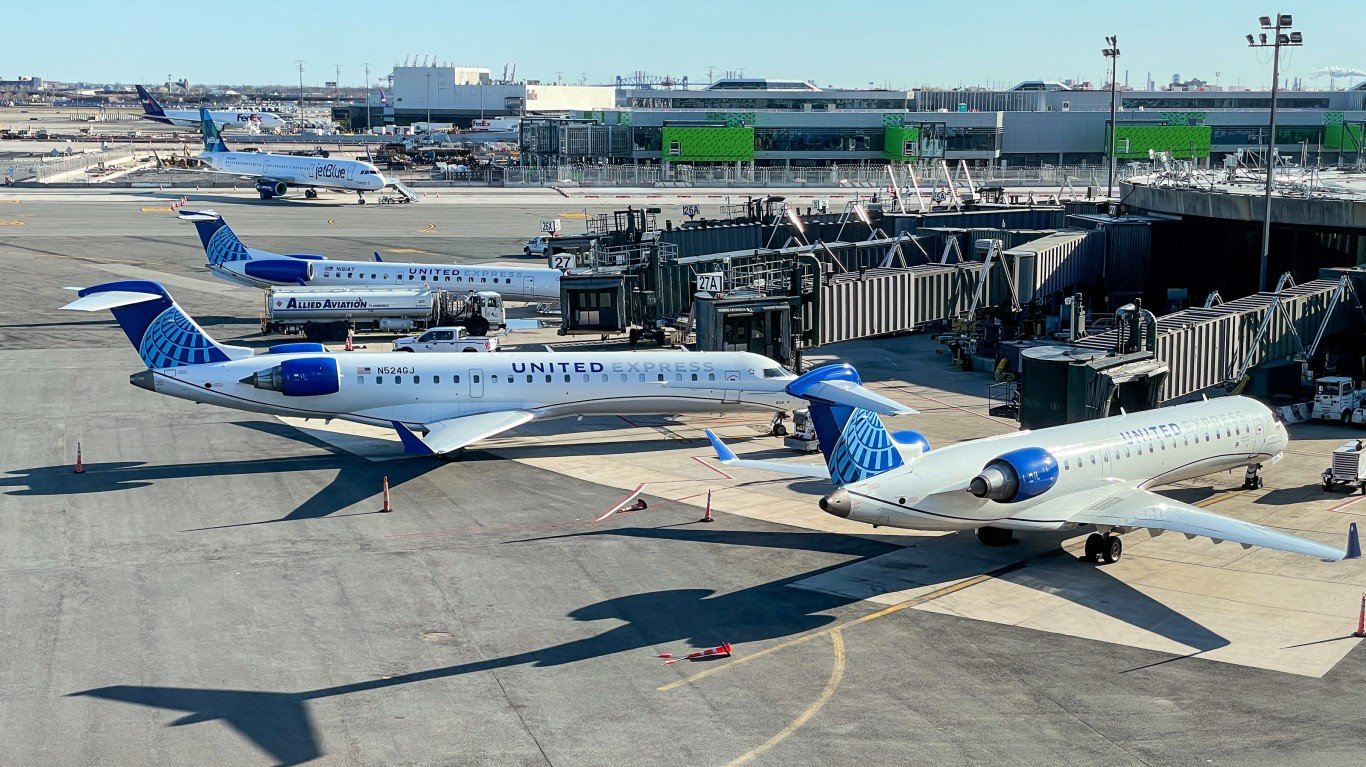
1. Newark Liberty International Airport
> Location: Newark, NJ
> Airport code: EWR
> Percentage of flights canceled, Jan.-June, 2023: 3.78%