Air travel is now harder than it’s been in years. Airlines are short staffed. This includes pilots who retired during the pandemic, and onboard crews who do not believe they are paid enough. The same goes for baggage handlers and other ground crew. It’s no wonder that on-time arrivals and departures are affected – more so at some airports than others. And by this measure, the worst U.S. airport for summer travel is apt to be Newark Liberty International in New Jersey. (Newark also has the distinction of being one of the worst cities for airport layovers.)
In addition to staffing issues, other factors affect airline performance and airport efficiency. Passenger violence has exploded, for instance. Some blame this on mental instability caused by COVID-19. Whatever the cause, people are routinely taken off planes for poor behavior and occasionally have been arrested. (See 50 ways air travel has changed over the last 100 years.)
Weather has been unstable across much of the United States this year as well. Flight delays and cancellations have vexed fliers. One example is that on a single Monday last month, according to a headline on Thrillist, “Over 1,400 Delays & Cancellations Hit NYC Airports Due to Severe Weather.”
Yet another challenge is ticket sales. Due to high demand and even higher jet fuel prices, airline ticket prices have soared. CNBC recently reported that ticket prices were up 25% in April according to the Bureau of Labor Statistics Consumer Price Index report. Prices won’t ease over the next few months, and could be even worse by the winter holidays
To determine what are likely to be the worst U.S. airports for summer travel this year, based on on-time arrivals and departures for 2021, 24/7 Tempo reviewed the annual airport rankings published by AirHelp, a claims management company associated with the Association of Passenger Rights Advocates.
The AirHelp data, covering on-time performance for over 100,000 flights last year, is based on flight information displays, transponders and airport radar terminals, and air traffic control systems, among other sources, and is self-reported. Information on annual domestic arrivals, departures, and primary airline at each airport in 2021 comes from the U.S. Bureau of Transportation Statistics.
Bear in mind that this data may be misleading to the extent that problems affecting on-time performance have worsened over the past year.
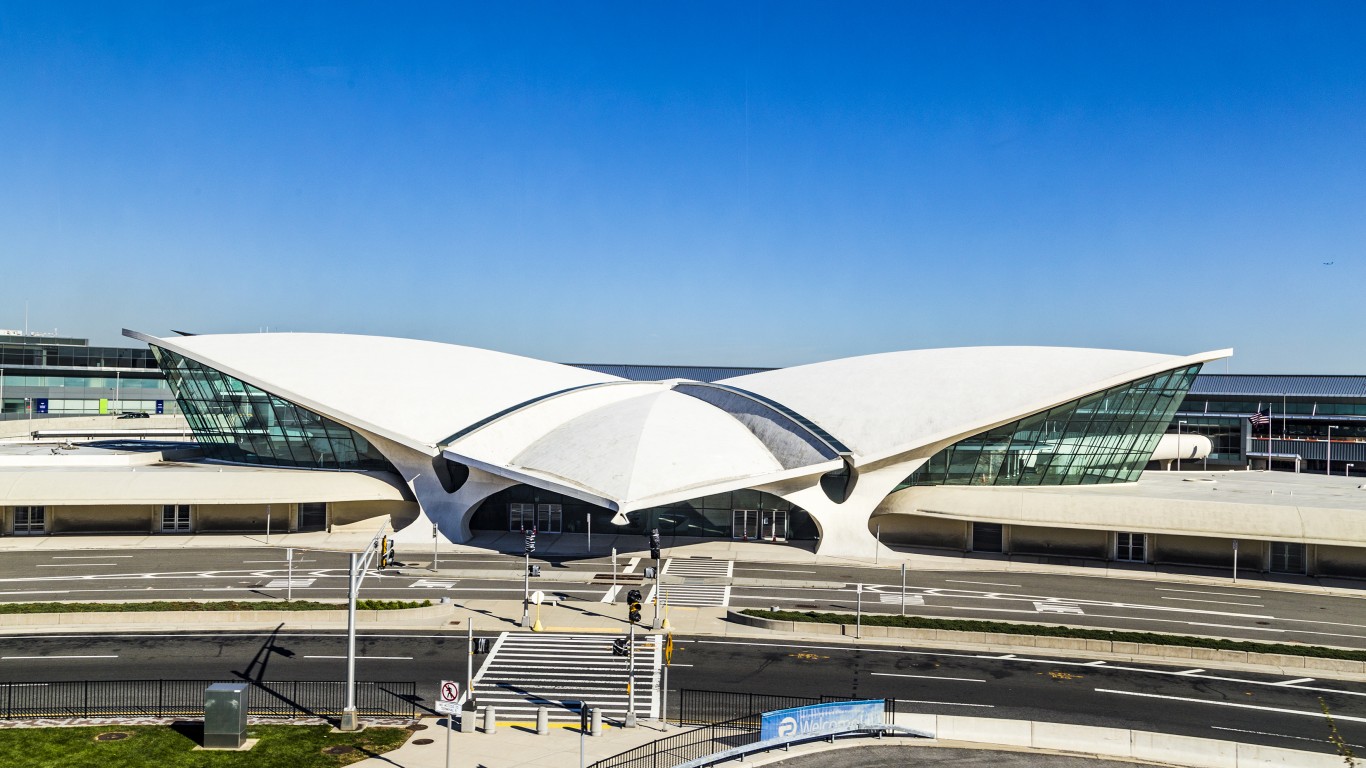
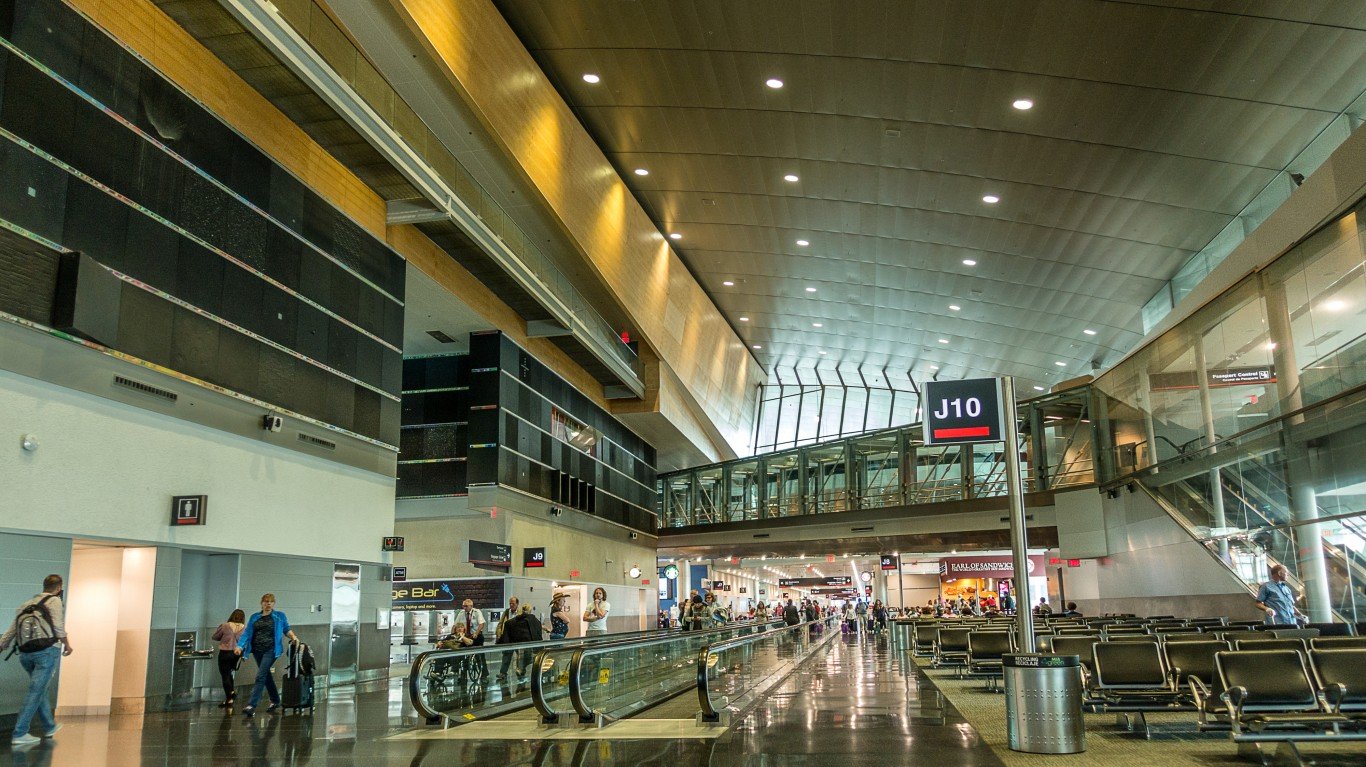
10. New York JFK International Airport (JFK)
> Primary airline: JetBlue (38.2% of passenger traffic)
> Domestic arrivals, 2021: 9.0 million
> Domestic departures, 2021: 8.9 million
> On time performance, 2021: 79.40%
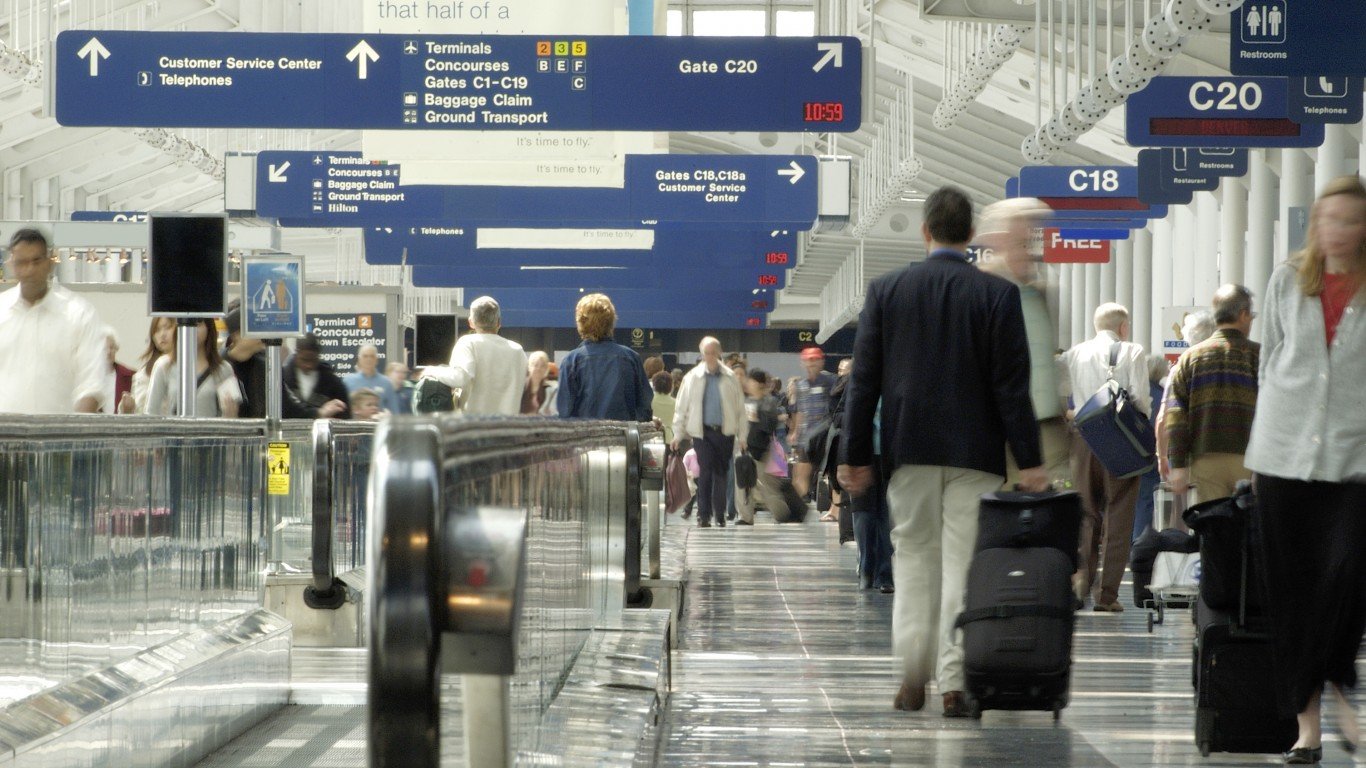
9. Chicago O’Hare International Airport (ORD)
> Primary airline: United (28.0% of passenger traffic)
> Domestic arrivals, 2021: 23.8 million
> Domestic departures, 2021: 23.7 million
> On time performance, 2021: 79.00%

8. Houston George Bush Intercontinental Airport (IAH)
> Primary airline: United (46.7% of passenger traffic)
> Domestic arrivals, 2021: 13.0 million
> Domestic departures, 2021: 13.0 million
> On time performance, 2021: 77.75%
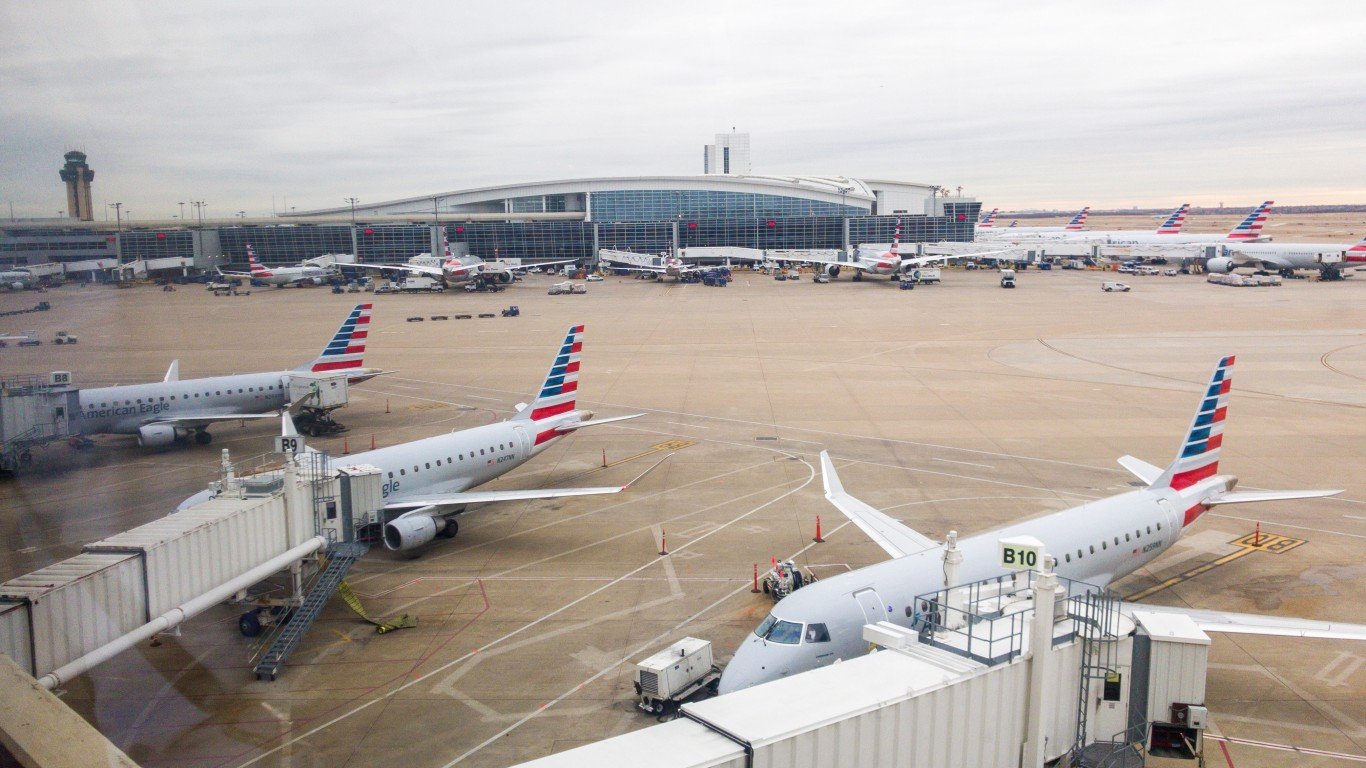
7. Dallas Fort Worth International Airport (DFW)
> Primary airline: American (66.0% of passenger traffic)
> Domestic arrivals, 2021: 27.1 million
> Domestic departures, 2021: 27.1 million
> On time performance, 2021: 76.65%
6. Miami International Airport (MIA)
> Primary airline: American (59.1% of passenger traffic)
> Domestic arrivals, 2021: 11.7 million
> Domestic departures, 2021: 11.6 million
> On time performance, 2021: 76.60%
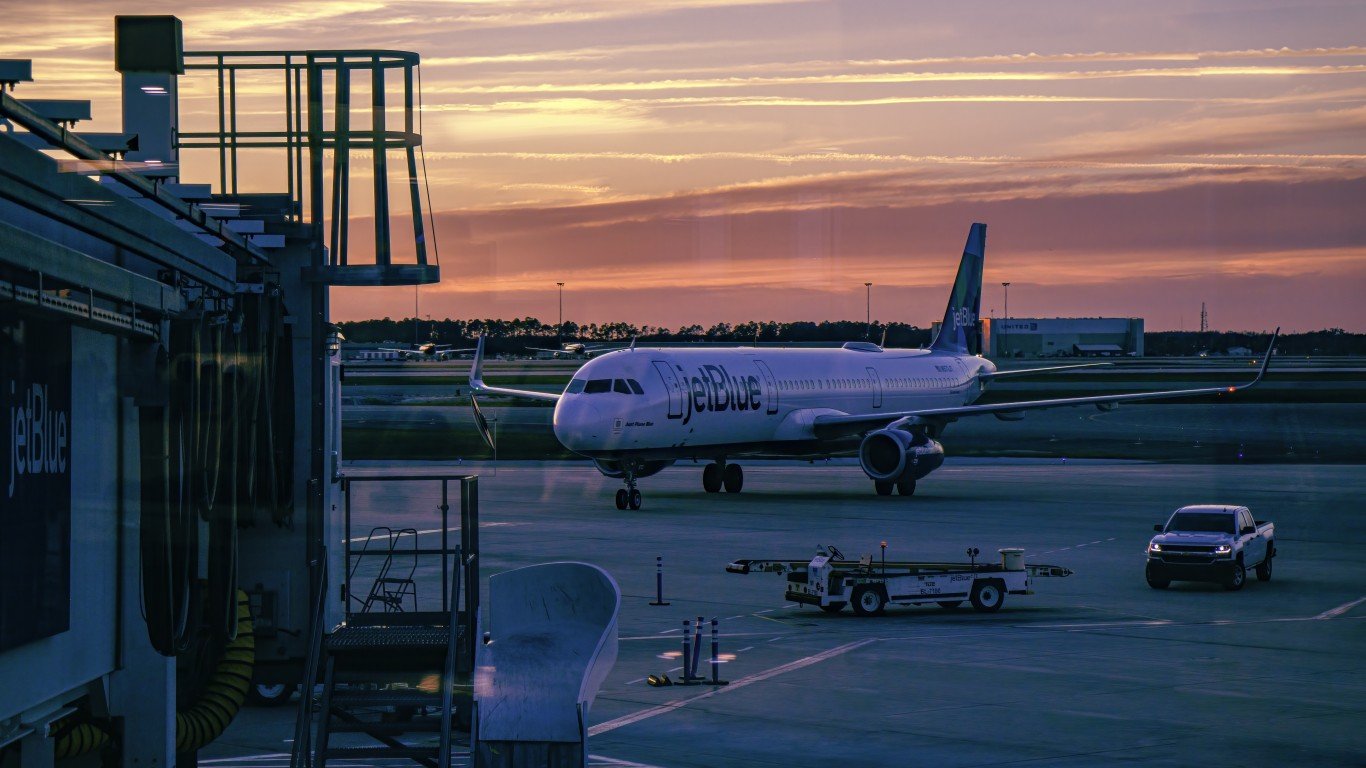
5. Orlando International Airport (MCO)
> Primary airline: Southwest (24.0% of passenger traffic)
> Domestic arrivals, 2021: 18.8 million
> Domestic departures, 2021: 18.7 million
> On time performance, 2021: 75.99%
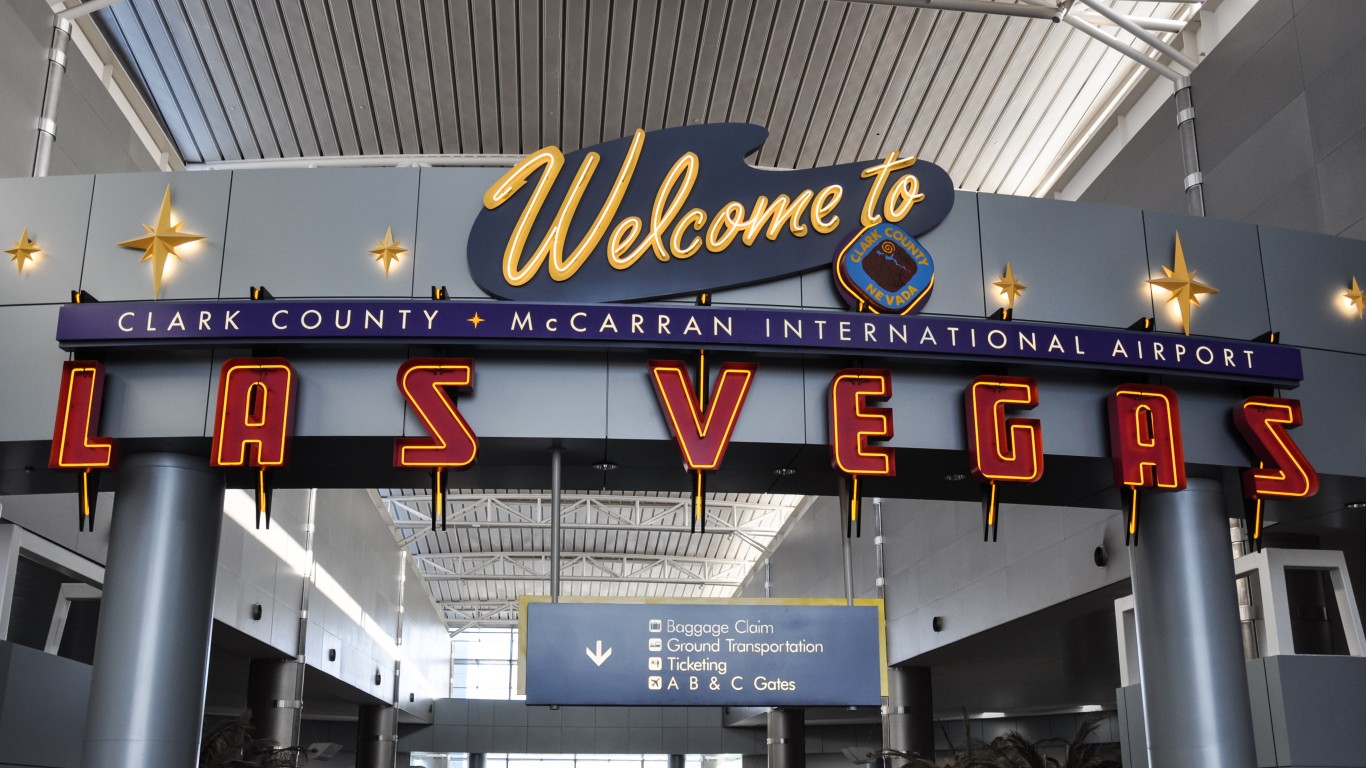
4. Las Vegas McCarran International Airport (LAS)
> Primary airline: Southwest (36.8% of passenger traffic)
> Domestic arrivals, 2021: 18.7 million
> Domestic departures, 2021: 18.6 million
> On time performance, 2021: 75.60%

3. Fort Lauderdale/Hollywood International Airport (FLL)
> Primary airline: Spirit (30.5% of passenger traffic)
> Domestic arrivals, 2021: 11.7 million
> Domestic departures, 2021: 11.6 million
> On time performance, 2021: 75.14%

2. Denver International Airport (DEN)
> Primary airline: Southwest (32.5% of passenger traffic)
> Domestic arrivals, 2021: 27.7 million
> Domestic departures, 2021: 27.7 million
> On time performance, 2021: 74.84%

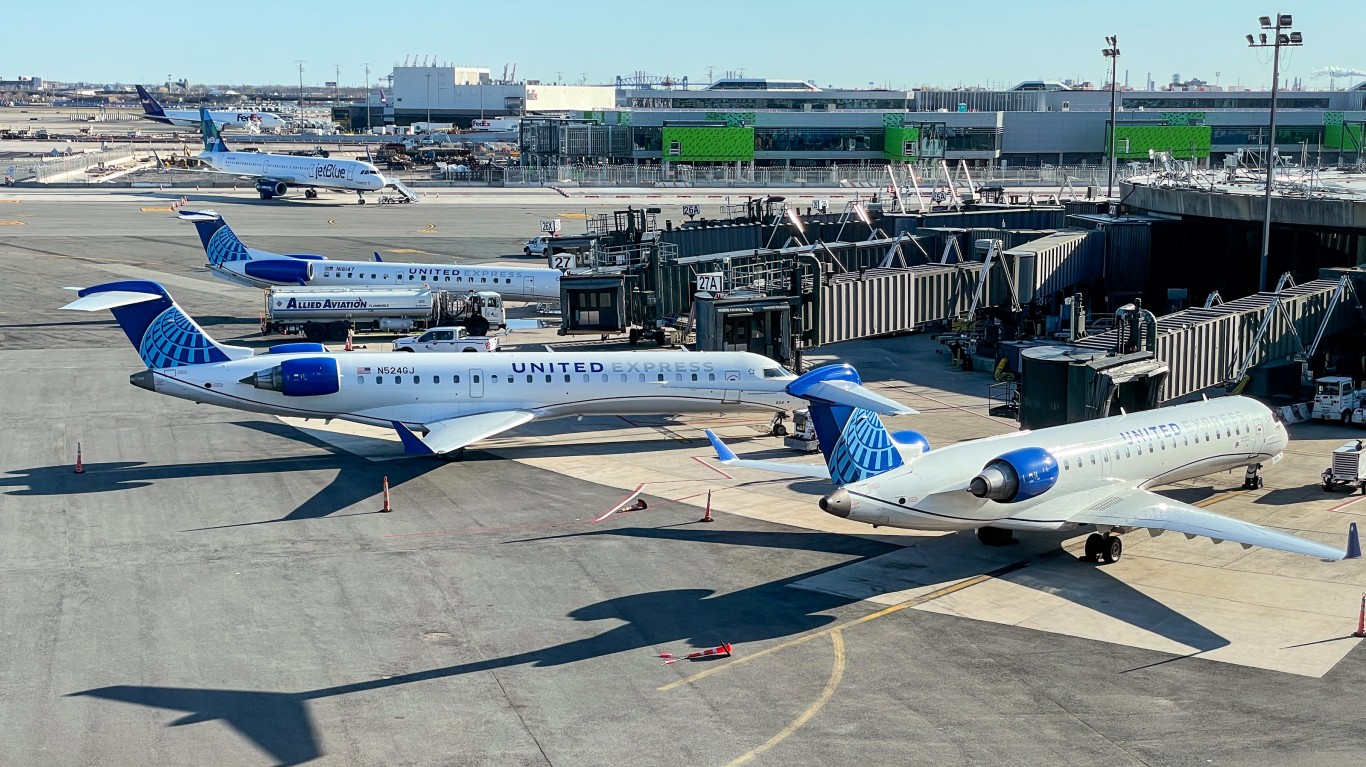
1. Newark Liberty International Airport (EWR)
> Primary airline: United (48.2% of passenger traffic)
> Domestic arrivals, 2021: 11.3 million
> Domestic departures, 2021: 11.3 million
> On time performance, 2021: 74.01%